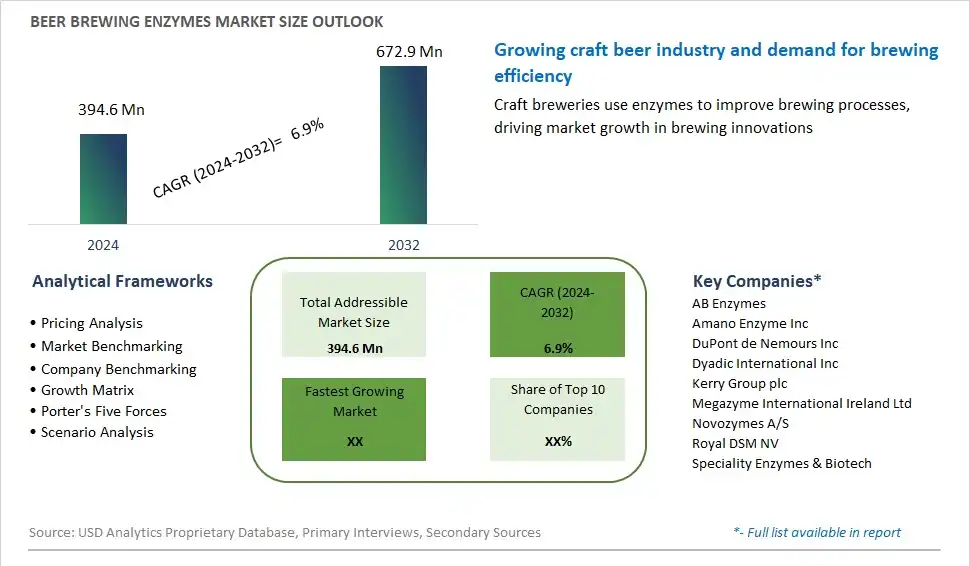
Global Beer Brewing Enzymes Market Size is valued at $394.6 Million in 2024 and is forecast to register a growth rate (CAGR) of 6.9% to reach $672.9 Million by 2032.
The global Beer Brewing Enzymes Market Comprehensive Study analyzes and forecasts the market size across 6 regions and 24 countries for diverse segments -By Form (Liquid Enzymes, Powder Enzymes, Granular Enzymes), By Application (Maturation Process, Filtration Process, Fermentation Process, Mashing Process), By Brewery Size (Microbrewery, Craft Brewery, Macrobrewery)
An Introduction to Beer Brewing Enzymes Market
Beer brewing enzymes are enzymes used in the beer production process to facilitate starch conversion, fermentable sugar release, and flavor development in 2024. These enzymes play essential roles in mashing, lautering, and fermentation stages of brewing, where they break down complex carbohydrates in malted grains into fermentable sugars and other soluble compounds that yeast can metabolize during fermentation. Common beer brewing enzymes include amylases, proteases, beta-glucanases, and phytases, each targeting specific substrates and contributing to the efficiency and quality of beer production. With the craft beer movement, growing consumer demand for innovative beer styles, and emphasis on brewing efficiency and sustainability, the market for beer brewing enzymes is expanding, driven by innovations in enzyme engineering, brewing technology, and process optimization that enable brewers to achieve desired flavor profiles, improve brewing efficiency, and reduce production costs while meeting consumer preferences and quality standards.
Beer Brewing Enzymes Competitive Landscape
The market report analyses the leading companies in the industry including AB Enzymes, Amano Enzyme Inc, DuPont de Nemours Inc, Dyadic International Inc, Kerry Group plc, Megazyme International Ireland Ltd, Novozymes A/S, Royal DSM NV, Speciality Enzymes & Biotech, and Others.
Beer Brewing Enzymes Market Dynamics
Beer Brewing Enzymes Market Trend: Growing Demand for Craft Beer and Microbreweries
The market for beer brewing enzymes is experiencing a prominent trend driven by the growing demand for craft beer and the rise of microbreweries. Craft beer enthusiasts are increasingly seeking unique and flavorful brews, spurring the proliferation of small-scale breweries and artisanal beer producers. Beer brewing enzymes play a crucial role in enhancing the brewing process, improving efficiency, and achieving desired flavor profiles. This trend is fueled by consumer preferences for high-quality, small-batch beers with distinct characteristics, as well as the craft beer movement's emphasis on innovation and experimentation. As a result, there is a growing demand for specialized beer brewing enzymes tailored to the needs of craft brewers, driving market growth and diversification.
Market Driver: Advancements in Brewing Technology and Process Optimization
A significant driver of the beer brewing enzymes market is advancements in brewing technology and process optimization. Brewers are constantly seeking ways to improve brewing efficiency, reduce production costs, and enhance beer quality and consistency. Enzymes offer valuable benefits such as increased fermentability, improved clarity, and enhanced flavor stability, making them essential tools for optimizing brewing processes. Moreover, advancements in enzyme engineering and formulation techniques have led to the development of specialized enzyme products designed to address specific brewing challenges, such as haze reduction, foam stability, and alcohol yield optimization. The drive for innovation and continuous improvement in brewing practices is fueling the demand for beer brewing enzymes among breweries of all sizes, driving market expansion and adoption.
Market Opportunity: Expansion into Sustainable Brewing Practices and Green Technologies
An opportunity for the beer brewing enzymes market lies in expansion into sustainable brewing practices and green technologies. With increasing environmental concerns and a growing focus on sustainability across industries, breweries are seeking ways to reduce their environmental footprint and adopt eco-friendly practices. Enzymes offer potential solutions for breweries looking to improve resource efficiency, minimize waste, and reduce energy consumption in the brewing process. For example, enzymes can be used to enhance raw material utilization, optimize water usage, and reduce the need for harsh chemicals in cleaning and sanitation processes. By promoting the use of beer brewing enzymes as part of sustainable brewing practices, enzyme suppliers can align with the industry's sustainability goals and differentiate their products in the market. Additionally, there is potential for developing enzyme products specifically designed for eco-friendly brewing processes, offering breweries a competitive edge in the growing market for sustainable beer production.
Beer Brewing Enzymes Market Share Analysis: Liquid Enzymes held the dominant market share in 2024
The liquid enzymes segment commands the largest share in the beer brewing enzymes market due to its ease of use, versatility, and effectiveness in various brewing processes. Liquid enzymes offer brewers the convenience of easy handling and dosing, facilitating precise control over enzyme addition during mashing, fermentation, and conditioning stages. Additionally, liquid enzymes are readily soluble in water, ensuring uniform distribution and efficient enzymatic activity throughout the brewing process. Further, liquid enzymes are often preferred for their stability and shelf life, allowing brewers to maintain consistent brewing performance and product quality over time. As a result, liquid enzymes emerge as the largest segment in the beer brewing enzymes market, meeting the evolving needs of brewers for efficient and reliable enzymatic solutions.
Beer Brewing Enzymes Market Share Analysis: Filtration Process market is poised to register the fastest growth rae over the forecast period to 2032
The filtration process segment is experiencing the fastest growth in the beer brewing enzymes market, driven by the increasing adoption of enzymatic solutions to enhance filtration efficiency and beer clarity. Enzymes play a crucial role in the filtration process by breaking down complex proteins and polysaccharides that can cause haze and turbidity in beer. Brewers are increasingly turning to enzymatic treatments to improve filtration rates, reduce filtration time, and enhance the overall quality and stability of the final product. Further, as consumer preferences shift towards clearer and visually appealing beers, breweries are investing in enzyme-based filtration technologies to meet market demands. Additionally, advancements in enzyme technology, coupled with the growing availability of specialized enzyme formulations tailored for filtration applications, further propel the growth of this segment. Consequently, the filtration process segment is the fastest-growing in the beer brewing enzymes market, catering to the evolving needs of brewers for efficient and cost-effective filtration solutions.
Beer Brewing Enzymes Market Share Analysis: Macrobrewery held the dominant market share in 2024
The macrobrewery segment commands the largest share in the beer brewing enzymes market due to the extensive production scale and high-volume brewing operations characteristic of macrobreweries. Macrobreweries, which produce beer in large quantities for mass distribution, rely heavily on enzymatic solutions to streamline brewing processes, optimize efficiency, and maintain product consistency. Enzymes play a vital role in enhancing fermentation, mashing, and filtration processes, allowing macrobreweries to achieve desired brewing outcomes while minimizing costs and maximizing production throughput. Additionally, macrobreweries often have the resources and infrastructure to invest in advanced brewing technologies and enzyme formulations tailored to their specific production requirements, further consolidating their dominance in the beer brewing enzymes market. As a result, the macrobrewery segment is the largest in the beer brewing enzymes market, meeting the robust demand for enzymatic solutions in large-scale beer production.
Beer Brewing Enzymes Market Segmentation
By Form
Liquid Enzymes
Powder Enzymes
Granular Enzymes
By Application
Maturation Process
Filtration Process
Fermentation Process
Mashing Process
By Brewery Size
Microbrewery
Craft Brewery
Macrobrewery
Countries Analyzed
North America (US, Canada, Mexico)
Europe (Germany, UK, France, Spain, Italy, Russia, Rest of Europe)
Asia Pacific (China, India, Japan, South Korea, Australia, South East Asia, Rest of Asia)
South America (Brazil, Argentina, Rest of South America)
Middle East and Africa (Saudi Arabia, UAE, Rest of Middle East, South Africa, Egypt, Rest of Africa)
Beer Brewing Enzymes Companies Profiled in the Study
AB Enzymes
Amano Enzyme Inc
DuPont de Nemours Inc
Dyadic International Inc
Kerry Group plc
Megazyme International Ireland Ltd
Novozymes A/S
Royal DSM NV
Speciality Enzymes & Biotech
*- List Not Exhaustive
Chapter 1. TABLE OF CONTENTS
Chapter 2. Introduction to Beer Brewing Enzymes Market
2.1. Market Overview
2.2. Key Statistics and Report Highlights
2.3. Scope of the Comprehensive Study
2.3.1. Market Definition
2.3.2 Countries and Regions Covered
2.3.3 Research Objective
2.3.4 Units, Currency, and Conversions
2.3.5 Industry Value Chain
2.4. Key Market Segments
2.5. Key Companies
2.6. Study Period
Chapter 3. Strategic Analysis Review
3.1. Beer Brewing Enzymes Pricing Analysis and Forecast
3.2. Porter’s Five Forces
3.3. Market Ecosystem
3.4. SWOT Analysis
3.5. Regulatory Scenario
3.3. Effects of Inflation, Russia-Ukraine War, moderating economic growth, and other macroeconomic factors
Chapter 4. Competitive Landscape
4.1. Market Share Analysis
4.1.1. Global Beer Brewing Enzymes Market Share by Company, 2023
4.1.2. Product Offerings of Leading Beer Brewing Enzymes Companies
4.2. Market Entropy
4.2.1. New Product Launches in the Industry
4.2.2. Mergers, Acquisitions, Joint ventures, and Partnerships
4.3. Key Strategies and Best Practices
Chapter 5. Global Market Projections: Best, Reference, and Low Case Scenarios
5.1. Growth Analysis- Case Scenario Definitions
5.2. Low Growth Case Scenario Forecasts
5.3. Reference Growth Case Scenario Forecasts
5.4. High Growth Case Scenario Forecasts
Chapter 6. Market Dynamics
6.1. Beer Brewing Enzymes Market Drivers
6.2. Beer Brewing Enzymes Market Challenges
6.6. Beer Brewing Enzymes Market Opportunities
6.4. Beer Brewing Enzymes Market Trends
Chapter 7. Global Beer Brewing Enzymes Market Outlook Trends
7.1. Global Beer Brewing Enzymes Revenue (USD Million) and CAGR (%) by Type (2021-2032)
7.2. Global Beer Brewing Enzymes Revenue (USD Million) and CAGR (%) by Application (2021-2032)
7.3. Global Beer Brewing Enzymes Revenue (USD Million) and CAGR (%) by Product (2021-2032)
By Form
Liquid Enzymes
Powder Enzymes
Granular Enzymes
By Application
Maturation Process
Filtration Process
Fermentation Process
Mashing Process
By Brewery Size
Microbrewery
Craft Brewery
Macrobrewery
Chapter 8. Global Beer Brewing Enzymes Regional Analysis and Outlook
8.1. Global Beer Brewing Enzymes Revenue (USD Million) By Regions (2021- 2032)
8.2. North America Beer Brewing Enzymes Revenue (USD Million) by Country (2021-2032)
8.2.1. United States Beer Brewing Enzymes Regional Analysis and Outlook
8.2.2. Canada Beer Brewing Enzymes Regional Analysis and Outlook
8.2.3. Mexico Beer Brewing Enzymes Regional Analysis and Outlook
8.3. Europe Beer Brewing Enzymes Revenue (USD Million), by Country (2021-2032)
8.3.1. Germany Beer Brewing Enzymes Regional Analysis and Outlook
8.3.2. France Beer Brewing Enzymes Regional Analysis and Outlook
8.3.3. United Kingdom Beer Brewing Enzymes Regional Analysis and Outlook
8.3.4. Spain Beer Brewing Enzymes Regional Analysis and Outlook
8.3.5. Italy Beer Brewing Enzymes Regional Analysis and Outlook
8.3.6. Russia Beer Brewing Enzymes Regional Analysis and Outlook
8.3.7. Rest of Europe Beer Brewing Enzymes Regional Analysis and Outlook
8.4. Asia Pacific Beer Brewing Enzymes Revenue (USD Million) by Country (2021-2032)
8.4.1. China Beer Brewing Enzymes Regional Analysis and Outlook
8.4.2. Japan Beer Brewing Enzymes Regional Analysis and Outlook
8.4.3. India Beer Brewing Enzymes Regional Analysis and Outlook
8.4.4. South Korea Beer Brewing Enzymes Regional Analysis and Outlook
8.4.5. Australia Beer Brewing Enzymes Regional Analysis and Outlook
8.4.6. South East Asia Beer Brewing Enzymes Regional Analysis and Outlook
8.4.7. Rest of Asia Pacific Beer Brewing Enzymes Regional Analysis and Outlook
8.5. South America Beer Brewing Enzymes Revenue (USD Million), by Country (2021-2032)
8.5.1. Brazil Beer Brewing Enzymes Regional Analysis and Outlook
8.5.2. Argentina Beer Brewing Enzymes Regional Analysis and Outlook
8.5.3. Rest of South America Beer Brewing Enzymes Regional Analysis and Outlook
8.6. Middle East and Africa Beer Brewing Enzymes Revenue (USD Million) by Country (2021-2032)
8.6.1. Middle East Beer Brewing Enzymes Regional Analysis and Outlook
8.6.2. Africa Beer Brewing Enzymes Regional Analysis and Outlook
Chapter 9. North America Beer Brewing Enzymes Analysis and Outlook
9.1. North America Beer Brewing Enzymes Revenue (USD Million) by Segments (2021-2032)
9.1.1. North America Beer Brewing Enzymes Revenue (USD Million) by Type (2021-2032)
9.1.2. North America Beer Brewing Enzymes Revenue (USD Million) by Application (2021-2032)
9.1.3. North America Beer Brewing Enzymes Revenue (USD Million) by Product (2021-2032)
By Form
Liquid Enzymes
Powder Enzymes
Granular Enzymes
By Application
Maturation Process
Filtration Process
Fermentation Process
Mashing Process
By Brewery Size
Microbrewery
Craft Brewery
Macrobrewery
Chapter 10. Europe Beer Brewing Enzymes Analysis and Outlook
10.1. Europe Beer Brewing Enzymes Revenue (USD Million), by Segments (USD Million) (2021-2032)
10.1.1. Europe Beer Brewing Enzymes Revenue (USD Million) by Type (2021-2032)
10.1.2. Europe Beer Brewing Enzymes Revenue (USD Million) by Application (2021-2032)
10.1.3. Europe Beer Brewing Enzymes Revenue (USD Million) by Product (2021-2032)
By Form
Liquid Enzymes
Powder Enzymes
Granular Enzymes
By Application
Maturation Process
Filtration Process
Fermentation Process
Mashing Process
By Brewery Size
Microbrewery
Craft Brewery
Macrobrewery
Chapter 11. Asia Pacific Beer Brewing Enzymes Analysis and Outlook
11.1. Asia Pacific Beer Brewing Enzymes Revenue (USD Million), and Revenue (USD Million) by Segments (2021-2032)
11.1.1. Asia Pacific Beer Brewing Enzymes Revenue (USD Million) by Type (2021-2032)
11.1.2. Asia Pacific Beer Brewing Enzymes Revenue (USD Million) by Application (2021-2032)
11.1.3. Asia Pacific Beer Brewing Enzymes Revenue (USD Million) by Product (2021-2032)
By Form
Liquid Enzymes
Powder Enzymes
Granular Enzymes
By Application
Maturation Process
Filtration Process
Fermentation Process
Mashing Process
By Brewery Size
Microbrewery
Craft Brewery
Macrobrewery
Chapter 12. South America Beer Brewing Enzymes Analysis and Outlook
12.1. South America Beer Brewing Enzymes Revenue (USD Million), by Segments (2021-2032)
12.1.1. South America Beer Brewing Enzymes Revenue (USD Million) by Type (2021-2032)
12.1.2. South America Beer Brewing Enzymes Revenue (USD Million) by Application (2021-2032)
12.1.3. South America Beer Brewing Enzymes Revenue (USD Million) by Product (2021-2032)
By Form
Liquid Enzymes
Powder Enzymes
Granular Enzymes
By Application
Maturation Process
Filtration Process
Fermentation Process
Mashing Process
By Brewery Size
Microbrewery
Craft Brewery
Macrobrewery
Chapter 13. Middle East and Africa Beer Brewing Enzymes Analysis and Outlook
13.1. Middle East and Africa Beer Brewing Enzymes Revenue (USD Million), by Segments (2021-2032)
13.1.1. Middle East and Africa Beer Brewing Enzymes Revenue (USD Million) by Type (2021-2032)
13.1.2. Middle East and Africa Beer Brewing Enzymes Revenue (USD Million) by Application (2021-2032)
13.1.3. Middle East and Africa Beer Brewing Enzymes Revenue (USD Million) by Product (2021-2032)
By Form
Liquid Enzymes
Powder Enzymes
Granular Enzymes
By Application
Maturation Process
Filtration Process
Fermentation Process
Mashing Process
By Brewery Size
Microbrewery
Craft Brewery
Macrobrewery
Chapter 14. Beer Brewing Enzymes Company Profiles
14.1 Business Overview
14.2 Product Profiles
14.3 SWOT Profiles
14.5 Recent Developments
14.6 Financial Profile
List of Companies
AB Enzymes
Amano Enzyme Inc
DuPont de Nemours Inc
Dyadic International Inc
Kerry Group plc
Megazyme International Ireland Ltd
Novozymes A/S
Royal DSM NV
Speciality Enzymes & Biotech
15. Methodology and Data Sources
15.1 Customization Offerings
15.2 Subscription Services
15.3 Related Reports
15.4 Publisher Expertise
LIST OF TABLES
Table 1 Market Segmentation Analysis
Table 2 Global Beer Brewing Enzymes Market Share of Leading Companies, 2023
Table 3 Product Offerings of Leading Companies
Table 4 Low Growth Scenario Forecasts
Table 5 Reference Case Growth Scenario
Table 6 High Growth Case Scenario
Table 7 Global Beer Brewing Enzymes Revenue (USD Million) And CAGR (%) By Type (2021-2032)
Table 8 Global Beer Brewing Enzymes Revenue (USD Million) And CAGR (%) By Application (2021-2032)
Table 9 Global Beer Brewing Enzymes Revenue (USD Million) And CAGR (%) By Product (2021-2032)
Table 10 Global Beer Brewing Enzymes Market Revenue (USD Million) By Regions (2021-2032)
Table 11 Global Beer Brewing Enzymes Market Share (%) By Regions (2021-2032)
Table 12 North America Beer Brewing Enzymes Revenue (USD Million) By Country (2021-2032)
Table 13 Europe Beer Brewing Enzymes Revenue (USD Million) By Country (2021-2032)
Table 14 Asia Pacific Beer Brewing Enzymes Revenue (USD Million) By Country (2021-2032)
Table 15 South America Beer Brewing Enzymes Revenue (USD Million) By Country (2021-2032)
Table 16 Middle East and Africa Beer Brewing Enzymes Revenue (USD Million) By Region (2021-2032)
Table 17 North America Beer Brewing Enzymes Revenue (USD Million) By Type (2021-2032)
Table 18 North America Beer Brewing Enzymes Revenue (USD Million) By Application (2021-2032)
Table 19 North America Beer Brewing Enzymes Revenue (USD Million) By Product (2021-2032)
Table 20 Europe Beer Brewing Enzymes Revenue (USD Million) By Type (2021-2032)
Table 21 Europe Beer Brewing Enzymes Revenue (USD Million) By Application (2021-2032)
Table 22 Europe Beer Brewing Enzymes Revenue (USD Million) By Product (2021-2032)
Table 23 Asia Pacific Beer Brewing Enzymes Revenue (USD Million) By Type (2021-2032)
Table 24 Asia Pacific Beer Brewing Enzymes Revenue (USD Million) By Application (2021-2032)
Table 25 Asia Pacific Beer Brewing Enzymes Revenue (USD Million) By Product (2021-2032)
Table 26 South America Beer Brewing Enzymes Revenue (USD Million) By Type (2021-2032)
Table 27 South America Beer Brewing Enzymes Revenue (USD Million) By Application (2021-2032)
Table 28 South America Beer Brewing Enzymes Revenue (USD Million) By Product (2021-2032)
Table 29 Middle East and Africa Beer Brewing Enzymes Revenue (USD Million) By Type (2021-2032)
Table 30 Middle East and Africa Beer Brewing Enzymes Revenue (USD Million) By Application (2021-2032)
Table 31 Middle East and Africa Beer Brewing Enzymes Revenue (USD Million) By Product (2021-2032)
LIST OF FIGURES
Figure 1. Market Scope
Figure 2. Pricing Forecasts Per Unit, 2023- 2032
Figure 3. Porter’s Five Forces
Figure 4. Global Beer Brewing Enzymes Market Revenue (USD Million) By Regions (2021-2032)
Figure 5. Global Beer Brewing Enzymes Market Share (%) By Regions (2023)
Figure 6. North America Beer Brewing Enzymes Revenue (USD Million) By Country (2021-2032)
Figure 7. United States Beer Brewing Enzymes Revenue (USD Million) By Country (2021-2032)
Figure 8. Canada Beer Brewing Enzymes Revenue (USD Million) By Country (2021-2032)
Figure 9. Mexico Beer Brewing Enzymes Revenue (USD Million) By Country (2021-2032)
Figure 10. Europe Beer Brewing Enzymes Revenue (USD Million) By Country (2021-2032)
Figure 11. Germany Beer Brewing Enzymes Revenue (USD Million) By Country (2021-2032)
Figure 12. France Beer Brewing Enzymes Revenue (USD Million) By Country (2021-2032)
Figure 13. United Kingdom Beer Brewing Enzymes Revenue (USD Million) By Country (2021-2032)
Figure 14. Spain Beer Brewing Enzymes Revenue (USD Million) By Country (2021-2032)
Figure 15. Italy Beer Brewing Enzymes Revenue (USD Million) By Country (2021-2032)
Figure 16. Russia Beer Brewing Enzymes Revenue (USD Million) By Country (2021-2032)
Figure 17. Rest of Europe Beer Brewing Enzymes Revenue (USD Million) By Country (2021-2032)
Figure 11. Asia Pacific Beer Brewing Enzymes Revenue (USD Million) By Country (2021-2032)
Figure 12. China Beer Brewing Enzymes Revenue (USD Million) By Country (2021-2032)
Figure 13. Japan Beer Brewing Enzymes Revenue (USD Million) By Country (2021-2032)
Figure 14. India Beer Brewing Enzymes Revenue (USD Million) By Country (2021-2032)
Figure 15. South Korea Beer Brewing Enzymes Revenue (USD Million) By Country (2021-2032)
Figure 16. Australia Beer Brewing Enzymes Revenue (USD Million) By Country (2021-2032)
Figure 17. South East Asia Beer Brewing Enzymes Revenue (USD Million) By Country (2021-2032)
Figure 18. South America Beer Brewing Enzymes Revenue (USD Million) By Country (2021-2032)
Figure 19. Brazil Beer Brewing Enzymes Revenue (USD Million) By Country (2021-2032)
Figure 20. Argentina Beer Brewing Enzymes Revenue (USD Million) By Country (2021-2032)
Figure 21. Rest of Asia Pacific Beer Brewing Enzymes Revenue (USD Million) By Country (2021-2032)
Figure 22. Middle East and Africa Beer Brewing Enzymes Revenue (USD Million) By Region (2021-2032)
Figure 23. Saudi Arabia Beer Brewing Enzymes Revenue (USD Million) By Region (2021-2032)
Figure 24. The UAE Beer Brewing Enzymes Revenue (USD Million) By Region (2021-2032)
Figure 25. Rest of Middle East Beer Brewing Enzymes Revenue (USD Million) By Region (2021-2032)
Figure 26. South Africa Beer Brewing Enzymes Revenue (USD Million) By Region (2021-2032)
Figure 27. Africa Beer Brewing Enzymes Revenue (USD Million) By Region (2021-2032)
Figure 28. North America Beer Brewing Enzymes Revenue (USD Million) By Type (2021-2032)
Figure 29. North America Beer Brewing Enzymes Revenue (USD Million) By Application (2021-2032)
Figure 30. North America Beer Brewing Enzymes Revenue (USD Million) By Product (2021-2032)
Figure 31. Europe Beer Brewing Enzymes Revenue (USD Million) By Type (2021-2032)
Figure 32. Europe Beer Brewing Enzymes Revenue (USD Million) By Application (2021-2032)
Figure 33. Europe Beer Brewing Enzymes Revenue (USD Million) By Product (2021-2032)
Figure 34. Asia Pacific Beer Brewing Enzymes Revenue (USD Million) By Type (2021-2032)
Figure 35. Asia Pacific Beer Brewing Enzymes Revenue (USD Million) By Application (2021-2032)
Figure 36. Asia Pacific Beer Brewing Enzymes Revenue (USD Million) By Product (2021-2032)
Figure 37. South America Beer Brewing Enzymes Revenue (USD Million) By Type (2021-2032)
Figure 38. South America Beer Brewing Enzymes Revenue (USD Million) By Application (2021-2032)
Figure 39. South America Beer Brewing Enzymes Revenue (USD Million) By Product (2021-2032)
Figure 40. Middle East and Africa Beer Brewing Enzymes Revenue (USD Million) By Type (2021-2032)
Figure 41. Middle East and Africa Beer Brewing Enzymes Revenue (USD Million) By Application (2021-2032)
Figure 42. Middle East and Africa Beer Brewing Enzymes Revenue (USD Million) By Product (2021-2032)
By Form
Liquid Enzymes
Powder Enzymes
Granular Enzymes
By Application
Maturation Process
Filtration Process
Fermentation Process
Mashing Process
By Brewery Size
Microbrewery
Craft Brewery
Macrobrewery
Countries Analyzed
North America (US, Canada, Mexico)
Europe (Germany, UK, France, Spain, Italy, Russia, Rest of Europe)
Asia Pacific (China, India, Japan, South Korea, Australia, South East Asia, Rest of Asia)
South America (Brazil, Argentina, Rest of South America)
Middle East and Africa (Saudi Arabia, UAE, Rest of Middle East, South Africa, Egypt, Rest of Africa)
