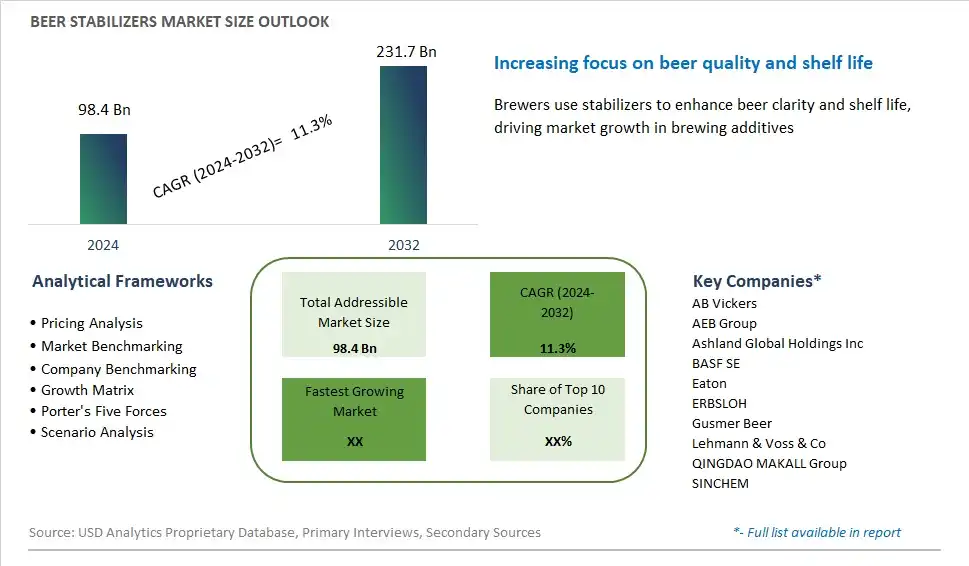
Global Beer Stabilizers Market Size is valued at $98.4 Billion in 2024 and is forecast to register a growth rate (CAGR) of 11.3% to reach $231.7 Billion by 2032.
The global Beer Stabilizers Market Comprehensive Study analyzes and forecasts the market size across 6 regions and 24 countries for diverse segments -By Product (PVPP/R-PVPP, Silica gel, Papain, Xanthan Gum, Others), By Application (Lager, Ale, Stout & Porter, Malt, Others)
An Introduction to Beer Stabilizers Market
Beer stabilizers are additives used in the brewing process to enhance the stability, shelf life, and quality of beer in 2024. These stabilizers help prevent undesirable changes such as haze formation, off-flavors, and microbial spoilage, ensuring that the beer remains fresh and appealing to consumers. Common beer stabilizers include antioxidants, preservatives, fining agents, and clarifying agents, each serving specific functions such as preventing oxidation, inhibiting microbial growth, and promoting clarity. Beer stabilizers are added during various stages of brewing, including fermentation, maturation, and packaging, to maintain product integrity and consistency. With the increasing demand for craft beer, extended shelf life, and global distribution, the market for beer stabilizers is expanding, driven by innovations in stabilizer formulations, application methods, and regulatory compliance that enable brewers to meet quality standards, improve product stability, and enhance consumer satisfaction.
Beer Stabilizers Competitive Landscape
The market report analyses the leading companies in the industry including AB Vickers, AEB Group, Ashland Global Holdings Inc, BASF SE, Eaton, ERBSLOH, Gusmer Beer, Lehmann & Voss & Co, QINGDAO MAKALL Group, SINCHEM, and Others.
Beer Stabilizers Market Dynamics
Beer Stabilizers Market Trend: Rising Demand for Longer Shelf-life and Consistent Quality
The market for beer stabilizers is experiencing a prominent trend driven by the rising demand for longer shelf-life and consistent quality in beer products. Consumers expect beer to maintain its freshness, flavor, and appearance over extended periods, both on the shelf and in the glass. Stabilizers play a crucial role in achieving this by preventing spoilage, haze formation, and off-flavors caused by oxidation, microbial contamination, or protein precipitation. This trend is fueled by the growing competition in the beer industry and the desire of breweries to meet consumer expectations for high-quality, stable products. As a result, there is a growing demand for beer stabilizers that offer effective protection against quality degradation and help breweries maintain product integrity throughout the supply chain.
Market Driver: Expansion of the Craft Beer Market and Quality Assurance Needs
A significant driver of the beer stabilizers market is the expansion of the craft beer market and the increasing emphasis on quality assurance by breweries. Craft breweries, in particular, are experiencing rapid growth and are challenged to maintain consistent quality across their product lines. Stabilizers provide breweries with tools to control and optimize brewing processes, ensuring that their beers meet desired quality standards and customer expectations. Additionally, as craft beer gains popularity and market share, breweries are facing greater pressure to deliver innovative and high-quality products that stand out in a crowded market. The need for reliable stabilization solutions to maintain beer quality and stability is driving demand for beer stabilizers among craft and independent breweries, as well as larger commercial breweries seeking to differentiate their offerings.
Market Opportunity: Innovation in Natural and Clean Label Stabilizers
An opportunity for the beer stabilizers market lies in innovation in natural and clean label stabilizers. With increasing consumer awareness and demand for clean label products made with natural ingredients, breweries are seeking alternatives to traditional stabilizers that may contain synthetic additives or preservatives. Natural stabilizers derived from plant-based sources, such as carrageenan, agar, or pectin, offer potential solutions for breweries looking to meet clean label requirements without compromising on beer stability and quality. Moreover, there is an opportunity for developing innovative stabilization techniques and formulations that utilize enzymes, bio-based polymers, or other natural ingredients to achieve desired stabilization effects while aligning with clean label principles. By offering natural and clean label stabilizer options, suppliers can tap into the growing market for clean label beers and position themselves as leaders in providing sustainable and environmentally friendly stabilization solutions for the brewing industry.
Beer Stabilizers Market Share Analysis: PVPP/R-PVPP held the dominant market share in 2024
The PVPP/R-PVPP segment commands the largest share in the beer stabilizers market due to its widespread use and effectiveness in improving beer clarity and stability. Polyvinylpolypyrrolidone (PVPP), also known as cross-linked polyvinylpyrrolidone, and its modified form, R-PVPP, are commonly used as beer stabilizers to remove polyphenols and haze-forming compounds from beer, resulting in a clearer and visually appealing final product. Brewers rely on PVPP/R-PVPP to prevent chill haze and improve the shelf life of their beers, especially in light- and temperature-sensitive varieties. Additionally, PVPP/R-PVPP is favored for its ease of use, compatibility with various beer styles, and minimal impact on beer flavor and aroma. As a result, the PVPP/R-PVPP segment maintains its dominance in the beer stabilizers market, catering to the needs of brewers for reliable and efficient stabilizing solutions.
Beer Stabilizers Market Share Analysis: Lager market is poised to register the fastest growth rae over the forecast period to 2032
The lager segment is experiencing the fastest growth in the beer stabilizers market due to the increasing demand for clear and visually appealing lagers among consumers worldwide. Lager beers undergo a longer and colder fermentation process compared to ales, resulting in a smoother and crisper taste profile. However, this extended fermentation period can also lead to chill haze formation, compromising beer clarity and aesthetics. Brewers are turning to beer stabilizers to address this issue, with a particular emphasis on PVPP/R-PVPP, silica gel, and other stabilizing agents, to enhance the clarity and stability of lager beers. Additionally, the growing popularity of craft lagers and specialty lager styles further drives the adoption of beer stabilizers in this segment. As consumer preferences continue to evolve towards premium and visually appealing beer options, the demand for stabilizers in the lager segment is expected to surge, making it the fastest-growing segment in the beer stabilizers market.
Beer Stabilizers Market Segmentation
By Product
PVPP/R-PVPP
Silica gel
Papain
Xanthan Gum
Others
By Application
Lager
Ale
Stout & Porter
Malt
Others
Countries Analyzed
North America (US, Canada, Mexico)
Europe (Germany, UK, France, Spain, Italy, Russia, Rest of Europe)
Asia Pacific (China, India, Japan, South Korea, Australia, South East Asia, Rest of Asia)
South America (Brazil, Argentina, Rest of South America)
Middle East and Africa (Saudi Arabia, UAE, Rest of Middle East, South Africa, Egypt, Rest of Africa)
Beer Stabilizers Companies Profiled in the Study
AB Vickers
AEB Group
Ashland Global Holdings Inc
BASF SE
Eaton
ERBSLOH
Gusmer Beer
Lehmann & Voss & Co
QINGDAO MAKALL Group
SINCHEM
*- List Not Exhaustive
Chapter 1. TABLE OF CONTENTS
Chapter 2. Introduction to Beer Stabilizers Market
2.1. Market Overview
2.2. Key Statistics and Report Highlights
2.3. Scope of the Comprehensive Study
2.3.1. Market Definition
2.3.2 Countries and Regions Covered
2.3.3 Research Objective
2.3.4 Units, Currency, and Conversions
2.3.5 Industry Value Chain
2.4. Key Market Segments
2.5. Key Companies
2.6. Study Period
Chapter 3. Strategic Analysis Review
3.1. Beer Stabilizers Pricing Analysis and Forecast
3.2. Porter’s Five Forces
3.3. Market Ecosystem
3.4. SWOT Analysis
3.5. Regulatory Scenario
3.3. Effects of Inflation, Russia-Ukraine War, moderating economic growth, and other macroeconomic factors
Chapter 4. Competitive Landscape
4.1. Market Share Analysis
4.1.1. Global Beer Stabilizers Market Share by Company, 2023
4.1.2. Product Offerings of Leading Beer Stabilizers Companies
4.2. Market Entropy
4.2.1. New Product Launches in the Industry
4.2.2. Mergers, Acquisitions, Joint ventures, and Partnerships
4.3. Key Strategies and Best Practices
Chapter 5. Global Market Projections: Best, Reference, and Low Case Scenarios
5.1. Growth Analysis- Case Scenario Definitions
5.2. Low Growth Case Scenario Forecasts
5.3. Reference Growth Case Scenario Forecasts
5.4. High Growth Case Scenario Forecasts
Chapter 6. Market Dynamics
6.1. Beer Stabilizers Market Drivers
6.2. Beer Stabilizers Market Challenges
6.6. Beer Stabilizers Market Opportunities
6.4. Beer Stabilizers Market Trends
Chapter 7. Global Beer Stabilizers Market Outlook Trends
7.1. Global Beer Stabilizers Revenue (USD Million) and CAGR (%) by Type (2021-2032)
7.2. Global Beer Stabilizers Revenue (USD Million) and CAGR (%) by Application (2021-2032)
7.3. Global Beer Stabilizers Revenue (USD Million) and CAGR (%) by Product (2021-2032)
By Product
PVPP/R-PVPP
Silica gel
Papain
Xanthan Gum
Others
By Application
Lager
Ale
Stout & Porter
Malt
Others
Chapter 8. Global Beer Stabilizers Regional Analysis and Outlook
8.1. Global Beer Stabilizers Revenue (USD Million) By Regions (2021- 2032)
8.2. North America Beer Stabilizers Revenue (USD Million) by Country (2021-2032)
8.2.1. United States Beer Stabilizers Regional Analysis and Outlook
8.2.2. Canada Beer Stabilizers Regional Analysis and Outlook
8.2.3. Mexico Beer Stabilizers Regional Analysis and Outlook
8.3. Europe Beer Stabilizers Revenue (USD Million), by Country (2021-2032)
8.3.1. Germany Beer Stabilizers Regional Analysis and Outlook
8.3.2. France Beer Stabilizers Regional Analysis and Outlook
8.3.3. United Kingdom Beer Stabilizers Regional Analysis and Outlook
8.3.4. Spain Beer Stabilizers Regional Analysis and Outlook
8.3.5. Italy Beer Stabilizers Regional Analysis and Outlook
8.3.6. Russia Beer Stabilizers Regional Analysis and Outlook
8.3.7. Rest of Europe Beer Stabilizers Regional Analysis and Outlook
8.4. Asia Pacific Beer Stabilizers Revenue (USD Million) by Country (2021-2032)
8.4.1. China Beer Stabilizers Regional Analysis and Outlook
8.4.2. Japan Beer Stabilizers Regional Analysis and Outlook
8.4.3. India Beer Stabilizers Regional Analysis and Outlook
8.4.4. South Korea Beer Stabilizers Regional Analysis and Outlook
8.4.5. Australia Beer Stabilizers Regional Analysis and Outlook
8.4.6. South East Asia Beer Stabilizers Regional Analysis and Outlook
8.4.7. Rest of Asia Pacific Beer Stabilizers Regional Analysis and Outlook
8.5. South America Beer Stabilizers Revenue (USD Million), by Country (2021-2032)
8.5.1. Brazil Beer Stabilizers Regional Analysis and Outlook
8.5.2. Argentina Beer Stabilizers Regional Analysis and Outlook
8.5.3. Rest of South America Beer Stabilizers Regional Analysis and Outlook
8.6. Middle East and Africa Beer Stabilizers Revenue (USD Million) by Country (2021-2032)
8.6.1. Middle East Beer Stabilizers Regional Analysis and Outlook
8.6.2. Africa Beer Stabilizers Regional Analysis and Outlook
Chapter 9. North America Beer Stabilizers Analysis and Outlook
9.1. North America Beer Stabilizers Revenue (USD Million) by Segments (2021-2032)
9.1.1. North America Beer Stabilizers Revenue (USD Million) by Type (2021-2032)
9.1.2. North America Beer Stabilizers Revenue (USD Million) by Application (2021-2032)
9.1.3. North America Beer Stabilizers Revenue (USD Million) by Product (2021-2032)
By Product
PVPP/R-PVPP
Silica gel
Papain
Xanthan Gum
Others
By Application
Lager
Ale
Stout & Porter
Malt
Others
Chapter 10. Europe Beer Stabilizers Analysis and Outlook
10.1. Europe Beer Stabilizers Revenue (USD Million), by Segments (USD Million) (2021-2032)
10.1.1. Europe Beer Stabilizers Revenue (USD Million) by Type (2021-2032)
10.1.2. Europe Beer Stabilizers Revenue (USD Million) by Application (2021-2032)
10.1.3. Europe Beer Stabilizers Revenue (USD Million) by Product (2021-2032)
By Product
PVPP/R-PVPP
Silica gel
Papain
Xanthan Gum
Others
By Application
Lager
Ale
Stout & Porter
Malt
Others
Chapter 11. Asia Pacific Beer Stabilizers Analysis and Outlook
11.1. Asia Pacific Beer Stabilizers Revenue (USD Million), and Revenue (USD Million) by Segments (2021-2032)
11.1.1. Asia Pacific Beer Stabilizers Revenue (USD Million) by Type (2021-2032)
11.1.2. Asia Pacific Beer Stabilizers Revenue (USD Million) by Application (2021-2032)
11.1.3. Asia Pacific Beer Stabilizers Revenue (USD Million) by Product (2021-2032)
By Product
PVPP/R-PVPP
Silica gel
Papain
Xanthan Gum
Others
By Application
Lager
Ale
Stout & Porter
Malt
Others
Chapter 12. South America Beer Stabilizers Analysis and Outlook
12.1. South America Beer Stabilizers Revenue (USD Million), by Segments (2021-2032)
12.1.1. South America Beer Stabilizers Revenue (USD Million) by Type (2021-2032)
12.1.2. South America Beer Stabilizers Revenue (USD Million) by Application (2021-2032)
12.1.3. South America Beer Stabilizers Revenue (USD Million) by Product (2021-2032)
By Product
PVPP/R-PVPP
Silica gel
Papain
Xanthan Gum
Others
By Application
Lager
Ale
Stout & Porter
Malt
Others
Chapter 13. Middle East and Africa Beer Stabilizers Analysis and Outlook
13.1. Middle East and Africa Beer Stabilizers Revenue (USD Million), by Segments (2021-2032)
13.1.1. Middle East and Africa Beer Stabilizers Revenue (USD Million) by Type (2021-2032)
13.1.2. Middle East and Africa Beer Stabilizers Revenue (USD Million) by Application (2021-2032)
13.1.3. Middle East and Africa Beer Stabilizers Revenue (USD Million) by Product (2021-2032)
By Product
PVPP/R-PVPP
Silica gel
Papain
Xanthan Gum
Others
By Application
Lager
Ale
Stout & Porter
Malt
Others
Chapter 14. Beer Stabilizers Company Profiles
14.1 Business Overview
14.2 Product Profiles
14.3 SWOT Profiles
14.5 Recent Developments
14.6 Financial Profile
List of Companies
AB Vickers
AEB Group
Ashland Global Holdings Inc
BASF SE
Eaton
ERBSLOH
Gusmer Beer
Lehmann & Voss & Co
QINGDAO MAKALL Group
SINCHEM
15. Methodology and Data Sources
15.1 Customization Offerings
15.2 Subscription Services
15.3 Related Reports
15.4 Publisher Expertise
LIST OF TABLES
Table 1 Market Segmentation Analysis
Table 2 Global Beer Stabilizers Market Share of Leading Companies, 2023
Table 3 Product Offerings of Leading Companies
Table 4 Low Growth Scenario Forecasts
Table 5 Reference Case Growth Scenario
Table 6 High Growth Case Scenario
Table 7 Global Beer Stabilizers Revenue (USD Million) And CAGR (%) By Type (2021-2032)
Table 8 Global Beer Stabilizers Revenue (USD Million) And CAGR (%) By Application (2021-2032)
Table 9 Global Beer Stabilizers Revenue (USD Million) And CAGR (%) By Product (2021-2032)
Table 10 Global Beer Stabilizers Market Revenue (USD Million) By Regions (2021-2032)
Table 11 Global Beer Stabilizers Market Share (%) By Regions (2021-2032)
Table 12 North America Beer Stabilizers Revenue (USD Million) By Country (2021-2032)
Table 13 Europe Beer Stabilizers Revenue (USD Million) By Country (2021-2032)
Table 14 Asia Pacific Beer Stabilizers Revenue (USD Million) By Country (2021-2032)
Table 15 South America Beer Stabilizers Revenue (USD Million) By Country (2021-2032)
Table 16 Middle East and Africa Beer Stabilizers Revenue (USD Million) By Region (2021-2032)
Table 17 North America Beer Stabilizers Revenue (USD Million) By Type (2021-2032)
Table 18 North America Beer Stabilizers Revenue (USD Million) By Application (2021-2032)
Table 19 North America Beer Stabilizers Revenue (USD Million) By Product (2021-2032)
Table 20 Europe Beer Stabilizers Revenue (USD Million) By Type (2021-2032)
Table 21 Europe Beer Stabilizers Revenue (USD Million) By Application (2021-2032)
Table 22 Europe Beer Stabilizers Revenue (USD Million) By Product (2021-2032)
Table 23 Asia Pacific Beer Stabilizers Revenue (USD Million) By Type (2021-2032)
Table 24 Asia Pacific Beer Stabilizers Revenue (USD Million) By Application (2021-2032)
Table 25 Asia Pacific Beer Stabilizers Revenue (USD Million) By Product (2021-2032)
Table 26 South America Beer Stabilizers Revenue (USD Million) By Type (2021-2032)
Table 27 South America Beer Stabilizers Revenue (USD Million) By Application (2021-2032)
Table 28 South America Beer Stabilizers Revenue (USD Million) By Product (2021-2032)
Table 29 Middle East and Africa Beer Stabilizers Revenue (USD Million) By Type (2021-2032)
Table 30 Middle East and Africa Beer Stabilizers Revenue (USD Million) By Application (2021-2032)
Table 31 Middle East and Africa Beer Stabilizers Revenue (USD Million) By Product (2021-2032)
LIST OF FIGURES
Figure 1. Market Scope
Figure 2. Pricing Forecasts Per Unit, 2023- 2032
Figure 3. Porter’s Five Forces
Figure 4. Global Beer Stabilizers Market Revenue (USD Million) By Regions (2021-2032)
Figure 5. Global Beer Stabilizers Market Share (%) By Regions (2023)
Figure 6. North America Beer Stabilizers Revenue (USD Million) By Country (2021-2032)
Figure 7. United States Beer Stabilizers Revenue (USD Million) By Country (2021-2032)
Figure 8. Canada Beer Stabilizers Revenue (USD Million) By Country (2021-2032)
Figure 9. Mexico Beer Stabilizers Revenue (USD Million) By Country (2021-2032)
Figure 10. Europe Beer Stabilizers Revenue (USD Million) By Country (2021-2032)
Figure 11. Germany Beer Stabilizers Revenue (USD Million) By Country (2021-2032)
Figure 12. France Beer Stabilizers Revenue (USD Million) By Country (2021-2032)
Figure 13. United Kingdom Beer Stabilizers Revenue (USD Million) By Country (2021-2032)
Figure 14. Spain Beer Stabilizers Revenue (USD Million) By Country (2021-2032)
Figure 15. Italy Beer Stabilizers Revenue (USD Million) By Country (2021-2032)
Figure 16. Russia Beer Stabilizers Revenue (USD Million) By Country (2021-2032)
Figure 17. Rest of Europe Beer Stabilizers Revenue (USD Million) By Country (2021-2032)
Figure 11. Asia Pacific Beer Stabilizers Revenue (USD Million) By Country (2021-2032)
Figure 12. China Beer Stabilizers Revenue (USD Million) By Country (2021-2032)
Figure 13. Japan Beer Stabilizers Revenue (USD Million) By Country (2021-2032)
Figure 14. India Beer Stabilizers Revenue (USD Million) By Country (2021-2032)
Figure 15. South Korea Beer Stabilizers Revenue (USD Million) By Country (2021-2032)
Figure 16. Australia Beer Stabilizers Revenue (USD Million) By Country (2021-2032)
Figure 17. South East Asia Beer Stabilizers Revenue (USD Million) By Country (2021-2032)
Figure 18. South America Beer Stabilizers Revenue (USD Million) By Country (2021-2032)
Figure 19. Brazil Beer Stabilizers Revenue (USD Million) By Country (2021-2032)
Figure 20. Argentina Beer Stabilizers Revenue (USD Million) By Country (2021-2032)
Figure 21. Rest of Asia Pacific Beer Stabilizers Revenue (USD Million) By Country (2021-2032)
Figure 22. Middle East and Africa Beer Stabilizers Revenue (USD Million) By Region (2021-2032)
Figure 23. Saudi Arabia Beer Stabilizers Revenue (USD Million) By Region (2021-2032)
Figure 24. The UAE Beer Stabilizers Revenue (USD Million) By Region (2021-2032)
Figure 25. Rest of Middle East Beer Stabilizers Revenue (USD Million) By Region (2021-2032)
Figure 26. South Africa Beer Stabilizers Revenue (USD Million) By Region (2021-2032)
Figure 27. Africa Beer Stabilizers Revenue (USD Million) By Region (2021-2032)
Figure 28. North America Beer Stabilizers Revenue (USD Million) By Type (2021-2032)
Figure 29. North America Beer Stabilizers Revenue (USD Million) By Application (2021-2032)
Figure 30. North America Beer Stabilizers Revenue (USD Million) By Product (2021-2032)
Figure 31. Europe Beer Stabilizers Revenue (USD Million) By Type (2021-2032)
Figure 32. Europe Beer Stabilizers Revenue (USD Million) By Application (2021-2032)
Figure 33. Europe Beer Stabilizers Revenue (USD Million) By Product (2021-2032)
Figure 34. Asia Pacific Beer Stabilizers Revenue (USD Million) By Type (2021-2032)
Figure 35. Asia Pacific Beer Stabilizers Revenue (USD Million) By Application (2021-2032)
Figure 36. Asia Pacific Beer Stabilizers Revenue (USD Million) By Product (2021-2032)
Figure 37. South America Beer Stabilizers Revenue (USD Million) By Type (2021-2032)
Figure 38. South America Beer Stabilizers Revenue (USD Million) By Application (2021-2032)
Figure 39. South America Beer Stabilizers Revenue (USD Million) By Product (2021-2032)
Figure 40. Middle East and Africa Beer Stabilizers Revenue (USD Million) By Type (2021-2032)
Figure 41. Middle East and Africa Beer Stabilizers Revenue (USD Million) By Application (2021-2032)
Figure 42. Middle East and Africa Beer Stabilizers Revenue (USD Million) By Product (2021-2032)
By Product
PVPP/R-PVPP
Silica gel
Papain
Xanthan Gum
Others
By Application
Lager
Ale
Stout & Porter
Malt
Others
Countries Analyzed
North America (US, Canada, Mexico)
Europe (Germany, UK, France, Spain, Italy, Russia, Rest of Europe)
Asia Pacific (China, India, Japan, South Korea, Australia, South East Asia, Rest of Asia)
South America (Brazil, Argentina, Rest of South America)
Middle East and Africa (Saudi Arabia, UAE, Rest of Middle East, South Africa, Egypt, Rest of Africa)
