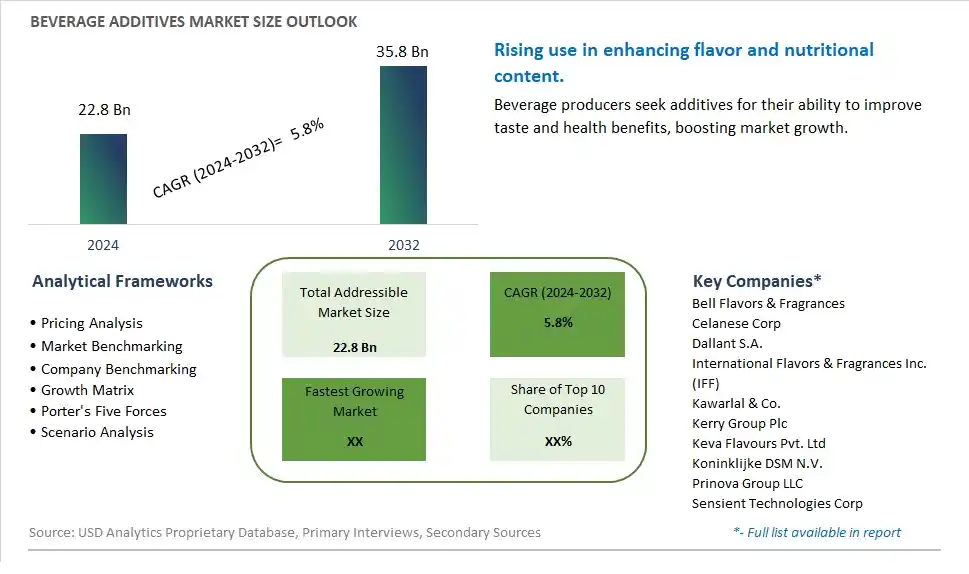
Global Beverage Additives Market Size is valued at $22.8 Billion in 2024 and is forecast to register a growth rate (CAGR) of 5.8% to reach $35.8 Billion by 2032.
The global Beverage Additives Market Comprehensive Study analyzes and forecasts the market size across 6 regions and 24 countries for diverse segments -By Type (Preservatives, -Sodium Benzoate, -Sulphur Dioxide, -Citric Acid, -Others, Colorants, -Nitrates, -Nitrites, -Others, Flavoring Agents, -Sweeteners, -Flavor Enhancers, -Glycine Salts, -Monosodium Glutamate, -Others, Others), By Application (Alcoholic Beverages, -Wine, -Beer, -Whiskey, -Others, Non-Alcoholic Beverages, -Juices, -Soft Drinks, -Sports and Energy Drinks, -Dairy Beverages, -Others)
An Introduction to Beverage Additives Market
In 2024, the Beverage Additives market is witnessing significant growth, driven by the increasing demand for enhanced flavors, functional ingredients, and improved shelf life in beverages. Beverage additives, including flavorings, sweeteners, preservatives, and colorants, are essential for creating diverse and appealing beverage products. The market is supported by innovations in additive technology that improve the taste, nutritional profile, and safety of beverages. The trend towards clean-label and natural additives is also driving market growth, as consumers seek healthier and more transparent product formulations. Additionally, the rise of functional and fortified beverages is boosting demand for specialized additives that offer health benefits.
Beverage Additives Competitive Landscape
The market report analyses the leading companies in the industry including Bell Flavors & Fragrances, Celanese Corp, Dallant S.A., International Flavors & Fragrances Inc. (IFF), Kawarlal & Co., Kerry Group Plc, Keva Flavours Pvt. Ltd, Koninklijke DSM N.V., Prinova Group LLC, Sensient Technologies Corp, and Others.
Beverage Additives Market Dynamics
Beverage Additives Market Trend: Demand for Functional and Innovative Beverages
The most prominent market trend for Beverage Additives is the increasing demand for functional and innovative beverages. Consumers are seeking beverages that offer more than just hydration, looking for added health benefits, unique flavors, and innovative formulations. Beverage additives play a crucial role in achieving these objectives by enhancing taste, texture, appearance, and nutritional value. This trend reflects a broader shift towards wellness-focused lifestyles and experiential consumption, driving the demand for a wide range of beverage additives across the beverage industry.
Beverage Additives Market Driver: Consumer Preference for Customization and Personalization
A key market driver for Beverage Additives is the consumer preference for customization and personalization. Consumers today have diverse preferences and dietary requirements, seeking beverages tailored to their specific tastes, health goals, and lifestyle choices. Beverage additives allow manufacturers and consumers alike to customize beverages by adding flavors, colors, vitamins, minerals, functional ingredients, and other additives to meet individual preferences. The driver of customization and personalization propels the adoption of beverage additives as a means to create unique and tailored beverage experiences for consumers.
Beverage Additives Market Opportunity: Development of Functional and Health-Enhancing Additives
A potential opportunity within the Beverage Additives market lies in the development of functional and health-enhancing additives. Collaborating with nutritionists, scientists, and health experts can lead to the creation of additives that offer tangible health benefits, such as immunity support, energy enhancement, stress relief, and digestive wellness. Additionally, exploring opportunities in natural and plant-based additives, sugar reduction solutions, and clean label alternatives can cater to the growing demand for healthier beverage options. By focusing on the development of functional and health-enhancing additives, there are opportunities to tap into the wellness trend, differentiate products, and meet the evolving needs of health-conscious consumers in the beverage industry.
Beverage Additives Market Share Analysis: Flavoring Agents segment generated the highest revenue share in the industry
Flavoring agents constitute the largest segment in the Beverage Additives Market. Among flavoring agents, sweeteners stand out as a fast-growing sub-segment. Sweeteners are additives that impart a sweet taste to beverages without the calories associated with sugar, making them popular among health-conscious consumers and those managing conditions like diabetes. One of the key drivers for the growth of sweeteners in beverages is the increasing demand for low-calorie and sugar-free options in the market. Consumers are seeking healthier alternatives without compromising on taste, driving manufacturers to innovate and incorporate various sweeteners like stevia, sucralose, and erythritol into their beverage formulations. Additionally, the rise in awareness about the adverse effects of excessive sugar consumption has further propelled the demand for sweeteners in beverages, contributing significantly to the growth of this segment within the Beverage Additives Market.
Beverage Additives Market Share Analysis: Non-Alcoholic Beverages is the fastest growing segment over the forecast period to 2032
Among the segments listed in the Beverage Additives Market, the Non-Alcoholic Beverages segment is poised for the fastest growth up to 2032. Within this segment, one notable sub-category experiencing rapid growth is Sports and Energy Drinks. The popularity of sports and energy drinks is increasing due to several factors. Firstly, there is a rising health consciousness among consumers, especially among younger demographics, who are seeking beverages that offer hydration, energy boost, and functional benefits. Sports and energy drinks often contain electrolytes, vitamins, and minerals, making them attractive to consumers looking for an active lifestyle and enhanced performance. Additionally, the growing awareness about the importance of hydration during physical activities and the desire for convenient, on-the-go refreshment options are driving the demand for sports and energy drinks. With ongoing innovations in formulations, flavors, and packaging, the Sports and Energy Drinks sub-segment is expected to continue its rapid growth trajectory in the Beverage Additives Market through 2032.
Beverage Additives Market Segmentation
By Type
Preservatives
-Sodium Benzoate
-Sulphur Dioxide
-Citric Acid
-Others
Colorants
-Nitrates
-Nitrites
-Others
Flavoring Agents
-Sweeteners
-Flavor Enhancers
-Glycine Salts
-Monosodium Glutamate
-Others
Others
By Application
Alcoholic Beverages
-Wine
-Beer
-Whiskey
-Others
Non-Alcoholic Beverages
-Juices
-Soft Drinks
-Sports and Energy Drinks
-Dairy Beverages
-Others
Countries Analyzed
North America (US, Canada, Mexico)
Europe (Germany, UK, France, Spain, Italy, Russia, Rest of Europe)
Asia Pacific (China, India, Japan, South Korea, Australia, South East Asia, Rest of Asia)
South America (Brazil, Argentina, Rest of South America)
Middle East and Africa (Saudi Arabia, UAE, Rest of Middle East, South Africa, Egypt, Rest of Africa)
Beverage Additives Companies Profiled in the Study
Bell Flavors & Fragrances
Celanese Corp
Dallant S.A.
International Flavors & Fragrances Inc. (IFF)
Kawarlal & Co.
Kerry Group Plc
Keva Flavours Pvt. Ltd
Koninklijke DSM N.V.
Prinova Group LLC
Sensient Technologies Corp
*- List Not Exhaustive
Chapter 1. TABLE OF CONTENTS
Chapter 2. Introduction to Beverage Additives Market
2.1. Market Overview
2.2. Key Statistics and Report Highlights
2.3. Scope of the Comprehensive Study
2.3.1. Market Definition
2.3.2 Countries and Regions Covered
2.3.3 Research Objective
2.3.4 Units, Currency, and Conversions
2.3.5 Industry Value Chain
2.4. Key Market Segments
2.5. Key Companies
2.6. Study Period
Chapter 3. Strategic Analysis Review
3.1. Beverage Additives Pricing Analysis and Forecast
3.2. Porter’s Five Forces
3.3. Market Ecosystem
3.4. SWOT Analysis
3.5. Regulatory Scenario
3.3. Effects of Inflation, Russia-Ukraine War, moderating economic growth, and other macroeconomic factors
Chapter 4. Competitive Landscape
4.1. Market Share Analysis
4.1.1. Global Beverage Additives Market Share by Company, 2023
4.1.2. Product Offerings of Leading Beverage Additives Companies
4.2. Market Entropy
4.2.1. New Product Launches in the Industry
4.2.2. Mergers, Acquisitions, Joint ventures, and Partnerships
4.3. Key Strategies and Best Practices
Chapter 5. Global Market Projections: Best, Reference, and Low Case Scenarios
5.1. Growth Analysis- Case Scenario Definitions
5.2. Low Growth Case Scenario Forecasts
5.3. Reference Growth Case Scenario Forecasts
5.4. High Growth Case Scenario Forecasts
Chapter 6. Market Dynamics
6.1. Beverage Additives Market Drivers
6.2. Beverage Additives Market Challenges
6.6. Beverage Additives Market Opportunities
6.4. Beverage Additives Market Trends
Chapter 7. Global Beverage Additives Market Outlook Trends
7.1. Global Beverage Additives Revenue (USD Million) and CAGR (%) by Type (2021-2032)
7.2. Global Beverage Additives Revenue (USD Million) and CAGR (%) by Application (2021-2032)
7.3. Global Beverage Additives Revenue (USD Million) and CAGR (%) by Product (2021-2032)
By Type
Preservatives
-Sodium Benzoate
-Sulphur Dioxide
-Citric Acid
-Others
Colorants
-Nitrates
-Nitrites
-Others
Flavoring Agents
-Sweeteners
-Flavor Enhancers
-Glycine Salts
-Monosodium Glutamate
-Others
Others
By Application
Alcoholic Beverages
-Wine
-Beer
-Whiskey
-Others
Non-Alcoholic Beverages
-Juices
-Soft Drinks
-Sports and Energy Drinks
-Dairy Beverages
-Others
Chapter 8. Global Beverage Additives Regional Analysis and Outlook
8.1. Global Beverage Additives Revenue (USD Million) By Regions (2021- 2032)
8.2. North America Beverage Additives Revenue (USD Million) by Country (2021-2032)
8.2.1. United States Beverage Additives Regional Analysis and Outlook
8.2.2. Canada Beverage Additives Regional Analysis and Outlook
8.2.3. Mexico Beverage Additives Regional Analysis and Outlook
8.3. Europe Beverage Additives Revenue (USD Million), by Country (2021-2032)
8.3.1. Germany Beverage Additives Regional Analysis and Outlook
8.3.2. France Beverage Additives Regional Analysis and Outlook
8.3.3. United Kingdom Beverage Additives Regional Analysis and Outlook
8.3.4. Spain Beverage Additives Regional Analysis and Outlook
8.3.5. Italy Beverage Additives Regional Analysis and Outlook
8.3.6. Russia Beverage Additives Regional Analysis and Outlook
8.3.7. Rest of Europe Beverage Additives Regional Analysis and Outlook
8.4. Asia Pacific Beverage Additives Revenue (USD Million) by Country (2021-2032)
8.4.1. China Beverage Additives Regional Analysis and Outlook
8.4.2. Japan Beverage Additives Regional Analysis and Outlook
8.4.3. India Beverage Additives Regional Analysis and Outlook
8.4.4. South Korea Beverage Additives Regional Analysis and Outlook
8.4.5. Australia Beverage Additives Regional Analysis and Outlook
8.4.6. South East Asia Beverage Additives Regional Analysis and Outlook
8.4.7. Rest of Asia Pacific Beverage Additives Regional Analysis and Outlook
8.5. South America Beverage Additives Revenue (USD Million), by Country (2021-2032)
8.5.1. Brazil Beverage Additives Regional Analysis and Outlook
8.5.2. Argentina Beverage Additives Regional Analysis and Outlook
8.5.3. Rest of South America Beverage Additives Regional Analysis and Outlook
8.6. Middle East and Africa Beverage Additives Revenue (USD Million) by Country (2021-2032)
8.6.1. Middle East Beverage Additives Regional Analysis and Outlook
8.6.2. Africa Beverage Additives Regional Analysis and Outlook
Chapter 9. North America Beverage Additives Analysis and Outlook
9.1. North America Beverage Additives Revenue (USD Million) by Segments (2021-2032)
9.1.1. North America Beverage Additives Revenue (USD Million) by Type (2021-2032)
9.1.2. North America Beverage Additives Revenue (USD Million) by Application (2021-2032)
9.1.3. North America Beverage Additives Revenue (USD Million) by Product (2021-2032)
By Type
Preservatives
-Sodium Benzoate
-Sulphur Dioxide
-Citric Acid
-Others
Colorants
-Nitrates
-Nitrites
-Others
Flavoring Agents
-Sweeteners
-Flavor Enhancers
-Glycine Salts
-Monosodium Glutamate
-Others
Others
By Application
Alcoholic Beverages
-Wine
-Beer
-Whiskey
-Others
Non-Alcoholic Beverages
-Juices
-Soft Drinks
-Sports and Energy Drinks
-Dairy Beverages
-Others
Chapter 10. Europe Beverage Additives Analysis and Outlook
10.1. Europe Beverage Additives Revenue (USD Million), by Segments (USD Million) (2021-2032)
10.1.1. Europe Beverage Additives Revenue (USD Million) by Type (2021-2032)
10.1.2. Europe Beverage Additives Revenue (USD Million) by Application (2021-2032)
10.1.3. Europe Beverage Additives Revenue (USD Million) by Product (2021-2032)
By Type
Preservatives
-Sodium Benzoate
-Sulphur Dioxide
-Citric Acid
-Others
Colorants
-Nitrates
-Nitrites
-Others
Flavoring Agents
-Sweeteners
-Flavor Enhancers
-Glycine Salts
-Monosodium Glutamate
-Others
Others
By Application
Alcoholic Beverages
-Wine
-Beer
-Whiskey
-Others
Non-Alcoholic Beverages
-Juices
-Soft Drinks
-Sports and Energy Drinks
-Dairy Beverages
-Others
Chapter 11. Asia Pacific Beverage Additives Analysis and Outlook
11.1. Asia Pacific Beverage Additives Revenue (USD Million), and Revenue (USD Million) by Segments (2021-2032)
11.1.1. Asia Pacific Beverage Additives Revenue (USD Million) by Type (2021-2032)
11.1.2. Asia Pacific Beverage Additives Revenue (USD Million) by Application (2021-2032)
11.1.3. Asia Pacific Beverage Additives Revenue (USD Million) by Product (2021-2032)
By Type
Preservatives
-Sodium Benzoate
-Sulphur Dioxide
-Citric Acid
-Others
Colorants
-Nitrates
-Nitrites
-Others
Flavoring Agents
-Sweeteners
-Flavor Enhancers
-Glycine Salts
-Monosodium Glutamate
-Others
Others
By Application
Alcoholic Beverages
-Wine
-Beer
-Whiskey
-Others
Non-Alcoholic Beverages
-Juices
-Soft Drinks
-Sports and Energy Drinks
-Dairy Beverages
-Others
Chapter 12. South America Beverage Additives Analysis and Outlook
12.1. South America Beverage Additives Revenue (USD Million), by Segments (2021-2032)
12.1.1. South America Beverage Additives Revenue (USD Million) by Type (2021-2032)
12.1.2. South America Beverage Additives Revenue (USD Million) by Application (2021-2032)
12.1.3. South America Beverage Additives Revenue (USD Million) by Product (2021-2032)
By Type
Preservatives
-Sodium Benzoate
-Sulphur Dioxide
-Citric Acid
-Others
Colorants
-Nitrates
-Nitrites
-Others
Flavoring Agents
-Sweeteners
-Flavor Enhancers
-Glycine Salts
-Monosodium Glutamate
-Others
Others
By Application
Alcoholic Beverages
-Wine
-Beer
-Whiskey
-Others
Non-Alcoholic Beverages
-Juices
-Soft Drinks
-Sports and Energy Drinks
-Dairy Beverages
-Others
Chapter 13. Middle East and Africa Beverage Additives Analysis and Outlook
13.1. Middle East and Africa Beverage Additives Revenue (USD Million), by Segments (2021-2032)
13.1.1. Middle East and Africa Beverage Additives Revenue (USD Million) by Type (2021-2032)
13.1.2. Middle East and Africa Beverage Additives Revenue (USD Million) by Application (2021-2032)
13.1.3. Middle East and Africa Beverage Additives Revenue (USD Million) by Product (2021-2032)
By Type
Preservatives
-Sodium Benzoate
-Sulphur Dioxide
-Citric Acid
-Others
Colorants
-Nitrates
-Nitrites
-Others
Flavoring Agents
-Sweeteners
-Flavor Enhancers
-Glycine Salts
-Monosodium Glutamate
-Others
Others
By Application
Alcoholic Beverages
-Wine
-Beer
-Whiskey
-Others
Non-Alcoholic Beverages
-Juices
-Soft Drinks
-Sports and Energy Drinks
-Dairy Beverages
-Others
Chapter 14. Beverage Additives Company Profiles
14.1 Business Overview
14.2 Product Profiles
14.3 SWOT Profiles
14.5 Recent Developments
14.6 Financial Profile
List of Companies
Bell Flavors & Fragrances
Celanese Corp
Dallant S.A.
International Flavors & Fragrances Inc. (IFF)
Kawarlal & Co.
Kerry Group Plc
Keva Flavours Pvt. Ltd
Koninklijke DSM N.V.
Prinova Group LLC
Sensient Technologies Corp
15. Methodology and Data Sources
15.1 Customization Offerings
15.2 Subscription Services
15.3 Related Reports
15.4 Publisher Expertise
LIST OF TABLES
Table 1 Market Segmentation Analysis
Table 2 Global Beverage Additives Market Share of Leading Companies, 2023
Table 3 Product Offerings of Leading Companies
Table 4 Low Growth Scenario Forecasts
Table 5 Reference Case Growth Scenario
Table 6 High Growth Case Scenario
Table 7 Global Beverage Additives Revenue (USD Million) And CAGR (%) By Type (2021-2032)
Table 8 Global Beverage Additives Revenue (USD Million) And CAGR (%) By Application (2021-2032)
Table 9 Global Beverage Additives Revenue (USD Million) And CAGR (%) By Product (2021-2032)
Table 10 Global Beverage Additives Market Revenue (USD Million) By Regions (2021-2032)
Table 11 Global Beverage Additives Market Share (%) By Regions (2021-2032)
Table 12 North America Beverage Additives Revenue (USD Million) By Country (2021-2032)
Table 13 Europe Beverage Additives Revenue (USD Million) By Country (2021-2032)
Table 14 Asia Pacific Beverage Additives Revenue (USD Million) By Country (2021-2032)
Table 15 South America Beverage Additives Revenue (USD Million) By Country (2021-2032)
Table 16 Middle East and Africa Beverage Additives Revenue (USD Million) By Region (2021-2032)
Table 17 North America Beverage Additives Revenue (USD Million) By Type (2021-2032)
Table 18 North America Beverage Additives Revenue (USD Million) By Application (2021-2032)
Table 19 North America Beverage Additives Revenue (USD Million) By Product (2021-2032)
Table 20 Europe Beverage Additives Revenue (USD Million) By Type (2021-2032)
Table 21 Europe Beverage Additives Revenue (USD Million) By Application (2021-2032)
Table 22 Europe Beverage Additives Revenue (USD Million) By Product (2021-2032)
Table 23 Asia Pacific Beverage Additives Revenue (USD Million) By Type (2021-2032)
Table 24 Asia Pacific Beverage Additives Revenue (USD Million) By Application (2021-2032)
Table 25 Asia Pacific Beverage Additives Revenue (USD Million) By Product (2021-2032)
Table 26 South America Beverage Additives Revenue (USD Million) By Type (2021-2032)
Table 27 South America Beverage Additives Revenue (USD Million) By Application (2021-2032)
Table 28 South America Beverage Additives Revenue (USD Million) By Product (2021-2032)
Table 29 Middle East and Africa Beverage Additives Revenue (USD Million) By Type (2021-2032)
Table 30 Middle East and Africa Beverage Additives Revenue (USD Million) By Application (2021-2032)
Table 31 Middle East and Africa Beverage Additives Revenue (USD Million) By Product (2021-2032)
LIST OF FIGURES
Figure 1. Market Scope
Figure 2. Pricing Forecasts Per Unit, 2023- 2032
Figure 3. Porter’s Five Forces
Figure 4. Global Beverage Additives Market Revenue (USD Million) By Regions (2021-2032)
Figure 5. Global Beverage Additives Market Share (%) By Regions (2023)
Figure 6. North America Beverage Additives Revenue (USD Million) By Country (2021-2032)
Figure 7. United States Beverage Additives Revenue (USD Million) By Country (2021-2032)
Figure 8. Canada Beverage Additives Revenue (USD Million) By Country (2021-2032)
Figure 9. Mexico Beverage Additives Revenue (USD Million) By Country (2021-2032)
Figure 10. Europe Beverage Additives Revenue (USD Million) By Country (2021-2032)
Figure 11. Germany Beverage Additives Revenue (USD Million) By Country (2021-2032)
Figure 12. France Beverage Additives Revenue (USD Million) By Country (2021-2032)
Figure 13. United Kingdom Beverage Additives Revenue (USD Million) By Country (2021-2032)
Figure 14. Spain Beverage Additives Revenue (USD Million) By Country (2021-2032)
Figure 15. Italy Beverage Additives Revenue (USD Million) By Country (2021-2032)
Figure 16. Russia Beverage Additives Revenue (USD Million) By Country (2021-2032)
Figure 17. Rest of Europe Beverage Additives Revenue (USD Million) By Country (2021-2032)
Figure 11. Asia Pacific Beverage Additives Revenue (USD Million) By Country (2021-2032)
Figure 12. China Beverage Additives Revenue (USD Million) By Country (2021-2032)
Figure 13. Japan Beverage Additives Revenue (USD Million) By Country (2021-2032)
Figure 14. India Beverage Additives Revenue (USD Million) By Country (2021-2032)
Figure 15. South Korea Beverage Additives Revenue (USD Million) By Country (2021-2032)
Figure 16. Australia Beverage Additives Revenue (USD Million) By Country (2021-2032)
Figure 17. South East Asia Beverage Additives Revenue (USD Million) By Country (2021-2032)
Figure 18. South America Beverage Additives Revenue (USD Million) By Country (2021-2032)
Figure 19. Brazil Beverage Additives Revenue (USD Million) By Country (2021-2032)
Figure 20. Argentina Beverage Additives Revenue (USD Million) By Country (2021-2032)
Figure 21. Rest of Asia Pacific Beverage Additives Revenue (USD Million) By Country (2021-2032)
Figure 22. Middle East and Africa Beverage Additives Revenue (USD Million) By Region (2021-2032)
Figure 23. Saudi Arabia Beverage Additives Revenue (USD Million) By Region (2021-2032)
Figure 24. The UAE Beverage Additives Revenue (USD Million) By Region (2021-2032)
Figure 25. Rest of Middle East Beverage Additives Revenue (USD Million) By Region (2021-2032)
Figure 26. South Africa Beverage Additives Revenue (USD Million) By Region (2021-2032)
Figure 27. Africa Beverage Additives Revenue (USD Million) By Region (2021-2032)
Figure 28. North America Beverage Additives Revenue (USD Million) By Type (2021-2032)
Figure 29. North America Beverage Additives Revenue (USD Million) By Application (2021-2032)
Figure 30. North America Beverage Additives Revenue (USD Million) By Product (2021-2032)
Figure 31. Europe Beverage Additives Revenue (USD Million) By Type (2021-2032)
Figure 32. Europe Beverage Additives Revenue (USD Million) By Application (2021-2032)
Figure 33. Europe Beverage Additives Revenue (USD Million) By Product (2021-2032)
Figure 34. Asia Pacific Beverage Additives Revenue (USD Million) By Type (2021-2032)
Figure 35. Asia Pacific Beverage Additives Revenue (USD Million) By Application (2021-2032)
Figure 36. Asia Pacific Beverage Additives Revenue (USD Million) By Product (2021-2032)
Figure 37. South America Beverage Additives Revenue (USD Million) By Type (2021-2032)
Figure 38. South America Beverage Additives Revenue (USD Million) By Application (2021-2032)
Figure 39. South America Beverage Additives Revenue (USD Million) By Product (2021-2032)
Figure 40. Middle East and Africa Beverage Additives Revenue (USD Million) By Type (2021-2032)
Figure 41. Middle East and Africa Beverage Additives Revenue (USD Million) By Application (2021-2032)
Figure 42. Middle East and Africa Beverage Additives Revenue (USD Million) By Product (2021-2032)
By Type
Preservatives
-Sodium Benzoate
-Sulphur Dioxide
-Citric Acid
-Others
Colorants
-Nitrates
-Nitrites
-Others
Flavoring Agents
-Sweeteners
-Flavor Enhancers
-Glycine Salts
-Monosodium Glutamate
-Others
Others
By Application
Alcoholic Beverages
-Wine
-Beer
-Whiskey
-Others
Non-Alcoholic Beverages
-Juices
-Soft Drinks
-Sports and Energy Drinks
-Dairy Beverages
-Others
Countries Analyzed
North America (US, Canada, Mexico)
Europe (Germany, UK, France, Spain, Italy, Russia, Rest of Europe)
Asia Pacific (China, India, Japan, South Korea, Australia, South East Asia, Rest of Asia)
South America (Brazil, Argentina, Rest of South America)
Middle East and Africa (Saudi Arabia, UAE, Rest of Middle East, South Africa, Egypt, Rest of Africa)
