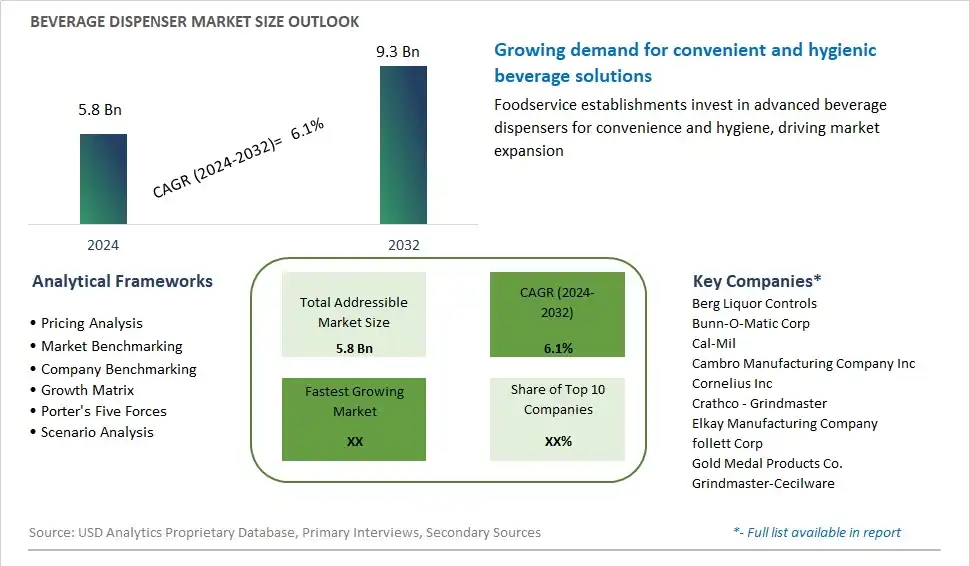
Global Beverage Dispenser Market Size is valued at $5.8 Billion in 2024 and is forecast to register a growth rate (CAGR) of 6.1% to reach $9.3 Billion by 2032.
The global Beverage Dispenser Market Comprehensive Study analyzes and forecasts the market size across 6 regions and 24 countries for diverse segments -By Material (Plastic, Stainless Steel, Others), By Type (Hot beverage dispenser, Cold beverage dispenser), By End-User (Commercial, Residential)
An Introduction to Beverage Dispenser Market
A beverage dispenser is a commercial or household appliance used to store, chill, and dispense beverages such as water, juice, tea, coffee, and carbonated drinks in 2024. These dispensers come in various designs, including countertop, freestanding, and refrigerated models, equipped with features such as multiple dispensing taps, adjustable temperature settings, and filtration systems to meet diverse beverage dispensing needs. Beverage dispensers are commonly used in restaurants, cafes, catering events, offices, and households to serve large volumes of beverages efficiently and hygienically. With the growing demand for convenience, customization, and sustainability in beverage service, the market for beverage dispensers is expanding, driven by innovations in design, technology, and materials that improve user experience, energy efficiency, and sanitation standards while reducing environmental impact and operational costs.
Beverage Dispenser Competitive Landscape
The market report analyses the leading companies in the industry including Berg Liquor Controls, Bunn-O-Matic Corp, Cal-Mil, Cambro Manufacturing Company Inc, Cornelius Inc, Crathco - Grindmaster, Elkay Manufacturing Company, follett Corp, Gold Medal Products Co., Grindmaster-Cecilware, and Others.
Beverage Dispenser Market Dynamics
Beverage Dispenser Market Trend: Rising Demand for Self-service and Customization in Beverage Service
The market for beverage dispensers is experiencing a prominent trend driven by the rising demand for self-service and customization in beverage service. Consumers are increasingly seeking interactive and personalized experiences when dining out or attending events, leading to the popularity of self-serve beverage dispensers. These dispensers allow customers to choose their preferred beverage options, mix flavors, and adjust serving sizes according to their taste preferences. This trend is fueled by the desire for convenience, flexibility, and control over beverage choices, as well as the influence of fast-casual dining concepts and experiential dining trends. As a result, there is a growing demand for beverage dispensers equipped with features such as touch-screen interfaces, flavor infusion capabilities, and adjustable portion controls to enhance the customer experience and meet evolving consumer expectations.
Market Driver: Cost-saving Measures and Operational Efficiency in Foodservice
A significant driver of the beverage dispenser market is the need for cost-saving measures and operational efficiency in the foodservice industry. Restaurants, cafeterias, and hospitality establishments are constantly seeking ways to streamline beverage service operations, reduce labor costs, and minimize waste while maintaining high standards of quality and service. Beverage dispensers offer advantages such as portion control, automated dispensing, and easy maintenance, making them essential tools for optimizing beverage service efficiency. Moreover, the scalability and flexibility of beverage dispensers allow operators to accommodate fluctuating demand and diverse beverage offerings with minimal labor and overhead costs. The drive for operational excellence and profitability in foodservice establishments is driving the adoption of beverage dispensers as integral components of beverage service strategies.
Market Opportunity: Integration of IoT and Smart Technology in Beverage Dispensing Systems
An opportunity for the beverage dispenser market lies in the integration of Internet of Things (IoT) and smart technology into beverage dispensing systems. With the advancement of technology and connectivity, there is potential to enhance beverage dispenser functionality and performance through IoT-enabled features such as remote monitoring, predictive maintenance, and data analytics. Smart beverage dispensers can provide operators with real-time insights into beverage consumption patterns, equipment status, and inventory levels, enabling proactive decision-making and operational optimization. Additionally, IoT connectivity allows for seamless integration with inventory management systems, POS systems, and mobile ordering platforms, enabling streamlined operations and improved customer experiences. By embracing smart technology and IoT solutions, beverage dispenser manufacturers can differentiate their products, add value for operators, and capitalize on the growing demand for technologically advanced beverage service solutions in the foodservice industry.
Beverage Dispenser Market Share Analysis: Plastic held the dominant market share in 2024
The plastic segment commands the largest share in the beverage dispenser market due to its affordability, lightweight nature, and versatility in design and functionality. Plastic beverage dispensers offer a cost-effective solution for both commercial and household use, making them accessible to a wide range of consumers. Additionally, plastic dispensers are easy to transport, clean, and maintain, making them ideal for outdoor events, picnics, and catering services. Further, advancements in plastic manufacturing technology have led to the development of durable and impact-resistant plastics that rival the performance of traditional materials like stainless steel. As a result, the plastic segment remains the preferred choice for beverage dispensers, catering to the diverse needs of consumers and businesses for convenient and practical beverage serving solutions.
Beverage Dispenser Market Share Analysis: Cold Beverage Dispenser market is poised to register the fastest growth rae over the forecast period to 2032
The cold beverage dispenser segment is experiencing the fastest growth in the beverage dispenser market due to the increasing demand for refreshing and on-the-go beverage options among consumers. Cold beverage dispensers offer a convenient solution for serving a variety of chilled drinks such as iced tea, lemonade, fruit-infused water, and chilled coffee beverages. With consumers increasingly opting for healthier and more hydrating drink choices, cold beverage dispensers cater to this trend by providing easy access to freshly made, flavorful beverages. Additionally, the versatility of cold beverage dispensers makes them suitable for a wide range of settings including restaurants, cafes, convenience stores, and catering events. Further, advancements in technology have led to the development of innovative features such as self-service dispensing, customizable flavor options, and eco-friendly design, further driving the growth of the cold beverage dispenser segment in the market.
Beverage Dispenser Market Share Analysis: Commercial held the dominant market share in 2024
The commercial segment commands the largest share in the beverage dispenser market due to the extensive usage of beverage dispensers in various commercial settings such as restaurants, cafes, hotels, bars, and catering services. Commercial establishments rely on beverage dispensers to efficiently serve a wide range of beverages to their customers, including juices, sodas, cocktails, and specialty drinks. Additionally, beverage dispensers enhance operational efficiency by facilitating self-service options, reducing wait times, and minimizing spillage. Further, the growing trend of customizing drink offerings, promoting healthier beverage options, and enhancing customer experience further drives the demand for beverage dispensers in commercial settings. As a result, the commercial segment remains the largest in the beverage dispenser market, catering to the diverse needs of businesses in the foodservice and hospitality industries.
Beverage Dispenser Market Segmentation
By Material
Plastic
Stainless Steel
Others
By Type
Hot beverage dispenser
Cold beverage dispenser
By End-User
Commercial
Residential
Countries Analyzed
North America (US, Canada, Mexico)
Europe (Germany, UK, France, Spain, Italy, Russia, Rest of Europe)
Asia Pacific (China, India, Japan, South Korea, Australia, South East Asia, Rest of Asia)
South America (Brazil, Argentina, Rest of South America)
Middle East and Africa (Saudi Arabia, UAE, Rest of Middle East, South Africa, Egypt, Rest of Africa)
Beverage Dispenser Companies Profiled in the Study
Berg Liquor Controls
Bunn-O-Matic Corp
Cal-Mil
Cambro Manufacturing Company Inc
Cornelius Inc
Crathco - Grindmaster
Elkay Manufacturing Company
follett Corp
Gold Medal Products Co.
Grindmaster-Cecilware
*- List Not Exhaustive
Chapter 1. TABLE OF CONTENTS
Chapter 2. Introduction to Beverage Dispenser Market
2.1. Market Overview
2.2. Key Statistics and Report Highlights
2.3. Scope of the Comprehensive Study
2.3.1. Market Definition
2.3.2 Countries and Regions Covered
2.3.3 Research Objective
2.3.4 Units, Currency, and Conversions
2.3.5 Industry Value Chain
2.4. Key Market Segments
2.5. Key Companies
2.6. Study Period
Chapter 3. Strategic Analysis Review
3.1. Beverage Dispenser Pricing Analysis and Forecast
3.2. Porter’s Five Forces
3.3. Market Ecosystem
3.4. SWOT Analysis
3.5. Regulatory Scenario
3.3. Effects of Inflation, Russia-Ukraine War, moderating economic growth, and other macroeconomic factors
Chapter 4. Competitive Landscape
4.1. Market Share Analysis
4.1.1. Global Beverage Dispenser Market Share by Company, 2023
4.1.2. Product Offerings of Leading Beverage Dispenser Companies
4.2. Market Entropy
4.2.1. New Product Launches in the Industry
4.2.2. Mergers, Acquisitions, Joint ventures, and Partnerships
4.3. Key Strategies and Best Practices
Chapter 5. Global Market Projections: Best, Reference, and Low Case Scenarios
5.1. Growth Analysis- Case Scenario Definitions
5.2. Low Growth Case Scenario Forecasts
5.3. Reference Growth Case Scenario Forecasts
5.4. High Growth Case Scenario Forecasts
Chapter 6. Market Dynamics
6.1. Beverage Dispenser Market Drivers
6.2. Beverage Dispenser Market Challenges
6.6. Beverage Dispenser Market Opportunities
6.4. Beverage Dispenser Market Trends
Chapter 7. Global Beverage Dispenser Market Outlook Trends
7.1. Global Beverage Dispenser Revenue (USD Million) and CAGR (%) by Type (2021-2032)
7.2. Global Beverage Dispenser Revenue (USD Million) and CAGR (%) by Application (2021-2032)
7.3. Global Beverage Dispenser Revenue (USD Million) and CAGR (%) by Product (2021-2032)
By Material
Plastic
Stainless Steel
Others
By Type
Hot beverage dispenser
Cold beverage dispenser
By End-User
Commercial
Residential
Chapter 8. Global Beverage Dispenser Regional Analysis and Outlook
8.1. Global Beverage Dispenser Revenue (USD Million) By Regions (2021- 2032)
8.2. North America Beverage Dispenser Revenue (USD Million) by Country (2021-2032)
8.2.1. United States Beverage Dispenser Regional Analysis and Outlook
8.2.2. Canada Beverage Dispenser Regional Analysis and Outlook
8.2.3. Mexico Beverage Dispenser Regional Analysis and Outlook
8.3. Europe Beverage Dispenser Revenue (USD Million), by Country (2021-2032)
8.3.1. Germany Beverage Dispenser Regional Analysis and Outlook
8.3.2. France Beverage Dispenser Regional Analysis and Outlook
8.3.3. United Kingdom Beverage Dispenser Regional Analysis and Outlook
8.3.4. Spain Beverage Dispenser Regional Analysis and Outlook
8.3.5. Italy Beverage Dispenser Regional Analysis and Outlook
8.3.6. Russia Beverage Dispenser Regional Analysis and Outlook
8.3.7. Rest of Europe Beverage Dispenser Regional Analysis and Outlook
8.4. Asia Pacific Beverage Dispenser Revenue (USD Million) by Country (2021-2032)
8.4.1. China Beverage Dispenser Regional Analysis and Outlook
8.4.2. Japan Beverage Dispenser Regional Analysis and Outlook
8.4.3. India Beverage Dispenser Regional Analysis and Outlook
8.4.4. South Korea Beverage Dispenser Regional Analysis and Outlook
8.4.5. Australia Beverage Dispenser Regional Analysis and Outlook
8.4.6. South East Asia Beverage Dispenser Regional Analysis and Outlook
8.4.7. Rest of Asia Pacific Beverage Dispenser Regional Analysis and Outlook
8.5. South America Beverage Dispenser Revenue (USD Million), by Country (2021-2032)
8.5.1. Brazil Beverage Dispenser Regional Analysis and Outlook
8.5.2. Argentina Beverage Dispenser Regional Analysis and Outlook
8.5.3. Rest of South America Beverage Dispenser Regional Analysis and Outlook
8.6. Middle East and Africa Beverage Dispenser Revenue (USD Million) by Country (2021-2032)
8.6.1. Middle East Beverage Dispenser Regional Analysis and Outlook
8.6.2. Africa Beverage Dispenser Regional Analysis and Outlook
Chapter 9. North America Beverage Dispenser Analysis and Outlook
9.1. North America Beverage Dispenser Revenue (USD Million) by Segments (2021-2032)
9.1.1. North America Beverage Dispenser Revenue (USD Million) by Type (2021-2032)
9.1.2. North America Beverage Dispenser Revenue (USD Million) by Application (2021-2032)
9.1.3. North America Beverage Dispenser Revenue (USD Million) by Product (2021-2032)
By Material
Plastic
Stainless Steel
Others
By Type
Hot beverage dispenser
Cold beverage dispenser
By End-User
Commercial
Residential
Chapter 10. Europe Beverage Dispenser Analysis and Outlook
10.1. Europe Beverage Dispenser Revenue (USD Million), by Segments (USD Million) (2021-2032)
10.1.1. Europe Beverage Dispenser Revenue (USD Million) by Type (2021-2032)
10.1.2. Europe Beverage Dispenser Revenue (USD Million) by Application (2021-2032)
10.1.3. Europe Beverage Dispenser Revenue (USD Million) by Product (2021-2032)
By Material
Plastic
Stainless Steel
Others
By Type
Hot beverage dispenser
Cold beverage dispenser
By End-User
Commercial
Residential
Chapter 11. Asia Pacific Beverage Dispenser Analysis and Outlook
11.1. Asia Pacific Beverage Dispenser Revenue (USD Million), and Revenue (USD Million) by Segments (2021-2032)
11.1.1. Asia Pacific Beverage Dispenser Revenue (USD Million) by Type (2021-2032)
11.1.2. Asia Pacific Beverage Dispenser Revenue (USD Million) by Application (2021-2032)
11.1.3. Asia Pacific Beverage Dispenser Revenue (USD Million) by Product (2021-2032)
By Material
Plastic
Stainless Steel
Others
By Type
Hot beverage dispenser
Cold beverage dispenser
By End-User
Commercial
Residential
Chapter 12. South America Beverage Dispenser Analysis and Outlook
12.1. South America Beverage Dispenser Revenue (USD Million), by Segments (2021-2032)
12.1.1. South America Beverage Dispenser Revenue (USD Million) by Type (2021-2032)
12.1.2. South America Beverage Dispenser Revenue (USD Million) by Application (2021-2032)
12.1.3. South America Beverage Dispenser Revenue (USD Million) by Product (2021-2032)
By Material
Plastic
Stainless Steel
Others
By Type
Hot beverage dispenser
Cold beverage dispenser
By End-User
Commercial
Residential
Chapter 13. Middle East and Africa Beverage Dispenser Analysis and Outlook
13.1. Middle East and Africa Beverage Dispenser Revenue (USD Million), by Segments (2021-2032)
13.1.1. Middle East and Africa Beverage Dispenser Revenue (USD Million) by Type (2021-2032)
13.1.2. Middle East and Africa Beverage Dispenser Revenue (USD Million) by Application (2021-2032)
13.1.3. Middle East and Africa Beverage Dispenser Revenue (USD Million) by Product (2021-2032)
By Material
Plastic
Stainless Steel
Others
By Type
Hot beverage dispenser
Cold beverage dispenser
By End-User
Commercial
Residential
Chapter 14. Beverage Dispenser Company Profiles
14.1 Business Overview
14.2 Product Profiles
14.3 SWOT Profiles
14.5 Recent Developments
14.6 Financial Profile
List of Companies
Berg Liquor Controls
Bunn-O-Matic Corp
Cal-Mil
Cambro Manufacturing Company Inc
Cornelius Inc
Crathco - Grindmaster
Elkay Manufacturing Company
follett Corp
Gold Medal Products Co.
Grindmaster-Cecilware
15. Methodology and Data Sources
15.1 Customization Offerings
15.2 Subscription Services
15.3 Related Reports
15.4 Publisher Expertise
LIST OF TABLES
Table 1 Market Segmentation Analysis
Table 2 Global Beverage Dispenser Market Share of Leading Companies, 2023
Table 3 Product Offerings of Leading Companies
Table 4 Low Growth Scenario Forecasts
Table 5 Reference Case Growth Scenario
Table 6 High Growth Case Scenario
Table 7 Global Beverage Dispenser Revenue (USD Million) And CAGR (%) By Type (2021-2032)
Table 8 Global Beverage Dispenser Revenue (USD Million) And CAGR (%) By Application (2021-2032)
Table 9 Global Beverage Dispenser Revenue (USD Million) And CAGR (%) By Product (2021-2032)
Table 10 Global Beverage Dispenser Market Revenue (USD Million) By Regions (2021-2032)
Table 11 Global Beverage Dispenser Market Share (%) By Regions (2021-2032)
Table 12 North America Beverage Dispenser Revenue (USD Million) By Country (2021-2032)
Table 13 Europe Beverage Dispenser Revenue (USD Million) By Country (2021-2032)
Table 14 Asia Pacific Beverage Dispenser Revenue (USD Million) By Country (2021-2032)
Table 15 South America Beverage Dispenser Revenue (USD Million) By Country (2021-2032)
Table 16 Middle East and Africa Beverage Dispenser Revenue (USD Million) By Region (2021-2032)
Table 17 North America Beverage Dispenser Revenue (USD Million) By Type (2021-2032)
Table 18 North America Beverage Dispenser Revenue (USD Million) By Application (2021-2032)
Table 19 North America Beverage Dispenser Revenue (USD Million) By Product (2021-2032)
Table 20 Europe Beverage Dispenser Revenue (USD Million) By Type (2021-2032)
Table 21 Europe Beverage Dispenser Revenue (USD Million) By Application (2021-2032)
Table 22 Europe Beverage Dispenser Revenue (USD Million) By Product (2021-2032)
Table 23 Asia Pacific Beverage Dispenser Revenue (USD Million) By Type (2021-2032)
Table 24 Asia Pacific Beverage Dispenser Revenue (USD Million) By Application (2021-2032)
Table 25 Asia Pacific Beverage Dispenser Revenue (USD Million) By Product (2021-2032)
Table 26 South America Beverage Dispenser Revenue (USD Million) By Type (2021-2032)
Table 27 South America Beverage Dispenser Revenue (USD Million) By Application (2021-2032)
Table 28 South America Beverage Dispenser Revenue (USD Million) By Product (2021-2032)
Table 29 Middle East and Africa Beverage Dispenser Revenue (USD Million) By Type (2021-2032)
Table 30 Middle East and Africa Beverage Dispenser Revenue (USD Million) By Application (2021-2032)
Table 31 Middle East and Africa Beverage Dispenser Revenue (USD Million) By Product (2021-2032)
LIST OF FIGURES
Figure 1. Market Scope
Figure 2. Pricing Forecasts Per Unit, 2023- 2032
Figure 3. Porter’s Five Forces
Figure 4. Global Beverage Dispenser Market Revenue (USD Million) By Regions (2021-2032)
Figure 5. Global Beverage Dispenser Market Share (%) By Regions (2023)
Figure 6. North America Beverage Dispenser Revenue (USD Million) By Country (2021-2032)
Figure 7. United States Beverage Dispenser Revenue (USD Million) By Country (2021-2032)
Figure 8. Canada Beverage Dispenser Revenue (USD Million) By Country (2021-2032)
Figure 9. Mexico Beverage Dispenser Revenue (USD Million) By Country (2021-2032)
Figure 10. Europe Beverage Dispenser Revenue (USD Million) By Country (2021-2032)
Figure 11. Germany Beverage Dispenser Revenue (USD Million) By Country (2021-2032)
Figure 12. France Beverage Dispenser Revenue (USD Million) By Country (2021-2032)
Figure 13. United Kingdom Beverage Dispenser Revenue (USD Million) By Country (2021-2032)
Figure 14. Spain Beverage Dispenser Revenue (USD Million) By Country (2021-2032)
Figure 15. Italy Beverage Dispenser Revenue (USD Million) By Country (2021-2032)
Figure 16. Russia Beverage Dispenser Revenue (USD Million) By Country (2021-2032)
Figure 17. Rest of Europe Beverage Dispenser Revenue (USD Million) By Country (2021-2032)
Figure 11. Asia Pacific Beverage Dispenser Revenue (USD Million) By Country (2021-2032)
Figure 12. China Beverage Dispenser Revenue (USD Million) By Country (2021-2032)
Figure 13. Japan Beverage Dispenser Revenue (USD Million) By Country (2021-2032)
Figure 14. India Beverage Dispenser Revenue (USD Million) By Country (2021-2032)
Figure 15. South Korea Beverage Dispenser Revenue (USD Million) By Country (2021-2032)
Figure 16. Australia Beverage Dispenser Revenue (USD Million) By Country (2021-2032)
Figure 17. South East Asia Beverage Dispenser Revenue (USD Million) By Country (2021-2032)
Figure 18. South America Beverage Dispenser Revenue (USD Million) By Country (2021-2032)
Figure 19. Brazil Beverage Dispenser Revenue (USD Million) By Country (2021-2032)
Figure 20. Argentina Beverage Dispenser Revenue (USD Million) By Country (2021-2032)
Figure 21. Rest of Asia Pacific Beverage Dispenser Revenue (USD Million) By Country (2021-2032)
Figure 22. Middle East and Africa Beverage Dispenser Revenue (USD Million) By Region (2021-2032)
Figure 23. Saudi Arabia Beverage Dispenser Revenue (USD Million) By Region (2021-2032)
Figure 24. The UAE Beverage Dispenser Revenue (USD Million) By Region (2021-2032)
Figure 25. Rest of Middle East Beverage Dispenser Revenue (USD Million) By Region (2021-2032)
Figure 26. South Africa Beverage Dispenser Revenue (USD Million) By Region (2021-2032)
Figure 27. Africa Beverage Dispenser Revenue (USD Million) By Region (2021-2032)
Figure 28. North America Beverage Dispenser Revenue (USD Million) By Type (2021-2032)
Figure 29. North America Beverage Dispenser Revenue (USD Million) By Application (2021-2032)
Figure 30. North America Beverage Dispenser Revenue (USD Million) By Product (2021-2032)
Figure 31. Europe Beverage Dispenser Revenue (USD Million) By Type (2021-2032)
Figure 32. Europe Beverage Dispenser Revenue (USD Million) By Application (2021-2032)
Figure 33. Europe Beverage Dispenser Revenue (USD Million) By Product (2021-2032)
Figure 34. Asia Pacific Beverage Dispenser Revenue (USD Million) By Type (2021-2032)
Figure 35. Asia Pacific Beverage Dispenser Revenue (USD Million) By Application (2021-2032)
Figure 36. Asia Pacific Beverage Dispenser Revenue (USD Million) By Product (2021-2032)
Figure 37. South America Beverage Dispenser Revenue (USD Million) By Type (2021-2032)
Figure 38. South America Beverage Dispenser Revenue (USD Million) By Application (2021-2032)
Figure 39. South America Beverage Dispenser Revenue (USD Million) By Product (2021-2032)
Figure 40. Middle East and Africa Beverage Dispenser Revenue (USD Million) By Type (2021-2032)
Figure 41. Middle East and Africa Beverage Dispenser Revenue (USD Million) By Application (2021-2032)
Figure 42. Middle East and Africa Beverage Dispenser Revenue (USD Million) By Product (2021-2032)
By Material
Plastic
Stainless Steel
Others
By Type
Hot beverage dispenser
Cold beverage dispenser
By End-User
Commercial
Residential
Countries Analyzed
North America (US, Canada, Mexico)
Europe (Germany, UK, France, Spain, Italy, Russia, Rest of Europe)
Asia Pacific (China, India, Japan, South Korea, Australia, South East Asia, Rest of Asia)
South America (Brazil, Argentina, Rest of South America)
Middle East and Africa (Saudi Arabia, UAE, Rest of Middle East, South Africa, Egypt, Rest of Africa)
