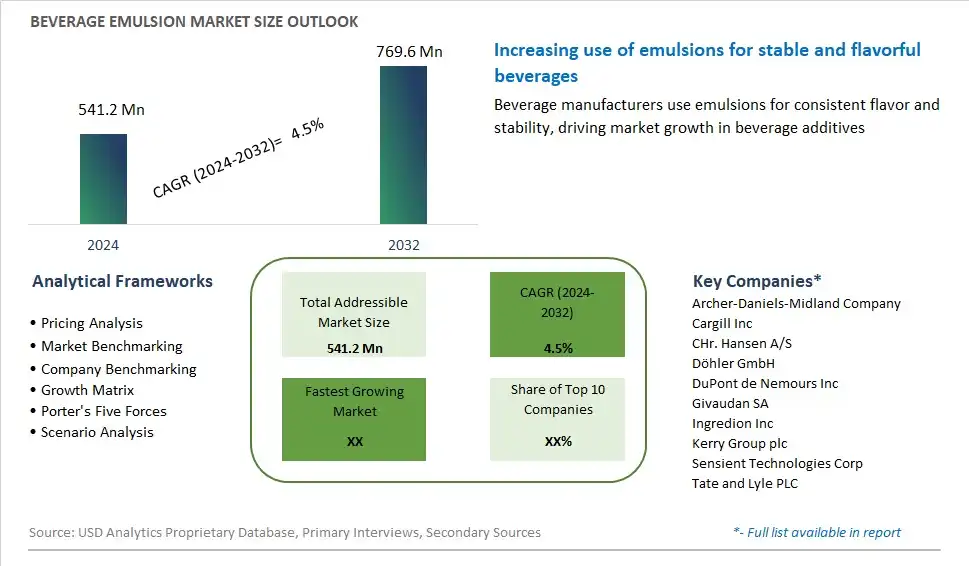
Global Beverage Emulsion Market Size is valued at $541.2 Million in 2024 and is forecast to register a growth rate (CAGR) of 4.5% to reach $769.6 Million by 2032.
The global Beverage Emulsion Market Comprehensive Study analyzes and forecasts the market size across 6 regions and 24 countries for diverse segments -By Source (Xanthan Gum, Pectin, Carboxymethyl Cellulose, Carrageenan), By Application (Non-Alcoholic, Carbonated Beverages), By Type (Color Emulsion, Flavor Emulsion, Cloud Emulsion)
An Introduction to Beverage Emulsion Market
Beverage emulsions are stable mixtures of oil and water phases, homogenized with the help of emulsifiers and stabilizers, used to create flavored or fortified beverages with a smooth, uniform texture in 2024. These emulsions are commonly used to incorporate oils, flavors, colors, vitamins, and functional ingredients into beverages such as juices, milkshakes, flavored water, and energy drinks. Beverage emulsions enhance the mouthfeel, appearance, and shelf stability of beverages, ensuring that the added ingredients are evenly distributed and remain suspended throughout the product's shelf life. With the growing demand for functional and premium beverages, the market for beverage emulsions is expanding, driven by innovations in emulsification technology, ingredient formulation, and product customization that cater to diverse consumer preferences for taste, texture, and health benefits.
Beverage Emulsion Competitive Landscape
The market report analyses the leading companies in the industry including Archer-Daniels-Midland Company, Cargill Inc, CHr. Hansen A/S, Döhler GmbH, DuPont de Nemours Inc, Givaudan SA, Ingredion Inc, Kerry Group plc, Sensient Technologies Corp, Tate and Lyle PLC, and Others.
Beverage Emulsion Market Dynamics
Beverage Emulsion Market Trend: Surge in Demand for Functional and Ready-to-drink Beverages
The market for beverage emulsions is experiencing a prominent trend driven by the surge in demand for functional and ready-to-drink beverages. Consumers are increasingly seeking beverages that offer not only refreshment but also added health benefits and convenience. Beverage emulsions play a crucial role in creating functional beverages by incorporating ingredients such as vitamins, minerals, botanical extracts, and CBD oil into liquid formulations. This trend is fueled by changing consumer lifestyles, including a growing interest in health and wellness, on-the-go consumption habits, and the desire for novel and innovative beverage experiences. As a result, there is a growing demand for beverage emulsions that can deliver functional benefits, enhance flavor profiles, and improve shelf stability in a wide range of ready-to-drink beverages, driving market growth and innovation.
Market Driver: Innovation in Beverage Formulation and Product Differentiation
A significant driver of the beverage emulsion market is innovation in beverage formulation and product differentiation. As competition intensifies in the beverage industry, manufacturers are seeking ways to differentiate their products and capture market share. Beverage emulsions offer a versatile platform for creating unique and differentiated beverage formulations that stand out to consumers. Whether it's incorporating exotic flavors, natural ingredients, or functional additives, beverage emulsions provide a means to customize beverage products to meet specific consumer preferences and market trends. Moreover, the flexibility of emulsion technology allows for the development of beverages with enhanced mouthfeel, texture, and stability, appealing to discerning consumers seeking premium and indulgent beverage experiences. The drive for product innovation and differentiation is fueling the demand for beverage emulsions as essential ingredients in creating innovative and market-leading beverage products.
Market Opportunity: Expansion into Health and Wellness Beverage Segments
An opportunity for the beverage emulsion market lies in expansion into the health and wellness beverage segments. With increasing consumer awareness of the importance of nutrition and well-being, there is a growing demand for beverages that offer functional benefits such as immune support, energy enhancement, and stress relief. Beverage emulsions provide a versatile platform for fortifying beverages with functional ingredients such as vitamins, antioxidants, probiotics, and herbal extracts, catering to the needs of health-conscious consumers. Additionally, there is potential for developing beverage emulsions targeted towards specific health and wellness trends, such as plant-based, low-sugar, or clean label beverages. By tapping into the health and wellness beverage segments, beverage emulsion manufacturers can capitalize on growing consumer demand for functional beverages and position themselves as leaders in providing innovative and nutritious beverage solutions.
Beverage Emulsion Market Share Analysis: Xanthan Gum held the dominant market share in 2024
The xanthan gum segment commands the largest share in the beverage emulsion market due to its superior emulsifying properties, versatility, and wide range of applications in the beverage industry. Xanthan gum, derived from fermentation of carbohydrates by the bacterium Xanthomonas campestris, acts as a stabilizer and thickening agent, effectively preventing phase separation and maintaining the stability of emulsions in beverages. Its ability to create smooth and uniform textures, improve mouthfeel, and enhance flavor dispersion makes it an ideal choice for emulsifying various types of beverages, including juices, dairy drinks, smoothies, and plant-based milks. Additionally, xanthan gum is compatible with a variety of ingredients and processing conditions, offering beverage manufacturers flexibility and ease of formulation. As a result, the xanthan gum segment remains the largest in the beverage emulsion market, meeting the demand for stable and high-quality emulsified beverages among consumers.
Beverage Emulsion Market Share Analysis: Non-Alcoholic Beverages market is poised to register the fastest growth rae over the forecast period to 2032
The non-alcoholic beverages segment is experiencing the fastest growth in the beverage emulsion market due to the rising consumer demand for innovative and flavorful non-alcoholic drink options. Beverage emulsions play a crucial role in enhancing the sensory experience and overall quality of non-alcoholic beverages such as fruit juices, flavored water, energy drinks, and functional beverages. Emulsions help improve the stability, mouthfeel, and visual appeal of these beverages, contributing to enhanced consumer satisfaction and product differentiation. Additionally, the growing trend towards healthier beverage choices and the increasing popularity of functional and wellness beverages further drive the demand for beverage emulsions in the non-alcoholic segment. Further, advancements in emulsion technology and formulation techniques enable manufacturers to develop customized emulsions that meet specific taste, texture, and nutritional requirements, fueling the growth of this segment in the beverage emulsion market.
Beverage Emulsion Market Share Analysis: Flavor Emulsion held the dominant market share in 2024
The flavor emulsion segment commands the largest share in the beverage emulsion market owing to its essential role in enhancing taste profiles and sensory experiences in a wide range of beverages. Flavor emulsions are utilized extensively by beverage manufacturers to impart distinctive and appealing flavors to their products, including juices, soft drinks, sports drinks, and functional beverages. These emulsions enable precise control over flavor intensity, consistency, and stability, ensuring a consistent taste experience for consumers across batches. Further, the growing consumer demand for unique and exotic flavor combinations, as well as natural and clean label ingredients, drives the adoption of flavor emulsions in the beverage industry. Additionally, advancements in emulsion technology enable the development of novel and complex flavor profiles, further bolstering the dominance of the flavor emulsion segment in the beverage emulsion market.
Beverage Emulsion Market Segmentation
By Source
Xanthan Gum
Pectin
Carboxymethyl Cellulose
Carrageenan
By Application
Non-Alcoholic
Carbonated Beverages
By Type
Color Emulsion
Flavor Emulsion
Cloud Emulsion
Countries Analyzed
North America (US, Canada, Mexico)
Europe (Germany, UK, France, Spain, Italy, Russia, Rest of Europe)
Asia Pacific (China, India, Japan, South Korea, Australia, South East Asia, Rest of Asia)
South America (Brazil, Argentina, Rest of South America)
Middle East and Africa (Saudi Arabia, UAE, Rest of Middle East, South Africa, Egypt, Rest of Africa)
Beverage Emulsion Companies Profiled in the Study
Archer-Daniels-Midland Company
Cargill Inc
CHr. Hansen A/S
Döhler GmbH
DuPont de Nemours Inc
Givaudan SA
Ingredion Inc
Kerry Group plc
Sensient Technologies Corp
Tate and Lyle PLC
*- List Not Exhaustive
Chapter 1. TABLE OF CONTENTS
Chapter 2. Introduction to Beverage Emulsion Market
2.1. Market Overview
2.2. Key Statistics and Report Highlights
2.3. Scope of the Comprehensive Study
2.3.1. Market Definition
2.3.2 Countries and Regions Covered
2.3.3 Research Objective
2.3.4 Units, Currency, and Conversions
2.3.5 Industry Value Chain
2.4. Key Market Segments
2.5. Key Companies
2.6. Study Period
Chapter 3. Strategic Analysis Review
3.1. Beverage Emulsion Pricing Analysis and Forecast
3.2. Porter’s Five Forces
3.3. Market Ecosystem
3.4. SWOT Analysis
3.5. Regulatory Scenario
3.3. Effects of Inflation, Russia-Ukraine War, moderating economic growth, and other macroeconomic factors
Chapter 4. Competitive Landscape
4.1. Market Share Analysis
4.1.1. Global Beverage Emulsion Market Share by Company, 2023
4.1.2. Product Offerings of Leading Beverage Emulsion Companies
4.2. Market Entropy
4.2.1. New Product Launches in the Industry
4.2.2. Mergers, Acquisitions, Joint ventures, and Partnerships
4.3. Key Strategies and Best Practices
Chapter 5. Global Market Projections: Best, Reference, and Low Case Scenarios
5.1. Growth Analysis- Case Scenario Definitions
5.2. Low Growth Case Scenario Forecasts
5.3. Reference Growth Case Scenario Forecasts
5.4. High Growth Case Scenario Forecasts
Chapter 6. Market Dynamics
6.1. Beverage Emulsion Market Drivers
6.2. Beverage Emulsion Market Challenges
6.6. Beverage Emulsion Market Opportunities
6.4. Beverage Emulsion Market Trends
Chapter 7. Global Beverage Emulsion Market Outlook Trends
7.1. Global Beverage Emulsion Revenue (USD Million) and CAGR (%) by Type (2021-2032)
7.2. Global Beverage Emulsion Revenue (USD Million) and CAGR (%) by Application (2021-2032)
7.3. Global Beverage Emulsion Revenue (USD Million) and CAGR (%) by Product (2021-2032)
By Source
Xanthan Gum
Pectin
Carboxymethyl Cellulose
Carrageenan
By Application
Non-Alcoholic
Carbonated Beverages
By Type
Color Emulsion
Flavor Emulsion
Cloud Emulsion
Chapter 8. Global Beverage Emulsion Regional Analysis and Outlook
8.1. Global Beverage Emulsion Revenue (USD Million) By Regions (2021- 2032)
8.2. North America Beverage Emulsion Revenue (USD Million) by Country (2021-2032)
8.2.1. United States Beverage Emulsion Regional Analysis and Outlook
8.2.2. Canada Beverage Emulsion Regional Analysis and Outlook
8.2.3. Mexico Beverage Emulsion Regional Analysis and Outlook
8.3. Europe Beverage Emulsion Revenue (USD Million), by Country (2021-2032)
8.3.1. Germany Beverage Emulsion Regional Analysis and Outlook
8.3.2. France Beverage Emulsion Regional Analysis and Outlook
8.3.3. United Kingdom Beverage Emulsion Regional Analysis and Outlook
8.3.4. Spain Beverage Emulsion Regional Analysis and Outlook
8.3.5. Italy Beverage Emulsion Regional Analysis and Outlook
8.3.6. Russia Beverage Emulsion Regional Analysis and Outlook
8.3.7. Rest of Europe Beverage Emulsion Regional Analysis and Outlook
8.4. Asia Pacific Beverage Emulsion Revenue (USD Million) by Country (2021-2032)
8.4.1. China Beverage Emulsion Regional Analysis and Outlook
8.4.2. Japan Beverage Emulsion Regional Analysis and Outlook
8.4.3. India Beverage Emulsion Regional Analysis and Outlook
8.4.4. South Korea Beverage Emulsion Regional Analysis and Outlook
8.4.5. Australia Beverage Emulsion Regional Analysis and Outlook
8.4.6. South East Asia Beverage Emulsion Regional Analysis and Outlook
8.4.7. Rest of Asia Pacific Beverage Emulsion Regional Analysis and Outlook
8.5. South America Beverage Emulsion Revenue (USD Million), by Country (2021-2032)
8.5.1. Brazil Beverage Emulsion Regional Analysis and Outlook
8.5.2. Argentina Beverage Emulsion Regional Analysis and Outlook
8.5.3. Rest of South America Beverage Emulsion Regional Analysis and Outlook
8.6. Middle East and Africa Beverage Emulsion Revenue (USD Million) by Country (2021-2032)
8.6.1. Middle East Beverage Emulsion Regional Analysis and Outlook
8.6.2. Africa Beverage Emulsion Regional Analysis and Outlook
Chapter 9. North America Beverage Emulsion Analysis and Outlook
9.1. North America Beverage Emulsion Revenue (USD Million) by Segments (2021-2032)
9.1.1. North America Beverage Emulsion Revenue (USD Million) by Type (2021-2032)
9.1.2. North America Beverage Emulsion Revenue (USD Million) by Application (2021-2032)
9.1.3. North America Beverage Emulsion Revenue (USD Million) by Product (2021-2032)
By Source
Xanthan Gum
Pectin
Carboxymethyl Cellulose
Carrageenan
By Application
Non-Alcoholic
Carbonated Beverages
By Type
Color Emulsion
Flavor Emulsion
Cloud Emulsion
Chapter 10. Europe Beverage Emulsion Analysis and Outlook
10.1. Europe Beverage Emulsion Revenue (USD Million), by Segments (USD Million) (2021-2032)
10.1.1. Europe Beverage Emulsion Revenue (USD Million) by Type (2021-2032)
10.1.2. Europe Beverage Emulsion Revenue (USD Million) by Application (2021-2032)
10.1.3. Europe Beverage Emulsion Revenue (USD Million) by Product (2021-2032)
By Source
Xanthan Gum
Pectin
Carboxymethyl Cellulose
Carrageenan
By Application
Non-Alcoholic
Carbonated Beverages
By Type
Color Emulsion
Flavor Emulsion
Cloud Emulsion
Chapter 11. Asia Pacific Beverage Emulsion Analysis and Outlook
11.1. Asia Pacific Beverage Emulsion Revenue (USD Million), and Revenue (USD Million) by Segments (2021-2032)
11.1.1. Asia Pacific Beverage Emulsion Revenue (USD Million) by Type (2021-2032)
11.1.2. Asia Pacific Beverage Emulsion Revenue (USD Million) by Application (2021-2032)
11.1.3. Asia Pacific Beverage Emulsion Revenue (USD Million) by Product (2021-2032)
By Source
Xanthan Gum
Pectin
Carboxymethyl Cellulose
Carrageenan
By Application
Non-Alcoholic
Carbonated Beverages
By Type
Color Emulsion
Flavor Emulsion
Cloud Emulsion
Chapter 12. South America Beverage Emulsion Analysis and Outlook
12.1. South America Beverage Emulsion Revenue (USD Million), by Segments (2021-2032)
12.1.1. South America Beverage Emulsion Revenue (USD Million) by Type (2021-2032)
12.1.2. South America Beverage Emulsion Revenue (USD Million) by Application (2021-2032)
12.1.3. South America Beverage Emulsion Revenue (USD Million) by Product (2021-2032)
By Source
Xanthan Gum
Pectin
Carboxymethyl Cellulose
Carrageenan
By Application
Non-Alcoholic
Carbonated Beverages
By Type
Color Emulsion
Flavor Emulsion
Cloud Emulsion
Chapter 13. Middle East and Africa Beverage Emulsion Analysis and Outlook
13.1. Middle East and Africa Beverage Emulsion Revenue (USD Million), by Segments (2021-2032)
13.1.1. Middle East and Africa Beverage Emulsion Revenue (USD Million) by Type (2021-2032)
13.1.2. Middle East and Africa Beverage Emulsion Revenue (USD Million) by Application (2021-2032)
13.1.3. Middle East and Africa Beverage Emulsion Revenue (USD Million) by Product (2021-2032)
By Source
Xanthan Gum
Pectin
Carboxymethyl Cellulose
Carrageenan
By Application
Non-Alcoholic
Carbonated Beverages
By Type
Color Emulsion
Flavor Emulsion
Cloud Emulsion
Chapter 14. Beverage Emulsion Company Profiles
14.1 Business Overview
14.2 Product Profiles
14.3 SWOT Profiles
14.5 Recent Developments
14.6 Financial Profile
List of Companies
Archer-Daniels-Midland Company
Cargill Inc
CHr. Hansen A/S
Döhler GmbH
DuPont de Nemours Inc
Givaudan SA
Ingredion Inc
Kerry Group plc
Sensient Technologies Corp
Tate and Lyle PLC
15. Methodology and Data Sources
15.1 Customization Offerings
15.2 Subscription Services
15.3 Related Reports
15.4 Publisher Expertise
LIST OF TABLES
Table 1 Market Segmentation Analysis
Table 2 Global Beverage Emulsion Market Share of Leading Companies, 2023
Table 3 Product Offerings of Leading Companies
Table 4 Low Growth Scenario Forecasts
Table 5 Reference Case Growth Scenario
Table 6 High Growth Case Scenario
Table 7 Global Beverage Emulsion Revenue (USD Million) And CAGR (%) By Type (2021-2032)
Table 8 Global Beverage Emulsion Revenue (USD Million) And CAGR (%) By Application (2021-2032)
Table 9 Global Beverage Emulsion Revenue (USD Million) And CAGR (%) By Product (2021-2032)
Table 10 Global Beverage Emulsion Market Revenue (USD Million) By Regions (2021-2032)
Table 11 Global Beverage Emulsion Market Share (%) By Regions (2021-2032)
Table 12 North America Beverage Emulsion Revenue (USD Million) By Country (2021-2032)
Table 13 Europe Beverage Emulsion Revenue (USD Million) By Country (2021-2032)
Table 14 Asia Pacific Beverage Emulsion Revenue (USD Million) By Country (2021-2032)
Table 15 South America Beverage Emulsion Revenue (USD Million) By Country (2021-2032)
Table 16 Middle East and Africa Beverage Emulsion Revenue (USD Million) By Region (2021-2032)
Table 17 North America Beverage Emulsion Revenue (USD Million) By Type (2021-2032)
Table 18 North America Beverage Emulsion Revenue (USD Million) By Application (2021-2032)
Table 19 North America Beverage Emulsion Revenue (USD Million) By Product (2021-2032)
Table 20 Europe Beverage Emulsion Revenue (USD Million) By Type (2021-2032)
Table 21 Europe Beverage Emulsion Revenue (USD Million) By Application (2021-2032)
Table 22 Europe Beverage Emulsion Revenue (USD Million) By Product (2021-2032)
Table 23 Asia Pacific Beverage Emulsion Revenue (USD Million) By Type (2021-2032)
Table 24 Asia Pacific Beverage Emulsion Revenue (USD Million) By Application (2021-2032)
Table 25 Asia Pacific Beverage Emulsion Revenue (USD Million) By Product (2021-2032)
Table 26 South America Beverage Emulsion Revenue (USD Million) By Type (2021-2032)
Table 27 South America Beverage Emulsion Revenue (USD Million) By Application (2021-2032)
Table 28 South America Beverage Emulsion Revenue (USD Million) By Product (2021-2032)
Table 29 Middle East and Africa Beverage Emulsion Revenue (USD Million) By Type (2021-2032)
Table 30 Middle East and Africa Beverage Emulsion Revenue (USD Million) By Application (2021-2032)
Table 31 Middle East and Africa Beverage Emulsion Revenue (USD Million) By Product (2021-2032)
LIST OF FIGURES
Figure 1. Market Scope
Figure 2. Pricing Forecasts Per Unit, 2023- 2032
Figure 3. Porter’s Five Forces
Figure 4. Global Beverage Emulsion Market Revenue (USD Million) By Regions (2021-2032)
Figure 5. Global Beverage Emulsion Market Share (%) By Regions (2023)
Figure 6. North America Beverage Emulsion Revenue (USD Million) By Country (2021-2032)
Figure 7. United States Beverage Emulsion Revenue (USD Million) By Country (2021-2032)
Figure 8. Canada Beverage Emulsion Revenue (USD Million) By Country (2021-2032)
Figure 9. Mexico Beverage Emulsion Revenue (USD Million) By Country (2021-2032)
Figure 10. Europe Beverage Emulsion Revenue (USD Million) By Country (2021-2032)
Figure 11. Germany Beverage Emulsion Revenue (USD Million) By Country (2021-2032)
Figure 12. France Beverage Emulsion Revenue (USD Million) By Country (2021-2032)
Figure 13. United Kingdom Beverage Emulsion Revenue (USD Million) By Country (2021-2032)
Figure 14. Spain Beverage Emulsion Revenue (USD Million) By Country (2021-2032)
Figure 15. Italy Beverage Emulsion Revenue (USD Million) By Country (2021-2032)
Figure 16. Russia Beverage Emulsion Revenue (USD Million) By Country (2021-2032)
Figure 17. Rest of Europe Beverage Emulsion Revenue (USD Million) By Country (2021-2032)
Figure 11. Asia Pacific Beverage Emulsion Revenue (USD Million) By Country (2021-2032)
Figure 12. China Beverage Emulsion Revenue (USD Million) By Country (2021-2032)
Figure 13. Japan Beverage Emulsion Revenue (USD Million) By Country (2021-2032)
Figure 14. India Beverage Emulsion Revenue (USD Million) By Country (2021-2032)
Figure 15. South Korea Beverage Emulsion Revenue (USD Million) By Country (2021-2032)
Figure 16. Australia Beverage Emulsion Revenue (USD Million) By Country (2021-2032)
Figure 17. South East Asia Beverage Emulsion Revenue (USD Million) By Country (2021-2032)
Figure 18. South America Beverage Emulsion Revenue (USD Million) By Country (2021-2032)
Figure 19. Brazil Beverage Emulsion Revenue (USD Million) By Country (2021-2032)
Figure 20. Argentina Beverage Emulsion Revenue (USD Million) By Country (2021-2032)
Figure 21. Rest of Asia Pacific Beverage Emulsion Revenue (USD Million) By Country (2021-2032)
Figure 22. Middle East and Africa Beverage Emulsion Revenue (USD Million) By Region (2021-2032)
Figure 23. Saudi Arabia Beverage Emulsion Revenue (USD Million) By Region (2021-2032)
Figure 24. The UAE Beverage Emulsion Revenue (USD Million) By Region (2021-2032)
Figure 25. Rest of Middle East Beverage Emulsion Revenue (USD Million) By Region (2021-2032)
Figure 26. South Africa Beverage Emulsion Revenue (USD Million) By Region (2021-2032)
Figure 27. Africa Beverage Emulsion Revenue (USD Million) By Region (2021-2032)
Figure 28. North America Beverage Emulsion Revenue (USD Million) By Type (2021-2032)
Figure 29. North America Beverage Emulsion Revenue (USD Million) By Application (2021-2032)
Figure 30. North America Beverage Emulsion Revenue (USD Million) By Product (2021-2032)
Figure 31. Europe Beverage Emulsion Revenue (USD Million) By Type (2021-2032)
Figure 32. Europe Beverage Emulsion Revenue (USD Million) By Application (2021-2032)
Figure 33. Europe Beverage Emulsion Revenue (USD Million) By Product (2021-2032)
Figure 34. Asia Pacific Beverage Emulsion Revenue (USD Million) By Type (2021-2032)
Figure 35. Asia Pacific Beverage Emulsion Revenue (USD Million) By Application (2021-2032)
Figure 36. Asia Pacific Beverage Emulsion Revenue (USD Million) By Product (2021-2032)
Figure 37. South America Beverage Emulsion Revenue (USD Million) By Type (2021-2032)
Figure 38. South America Beverage Emulsion Revenue (USD Million) By Application (2021-2032)
Figure 39. South America Beverage Emulsion Revenue (USD Million) By Product (2021-2032)
Figure 40. Middle East and Africa Beverage Emulsion Revenue (USD Million) By Type (2021-2032)
Figure 41. Middle East and Africa Beverage Emulsion Revenue (USD Million) By Application (2021-2032)
Figure 42. Middle East and Africa Beverage Emulsion Revenue (USD Million) By Product (2021-2032)
By Source
Xanthan Gum
Pectin
Carboxymethyl Cellulose
Carrageenan
By Application
Non-Alcoholic
Carbonated Beverages
By Type
Color Emulsion
Flavor Emulsion
Cloud Emulsion
Countries Analyzed
North America (US, Canada, Mexico)
Europe (Germany, UK, France, Spain, Italy, Russia, Rest of Europe)
Asia Pacific (China, India, Japan, South Korea, Australia, South East Asia, Rest of Asia)
South America (Brazil, Argentina, Rest of South America)
Middle East and Africa (Saudi Arabia, UAE, Rest of Middle East, South Africa, Egypt, Rest of Africa)
