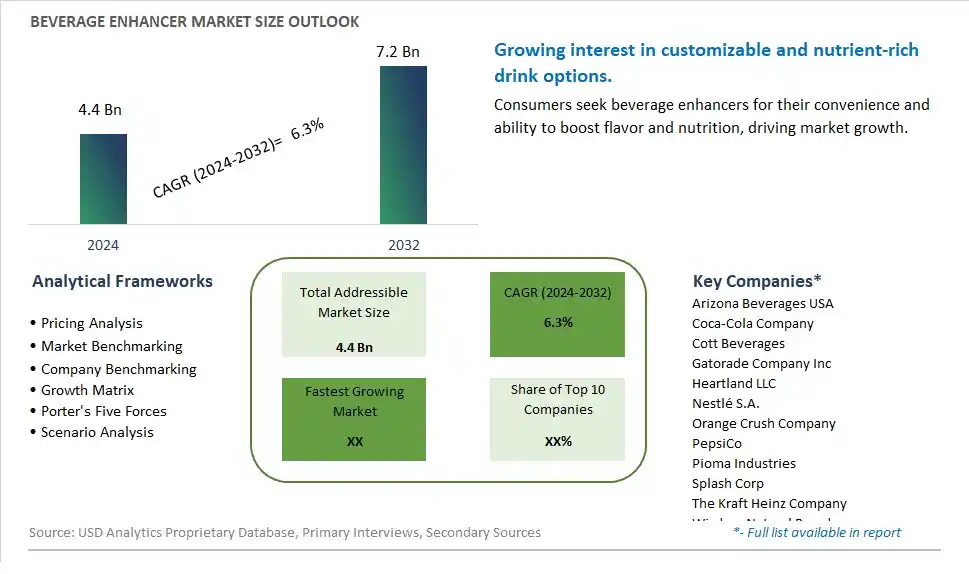
Global Beverage Enhancer Market Size is valued at $4.4 Billion in 2024 and is forecast to register a growth rate (CAGR) of 6.3% to reach $7.2 Billion by 2032.
The global Beverage Enhancer Market Comprehensive Study analyzes and forecasts the market size across 6 regions and 24 countries for diverse segments -By Type (Vitamins, Electrolytes, Anti-oxidants, Sweeteners, Others), By Application (Soft Beverage, Alcoholic Beverage)
An Introduction to Beverage Enhancer Market
The Beverage Enhancer market in 2024 is expanding rapidly, driven by the growing consumer interest in personalized and convenient ways to enhance the flavor and nutritional value of their drinks. Beverage enhancers, which include liquid drops, powders, and tablets, are used to add flavor, vitamins, electrolytes, and other functional ingredients to water and other beverages. The market is supported by the increasing demand for on-the-go and customizable beverage options. Advances in formulation and packaging technologies are enhancing the convenience, effectiveness, and appeal of beverage enhancers. The market is also benefiting from the trend towards health and wellness, as consumers seek products that support hydration, energy, and overall well-being.
Beverage Enhancer Competitive Landscape
The market report analyses the leading companies in the industry including Arizona Beverages USA, Coca-Cola Company, Cott Beverages, Gatorade Company Inc, Heartland LLC, Nestlé S.A., Orange Crush Company, PepsiCo, Pioma Industries, Splash Corp, The Kraft Heinz Company, Wisdom Natural Brands, and Others.
Beverage Enhancer Market Dynamics
Beverage Enhancer Market Trend: Shift Towards Personalized and Functional Beverages
The most prominent market trend for Beverage Enhancers is the shift towards personalized and functional beverages. Consumers are increasingly looking for beverages that cater to their individual preferences, dietary needs, and health goals. Beverage enhancers, such as flavor drops, vitamin-infused additives, and energy-boosting concentrates, allow consumers to customize their beverages according to taste, nutritional content, and desired functionalities. This trend reflects a broader demand for personalized and functional products in the beverage industry, driving the growth of beverage enhancers as a convenient and versatile solution for consumers seeking tailored beverage experiences.
Beverage Enhancer Market Driver: Consumer Demand for Convenience and Portability
A key market driver for Beverage Enhancers is the consumer demand for convenience and portability. Beverage enhancers offer a convenient way for consumers to enhance the flavor, nutritional value, and functionality of their beverages on the go. With busy lifestyles and on-the-move consumption habits, consumers value products that are easy to use, portable, and can be added to a variety of beverages, including water, juices, teas, and sports drinks. The driver of convenience and portability fuels the adoption of beverage enhancers as a convenient solution for enhancing beverages anytime, anywhere.
Beverage Enhancer Market Opportunity: Expansion into Health and Wellness Segments
A potential opportunity within the Beverage Enhancers market lies in expansion into health and wellness segments. Collaborating with nutritionists, fitness experts, and health professionals can lead to the development of beverage enhancers that offer targeted health benefits, such as hydration support, immune system boosters, stress relief, and cognitive function enhancers. Additionally, exploring opportunities in natural and clean label beverage enhancers, sugar-free alternatives, and functional ingredients derived from plant sources can cater to the growing demand for healthier beverage enhancement options. By focusing on expansion into health and wellness segments, there are opportunities to capitalize on consumer interest in functional beverages, differentiate products, and capture market share in the evolving beverage enhancers market.
Beverage Enhancer Market Share Analysis: Vitamins segment generated the highest revenue share in the industry
The largest segment in the Beverage Enhancer Market is Vitamins. Within the vitamins category, one sub-segment that is experiencing fast growth is Electrolytes. Electrolytes are essential minerals like sodium, potassium, calcium, and magnesium that help maintain fluid balance, nerve function, and muscle contractions in the body. The rapid growth of electrolytes in beverage enhancers can be attributed to the increasing consumer focus on hydration and overall wellness. With the rise in active lifestyles and awareness about the importance of replenishing electrolytes lost during physical activity, beverages fortified with electrolytes have gained popularity among athletes, fitness enthusiasts, and health-conscious individuals. Additionally, the convenience of electrolyte-enhanced beverages as a quick and effective way to rehydrate after exertion or in hot climates has contributed to their growing demand. As a result, electrolytes represent a significant growth opportunity within the Beverage Enhancer Market, driving innovation and expansion in this segment.
Beverage Enhancer Market Share Analysis: Soft Beverages is the fastest growing segment over the forecast period to 2032
The Soft Beverages segment within the Beverage Enhancer Market is poised for the fastest growth up to 2032. One sub-category experiencing rapid growth within soft beverages is Functional Beverages. Functional beverages are those fortified with additional nutrients, herbs, or other ingredients to provide specific health benefits beyond basic hydration. This segment is witnessing fast growth due to changing consumer preferences towards healthier beverage options. With increasing concerns about health and wellness, consumers are seeking beverages that offer functional benefits such as energy enhancement, immune support, digestive health, and mental clarity. Functional beverages are also gaining traction among demographics like millennials and Generation Z, who prioritize products that align with their active lifestyles and well-being goals. Further, advancements in beverage technology and formulation are enabling manufacturers to create innovative functional beverages that cater to diverse consumer needs, further driving the growth of this segment within the Beverage Enhancer Market.
Beverage Enhancer Market Segmentation
By Type
Vitamins
Electrolytes
Anti-oxidants
Sweeteners
Others
By Application
Soft Beverage
Alcoholic Beverage
Countries Analyzed
North America (US, Canada, Mexico)
Europe (Germany, UK, France, Spain, Italy, Russia, Rest of Europe)
Asia Pacific (China, India, Japan, South Korea, Australia, South East Asia, Rest of Asia)
South America (Brazil, Argentina, Rest of South America)
Middle East and Africa (Saudi Arabia, UAE, Rest of Middle East, South Africa, Egypt, Rest of Africa)
Beverage Enhancer Companies Profiled in the Study
Arizona Beverages USA
Coca-Cola Company
Cott Beverages
Gatorade Company Inc
Heartland LLC
Nestlé S.A.
Orange Crush Company
PepsiCo
Pioma Industries
Splash Corp
The Kraft Heinz Company
Wisdom Natural Brands
*- List Not Exhaustive
Chapter 1. TABLE OF CONTENTS
Chapter 2. Introduction to Beverage Enhancer Market
2.1. Market Overview
2.2. Key Statistics and Report Highlights
2.3. Scope of the Comprehensive Study
2.3.1. Market Definition
2.3.2 Countries and Regions Covered
2.3.3 Research Objective
2.3.4 Units, Currency, and Conversions
2.3.5 Industry Value Chain
2.4. Key Market Segments
2.5. Key Companies
2.6. Study Period
Chapter 3. Strategic Analysis Review
3.1. Beverage Enhancer Pricing Analysis and Forecast
3.2. Porter’s Five Forces
3.3. Market Ecosystem
3.4. SWOT Analysis
3.5. Regulatory Scenario
3.3. Effects of Inflation, Russia-Ukraine War, moderating economic growth, and other macroeconomic factors
Chapter 4. Competitive Landscape
4.1. Market Share Analysis
4.1.1. Global Beverage Enhancer Market Share by Company, 2023
4.1.2. Product Offerings of Leading Beverage Enhancer Companies
4.2. Market Entropy
4.2.1. New Product Launches in the Industry
4.2.2. Mergers, Acquisitions, Joint ventures, and Partnerships
4.3. Key Strategies and Best Practices
Chapter 5. Global Market Projections: Best, Reference, and Low Case Scenarios
5.1. Growth Analysis- Case Scenario Definitions
5.2. Low Growth Case Scenario Forecasts
5.3. Reference Growth Case Scenario Forecasts
5.4. High Growth Case Scenario Forecasts
Chapter 6. Market Dynamics
6.1. Beverage Enhancer Market Drivers
6.2. Beverage Enhancer Market Challenges
6.6. Beverage Enhancer Market Opportunities
6.4. Beverage Enhancer Market Trends
Chapter 7. Global Beverage Enhancer Market Outlook Trends
7.1. Global Beverage Enhancer Revenue (USD Million) and CAGR (%) by Type (2021-2032)
7.2. Global Beverage Enhancer Revenue (USD Million) and CAGR (%) by Application (2021-2032)
7.3. Global Beverage Enhancer Revenue (USD Million) and CAGR (%) by Product (2021-2032)
By Type
Vitamins
Electrolytes
Anti-oxidants
Sweeteners
Others
By Application
Soft Beverage
Alcoholic Beverage
Chapter 8. Global Beverage Enhancer Regional Analysis and Outlook
8.1. Global Beverage Enhancer Revenue (USD Million) By Regions (2021- 2032)
8.2. North America Beverage Enhancer Revenue (USD Million) by Country (2021-2032)
8.2.1. United States Beverage Enhancer Regional Analysis and Outlook
8.2.2. Canada Beverage Enhancer Regional Analysis and Outlook
8.2.3. Mexico Beverage Enhancer Regional Analysis and Outlook
8.3. Europe Beverage Enhancer Revenue (USD Million), by Country (2021-2032)
8.3.1. Germany Beverage Enhancer Regional Analysis and Outlook
8.3.2. France Beverage Enhancer Regional Analysis and Outlook
8.3.3. United Kingdom Beverage Enhancer Regional Analysis and Outlook
8.3.4. Spain Beverage Enhancer Regional Analysis and Outlook
8.3.5. Italy Beverage Enhancer Regional Analysis and Outlook
8.3.6. Russia Beverage Enhancer Regional Analysis and Outlook
8.3.7. Rest of Europe Beverage Enhancer Regional Analysis and Outlook
8.4. Asia Pacific Beverage Enhancer Revenue (USD Million) by Country (2021-2032)
8.4.1. China Beverage Enhancer Regional Analysis and Outlook
8.4.2. Japan Beverage Enhancer Regional Analysis and Outlook
8.4.3. India Beverage Enhancer Regional Analysis and Outlook
8.4.4. South Korea Beverage Enhancer Regional Analysis and Outlook
8.4.5. Australia Beverage Enhancer Regional Analysis and Outlook
8.4.6. South East Asia Beverage Enhancer Regional Analysis and Outlook
8.4.7. Rest of Asia Pacific Beverage Enhancer Regional Analysis and Outlook
8.5. South America Beverage Enhancer Revenue (USD Million), by Country (2021-2032)
8.5.1. Brazil Beverage Enhancer Regional Analysis and Outlook
8.5.2. Argentina Beverage Enhancer Regional Analysis and Outlook
8.5.3. Rest of South America Beverage Enhancer Regional Analysis and Outlook
8.6. Middle East and Africa Beverage Enhancer Revenue (USD Million) by Country (2021-2032)
8.6.1. Middle East Beverage Enhancer Regional Analysis and Outlook
8.6.2. Africa Beverage Enhancer Regional Analysis and Outlook
Chapter 9. North America Beverage Enhancer Analysis and Outlook
9.1. North America Beverage Enhancer Revenue (USD Million) by Segments (2021-2032)
9.1.1. North America Beverage Enhancer Revenue (USD Million) by Type (2021-2032)
9.1.2. North America Beverage Enhancer Revenue (USD Million) by Application (2021-2032)
9.1.3. North America Beverage Enhancer Revenue (USD Million) by Product (2021-2032)
By Type
Vitamins
Electrolytes
Anti-oxidants
Sweeteners
Others
By Application
Soft Beverage
Alcoholic Beverage
Chapter 10. Europe Beverage Enhancer Analysis and Outlook
10.1. Europe Beverage Enhancer Revenue (USD Million), by Segments (USD Million) (2021-2032)
10.1.1. Europe Beverage Enhancer Revenue (USD Million) by Type (2021-2032)
10.1.2. Europe Beverage Enhancer Revenue (USD Million) by Application (2021-2032)
10.1.3. Europe Beverage Enhancer Revenue (USD Million) by Product (2021-2032)
By Type
Vitamins
Electrolytes
Anti-oxidants
Sweeteners
Others
By Application
Soft Beverage
Alcoholic Beverage
Chapter 11. Asia Pacific Beverage Enhancer Analysis and Outlook
11.1. Asia Pacific Beverage Enhancer Revenue (USD Million), and Revenue (USD Million) by Segments (2021-2032)
11.1.1. Asia Pacific Beverage Enhancer Revenue (USD Million) by Type (2021-2032)
11.1.2. Asia Pacific Beverage Enhancer Revenue (USD Million) by Application (2021-2032)
11.1.3. Asia Pacific Beverage Enhancer Revenue (USD Million) by Product (2021-2032)
By Type
Vitamins
Electrolytes
Anti-oxidants
Sweeteners
Others
By Application
Soft Beverage
Alcoholic Beverage
Chapter 12. South America Beverage Enhancer Analysis and Outlook
12.1. South America Beverage Enhancer Revenue (USD Million), by Segments (2021-2032)
12.1.1. South America Beverage Enhancer Revenue (USD Million) by Type (2021-2032)
12.1.2. South America Beverage Enhancer Revenue (USD Million) by Application (2021-2032)
12.1.3. South America Beverage Enhancer Revenue (USD Million) by Product (2021-2032)
By Type
Vitamins
Electrolytes
Anti-oxidants
Sweeteners
Others
By Application
Soft Beverage
Alcoholic Beverage
Chapter 13. Middle East and Africa Beverage Enhancer Analysis and Outlook
13.1. Middle East and Africa Beverage Enhancer Revenue (USD Million), by Segments (2021-2032)
13.1.1. Middle East and Africa Beverage Enhancer Revenue (USD Million) by Type (2021-2032)
13.1.2. Middle East and Africa Beverage Enhancer Revenue (USD Million) by Application (2021-2032)
13.1.3. Middle East and Africa Beverage Enhancer Revenue (USD Million) by Product (2021-2032)
By Type
Vitamins
Electrolytes
Anti-oxidants
Sweeteners
Others
By Application
Soft Beverage
Alcoholic Beverage
Chapter 14. Beverage Enhancer Company Profiles
14.1 Business Overview
14.2 Product Profiles
14.3 SWOT Profiles
14.5 Recent Developments
14.6 Financial Profile
List of Companies
Arizona Beverages USA
Coca-Cola Company
Cott Beverages
Gatorade Company Inc
Heartland LLC
Nestlé S.A.
Orange Crush Company
PepsiCo
Pioma Industries
Splash Corp
The Kraft Heinz Company
Wisdom Natural Brands
15. Methodology and Data Sources
15.1 Customization Offerings
15.2 Subscription Services
15.3 Related Reports
15.4 Publisher Expertise
LIST OF TABLES
Table 1 Market Segmentation Analysis
Table 2 Global Beverage Enhancer Market Share of Leading Companies, 2023
Table 3 Product Offerings of Leading Companies
Table 4 Low Growth Scenario Forecasts
Table 5 Reference Case Growth Scenario
Table 6 High Growth Case Scenario
Table 7 Global Beverage Enhancer Revenue (USD Million) And CAGR (%) By Type (2021-2032)
Table 8 Global Beverage Enhancer Revenue (USD Million) And CAGR (%) By Application (2021-2032)
Table 9 Global Beverage Enhancer Revenue (USD Million) And CAGR (%) By Product (2021-2032)
Table 10 Global Beverage Enhancer Market Revenue (USD Million) By Regions (2021-2032)
Table 11 Global Beverage Enhancer Market Share (%) By Regions (2021-2032)
Table 12 North America Beverage Enhancer Revenue (USD Million) By Country (2021-2032)
Table 13 Europe Beverage Enhancer Revenue (USD Million) By Country (2021-2032)
Table 14 Asia Pacific Beverage Enhancer Revenue (USD Million) By Country (2021-2032)
Table 15 South America Beverage Enhancer Revenue (USD Million) By Country (2021-2032)
Table 16 Middle East and Africa Beverage Enhancer Revenue (USD Million) By Region (2021-2032)
Table 17 North America Beverage Enhancer Revenue (USD Million) By Type (2021-2032)
Table 18 North America Beverage Enhancer Revenue (USD Million) By Application (2021-2032)
Table 19 North America Beverage Enhancer Revenue (USD Million) By Product (2021-2032)
Table 20 Europe Beverage Enhancer Revenue (USD Million) By Type (2021-2032)
Table 21 Europe Beverage Enhancer Revenue (USD Million) By Application (2021-2032)
Table 22 Europe Beverage Enhancer Revenue (USD Million) By Product (2021-2032)
Table 23 Asia Pacific Beverage Enhancer Revenue (USD Million) By Type (2021-2032)
Table 24 Asia Pacific Beverage Enhancer Revenue (USD Million) By Application (2021-2032)
Table 25 Asia Pacific Beverage Enhancer Revenue (USD Million) By Product (2021-2032)
Table 26 South America Beverage Enhancer Revenue (USD Million) By Type (2021-2032)
Table 27 South America Beverage Enhancer Revenue (USD Million) By Application (2021-2032)
Table 28 South America Beverage Enhancer Revenue (USD Million) By Product (2021-2032)
Table 29 Middle East and Africa Beverage Enhancer Revenue (USD Million) By Type (2021-2032)
Table 30 Middle East and Africa Beverage Enhancer Revenue (USD Million) By Application (2021-2032)
Table 31 Middle East and Africa Beverage Enhancer Revenue (USD Million) By Product (2021-2032)
LIST OF FIGURES
Figure 1. Market Scope
Figure 2. Pricing Forecasts Per Unit, 2023- 2032
Figure 3. Porter’s Five Forces
Figure 4. Global Beverage Enhancer Market Revenue (USD Million) By Regions (2021-2032)
Figure 5. Global Beverage Enhancer Market Share (%) By Regions (2023)
Figure 6. North America Beverage Enhancer Revenue (USD Million) By Country (2021-2032)
Figure 7. United States Beverage Enhancer Revenue (USD Million) By Country (2021-2032)
Figure 8. Canada Beverage Enhancer Revenue (USD Million) By Country (2021-2032)
Figure 9. Mexico Beverage Enhancer Revenue (USD Million) By Country (2021-2032)
Figure 10. Europe Beverage Enhancer Revenue (USD Million) By Country (2021-2032)
Figure 11. Germany Beverage Enhancer Revenue (USD Million) By Country (2021-2032)
Figure 12. France Beverage Enhancer Revenue (USD Million) By Country (2021-2032)
Figure 13. United Kingdom Beverage Enhancer Revenue (USD Million) By Country (2021-2032)
Figure 14. Spain Beverage Enhancer Revenue (USD Million) By Country (2021-2032)
Figure 15. Italy Beverage Enhancer Revenue (USD Million) By Country (2021-2032)
Figure 16. Russia Beverage Enhancer Revenue (USD Million) By Country (2021-2032)
Figure 17. Rest of Europe Beverage Enhancer Revenue (USD Million) By Country (2021-2032)
Figure 11. Asia Pacific Beverage Enhancer Revenue (USD Million) By Country (2021-2032)
Figure 12. China Beverage Enhancer Revenue (USD Million) By Country (2021-2032)
Figure 13. Japan Beverage Enhancer Revenue (USD Million) By Country (2021-2032)
Figure 14. India Beverage Enhancer Revenue (USD Million) By Country (2021-2032)
Figure 15. South Korea Beverage Enhancer Revenue (USD Million) By Country (2021-2032)
Figure 16. Australia Beverage Enhancer Revenue (USD Million) By Country (2021-2032)
Figure 17. South East Asia Beverage Enhancer Revenue (USD Million) By Country (2021-2032)
Figure 18. South America Beverage Enhancer Revenue (USD Million) By Country (2021-2032)
Figure 19. Brazil Beverage Enhancer Revenue (USD Million) By Country (2021-2032)
Figure 20. Argentina Beverage Enhancer Revenue (USD Million) By Country (2021-2032)
Figure 21. Rest of Asia Pacific Beverage Enhancer Revenue (USD Million) By Country (2021-2032)
Figure 22. Middle East and Africa Beverage Enhancer Revenue (USD Million) By Region (2021-2032)
Figure 23. Saudi Arabia Beverage Enhancer Revenue (USD Million) By Region (2021-2032)
Figure 24. The UAE Beverage Enhancer Revenue (USD Million) By Region (2021-2032)
Figure 25. Rest of Middle East Beverage Enhancer Revenue (USD Million) By Region (2021-2032)
Figure 26. South Africa Beverage Enhancer Revenue (USD Million) By Region (2021-2032)
Figure 27. Africa Beverage Enhancer Revenue (USD Million) By Region (2021-2032)
Figure 28. North America Beverage Enhancer Revenue (USD Million) By Type (2021-2032)
Figure 29. North America Beverage Enhancer Revenue (USD Million) By Application (2021-2032)
Figure 30. North America Beverage Enhancer Revenue (USD Million) By Product (2021-2032)
Figure 31. Europe Beverage Enhancer Revenue (USD Million) By Type (2021-2032)
Figure 32. Europe Beverage Enhancer Revenue (USD Million) By Application (2021-2032)
Figure 33. Europe Beverage Enhancer Revenue (USD Million) By Product (2021-2032)
Figure 34. Asia Pacific Beverage Enhancer Revenue (USD Million) By Type (2021-2032)
Figure 35. Asia Pacific Beverage Enhancer Revenue (USD Million) By Application (2021-2032)
Figure 36. Asia Pacific Beverage Enhancer Revenue (USD Million) By Product (2021-2032)
Figure 37. South America Beverage Enhancer Revenue (USD Million) By Type (2021-2032)
Figure 38. South America Beverage Enhancer Revenue (USD Million) By Application (2021-2032)
Figure 39. South America Beverage Enhancer Revenue (USD Million) By Product (2021-2032)
Figure 40. Middle East and Africa Beverage Enhancer Revenue (USD Million) By Type (2021-2032)
Figure 41. Middle East and Africa Beverage Enhancer Revenue (USD Million) By Application (2021-2032)
Figure 42. Middle East and Africa Beverage Enhancer Revenue (USD Million) By Product (2021-2032)
By Type
Vitamins
Electrolytes
Anti-oxidants
Sweeteners
Others
By Application
Soft Beverage
Alcoholic Beverage
Countries Analyzed
North America (US, Canada, Mexico)
Europe (Germany, UK, France, Spain, Italy, Russia, Rest of Europe)
Asia Pacific (China, India, Japan, South Korea, Australia, South East Asia, Rest of Asia)
South America (Brazil, Argentina, Rest of South America)
Middle East and Africa (Saudi Arabia, UAE, Rest of Middle East, South Africa, Egypt, Rest of Africa)
