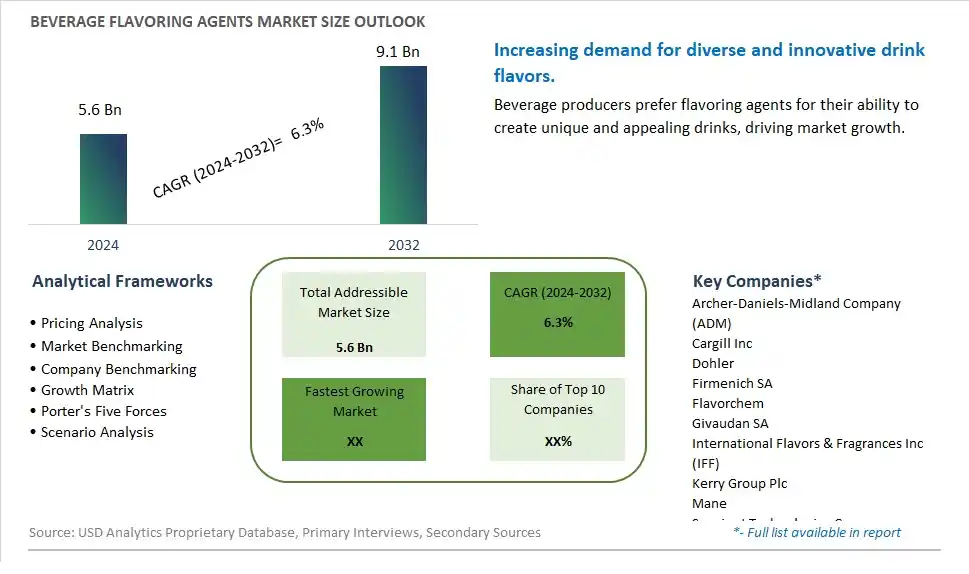
Global Beverage Flavoring Agents Market Size is valued at $5.6 Billion in 2024 and is forecast to register a growth rate (CAGR) of 6.3% to reach $9.1 Billion by 2032.
The global Beverage Flavoring Agents Market Comprehensive Study analyzes and forecasts the market size across 6 regions and 24 countries for diverse segments -By Type (Natural, Artificial), By Application (Alcoholic, Non-alcoholic)
An Introduction to Beverage Flavoring Agents Market
In 2024, the Beverage Flavoring Agents market is experiencing significant growth, driven by the increasing demand for diverse and innovative beverage flavors. Beverage flavoring agents, which include natural and artificial flavorings, are essential for enhancing the taste and appeal of a wide range of drinks, from soft drinks and juices to alcoholic beverages and functional drinks. The market is supported by the growing trend towards clean-label and natural ingredients, as well as the rising popularity of exotic and custom flavors. Advances in flavor extraction and formulation technologies are improving the intensity, stability, and versatility of beverage flavoring agents, catering to evolving consumer preferences and market demands.
Beverage Flavoring Agents Competitive Landscape
The market report analyses the leading companies in the industry including Archer-Daniels-Midland Company (ADM), Cargill Inc, Dohler, Firmenich SA, Flavorchem, Givaudan SA, International Flavors & Fragrances Inc (IFF), Kerry Group Plc, Mane, Sensient Technologies Corp, Tate & Lyle Plc, and Others.
Beverage Flavoring Agents Market Dynamics
Beverage Flavoring Agents Market Trend: Shift Towards Natural and Authentic Flavors
The most prominent market trend for Beverage Flavoring Agents is the shift towards natural and authentic flavors. Consumers are increasingly preferring beverages with natural and recognizable flavor profiles, avoiding artificial additives and flavors. Beverage flavoring agents derived from natural sources, such as fruits, herbs, spices, and botanical extracts, are gaining popularity as they offer authentic taste experiences and align with clean label preferences. This trend reflects a broader consumer demand for transparency, quality, and sensory satisfaction in beverages, driving the adoption of natural flavoring agents in the market.
Beverage Flavoring Agents Market Driver: Innovation in Flavor Profiles and Beverage Customization
A key market driver for Beverage Flavoring Agents is the innovation in flavor profiles and beverage customization. Beverage manufacturers and flavor companies are continuously innovating to create unique and appealing flavor combinations that resonate with consumer preferences and trends. The ability to customize beverages with a wide range of flavoring agents allows for product differentiation, brand loyalty, and meeting diverse consumer tastes. The driver of innovation in flavor profiles and customization propels the demand for beverage flavoring agents as essential components in creating enticing and marketable beverage offerings.
Beverage Flavoring Agents Market Opportunity: Development of Functional and Health-Boosting Flavoring Agents
A potential opportunity within the Beverage Flavoring Agents market lies in the development of functional and health-boosting flavoring agents. Collaborating with food scientists, nutritionists, and wellness experts can lead to the creation of flavoring agents that not only enhance taste but also offer functional benefits, such as immune support, energy enhancement, mood upliftment, and digestive wellness. Additionally, exploring opportunities in natural sweeteners, flavor enhancers derived from superfoods, and sugar reduction solutions can cater to the growing demand for healthier and better-for-you beverage options. By focusing on the development of functional and health-boosting flavoring agents, there are opportunities to innovate, address consumer needs, and gain a competitive edge in the dynamic beverage flavoring market.
Beverage Flavoring Agents Market Share Analysis: Artificial Flavoring Agents segment generated the highest revenue share in the industry
The largest segment in the Beverage Flavoring Agents Market is Artificial Flavoring Agents. Artificial flavoring agents are synthetic compounds designed to mimic natural flavors and enhance the taste and aroma of beverages. Among artificial flavoring agents, one sub-category experiencing fast growth is Sweeteners. Sweeteners are additives that provide a sweet taste to beverages without the calories associated with sugar, making them attractive to health-conscious consumers and those managing conditions like diabetes. The rapid growth of artificial sweeteners can be attributed to the increasing demand for low-calorie and sugar-free options in the market. Consumers are actively seeking healthier alternatives without compromising on taste, which has led manufacturers to innovate and incorporate various artificial sweeteners like aspartame, sucralose, and saccharin into their beverage formulations. Additionally, the growing awareness of the adverse effects of excessive sugar consumption has further propelled the demand for artificial sweeteners, contributing significantly to the growth of this segment within the Beverage Flavoring Agents Market.
Beverage Flavoring Agents Market Share Analysis: Non-alcoholic Beverages is the fastest growing segment over the forecast period to 2032
The Non-alcoholic Beverages segment within the Beverage Flavoring Agents Market is anticipated to be the fastest growing up to 2032. One sub-category experiencing rapid growth within non-alcoholic beverages is Functional Beverages. Functional beverages are those infused with additional nutrients, herbs, or other ingredients to offer specific health benefits beyond basic hydration. This segment is witnessing accelerated growth due to shifting consumer preferences towards healthier beverage options. With a growing emphasis on health and wellness, consumers are increasingly seeking beverages that provide functional benefits such as energy enhancement, immune support, digestive health, and mental clarity. Functional beverages are gaining popularity among diverse demographics, including millennials and health-conscious individuals, who prioritize products that align with their active lifestyles and well-being goals. Further, advancements in beverage formulation and innovation are enabling manufacturers to create unique functional beverages, driving the growth of this segment within the Beverage Flavoring Agents Market.
Beverage Flavoring Agents Market Segmentation
By Type
Natural
Artificial
By Application
Alcoholic
Non-alcoholic
Countries Analyzed
North America (US, Canada, Mexico)
Europe (Germany, UK, France, Spain, Italy, Russia, Rest of Europe)
Asia Pacific (China, India, Japan, South Korea, Australia, South East Asia, Rest of Asia)
South America (Brazil, Argentina, Rest of South America)
Middle East and Africa (Saudi Arabia, UAE, Rest of Middle East, South Africa, Egypt, Rest of Africa)
Beverage Flavoring Agents Companies Profiled in the Study
Archer-Daniels-Midland Company (ADM)
Cargill Inc
Dohler
Firmenich SA
Flavorchem
Givaudan SA
International Flavors & Fragrances Inc (IFF)
Kerry Group Plc
Mane
Sensient Technologies Corp
Tate & Lyle Plc
*- List Not Exhaustive
Chapter 1. TABLE OF CONTENTS
Chapter 2. Introduction to Beverage Flavoring Agents Market
2.1. Market Overview
2.2. Key Statistics and Report Highlights
2.3. Scope of the Comprehensive Study
2.3.1. Market Definition
2.3.2 Countries and Regions Covered
2.3.3 Research Objective
2.3.4 Units, Currency, and Conversions
2.3.5 Industry Value Chain
2.4. Key Market Segments
2.5. Key Companies
2.6. Study Period
Chapter 3. Strategic Analysis Review
3.1. Beverage Flavoring Agents Pricing Analysis and Forecast
3.2. Porter’s Five Forces
3.3. Market Ecosystem
3.4. SWOT Analysis
3.5. Regulatory Scenario
3.3. Effects of Inflation, Russia-Ukraine War, moderating economic growth, and other macroeconomic factors
Chapter 4. Competitive Landscape
4.1. Market Share Analysis
4.1.1. Global Beverage Flavoring Agents Market Share by Company, 2023
4.1.2. Product Offerings of Leading Beverage Flavoring Agents Companies
4.2. Market Entropy
4.2.1. New Product Launches in the Industry
4.2.2. Mergers, Acquisitions, Joint ventures, and Partnerships
4.3. Key Strategies and Best Practices
Chapter 5. Global Market Projections: Best, Reference, and Low Case Scenarios
5.1. Growth Analysis- Case Scenario Definitions
5.2. Low Growth Case Scenario Forecasts
5.3. Reference Growth Case Scenario Forecasts
5.4. High Growth Case Scenario Forecasts
Chapter 6. Market Dynamics
6.1. Beverage Flavoring Agents Market Drivers
6.2. Beverage Flavoring Agents Market Challenges
6.6. Beverage Flavoring Agents Market Opportunities
6.4. Beverage Flavoring Agents Market Trends
Chapter 7. Global Beverage Flavoring Agents Market Outlook Trends
7.1. Global Beverage Flavoring Agents Revenue (USD Million) and CAGR (%) by Type (2021-2032)
7.2. Global Beverage Flavoring Agents Revenue (USD Million) and CAGR (%) by Application (2021-2032)
7.3. Global Beverage Flavoring Agents Revenue (USD Million) and CAGR (%) by Product (2021-2032)
By Type
Natural
Artificial
By Application
Alcoholic
Non-alcoholic
Chapter 8. Global Beverage Flavoring Agents Regional Analysis and Outlook
8.1. Global Beverage Flavoring Agents Revenue (USD Million) By Regions (2021- 2032)
8.2. North America Beverage Flavoring Agents Revenue (USD Million) by Country (2021-2032)
8.2.1. United States Beverage Flavoring Agents Regional Analysis and Outlook
8.2.2. Canada Beverage Flavoring Agents Regional Analysis and Outlook
8.2.3. Mexico Beverage Flavoring Agents Regional Analysis and Outlook
8.3. Europe Beverage Flavoring Agents Revenue (USD Million), by Country (2021-2032)
8.3.1. Germany Beverage Flavoring Agents Regional Analysis and Outlook
8.3.2. France Beverage Flavoring Agents Regional Analysis and Outlook
8.3.3. United Kingdom Beverage Flavoring Agents Regional Analysis and Outlook
8.3.4. Spain Beverage Flavoring Agents Regional Analysis and Outlook
8.3.5. Italy Beverage Flavoring Agents Regional Analysis and Outlook
8.3.6. Russia Beverage Flavoring Agents Regional Analysis and Outlook
8.3.7. Rest of Europe Beverage Flavoring Agents Regional Analysis and Outlook
8.4. Asia Pacific Beverage Flavoring Agents Revenue (USD Million) by Country (2021-2032)
8.4.1. China Beverage Flavoring Agents Regional Analysis and Outlook
8.4.2. Japan Beverage Flavoring Agents Regional Analysis and Outlook
8.4.3. India Beverage Flavoring Agents Regional Analysis and Outlook
8.4.4. South Korea Beverage Flavoring Agents Regional Analysis and Outlook
8.4.5. Australia Beverage Flavoring Agents Regional Analysis and Outlook
8.4.6. South East Asia Beverage Flavoring Agents Regional Analysis and Outlook
8.4.7. Rest of Asia Pacific Beverage Flavoring Agents Regional Analysis and Outlook
8.5. South America Beverage Flavoring Agents Revenue (USD Million), by Country (2021-2032)
8.5.1. Brazil Beverage Flavoring Agents Regional Analysis and Outlook
8.5.2. Argentina Beverage Flavoring Agents Regional Analysis and Outlook
8.5.3. Rest of South America Beverage Flavoring Agents Regional Analysis and Outlook
8.6. Middle East and Africa Beverage Flavoring Agents Revenue (USD Million) by Country (2021-2032)
8.6.1. Middle East Beverage Flavoring Agents Regional Analysis and Outlook
8.6.2. Africa Beverage Flavoring Agents Regional Analysis and Outlook
Chapter 9. North America Beverage Flavoring Agents Analysis and Outlook
9.1. North America Beverage Flavoring Agents Revenue (USD Million) by Segments (2021-2032)
9.1.1. North America Beverage Flavoring Agents Revenue (USD Million) by Type (2021-2032)
9.1.2. North America Beverage Flavoring Agents Revenue (USD Million) by Application (2021-2032)
9.1.3. North America Beverage Flavoring Agents Revenue (USD Million) by Product (2021-2032)
By Type
Natural
Artificial
By Application
Alcoholic
Non-alcoholic
Chapter 10. Europe Beverage Flavoring Agents Analysis and Outlook
10.1. Europe Beverage Flavoring Agents Revenue (USD Million), by Segments (USD Million) (2021-2032)
10.1.1. Europe Beverage Flavoring Agents Revenue (USD Million) by Type (2021-2032)
10.1.2. Europe Beverage Flavoring Agents Revenue (USD Million) by Application (2021-2032)
10.1.3. Europe Beverage Flavoring Agents Revenue (USD Million) by Product (2021-2032)
By Type
Natural
Artificial
By Application
Alcoholic
Non-alcoholic
Chapter 11. Asia Pacific Beverage Flavoring Agents Analysis and Outlook
11.1. Asia Pacific Beverage Flavoring Agents Revenue (USD Million), and Revenue (USD Million) by Segments (2021-2032)
11.1.1. Asia Pacific Beverage Flavoring Agents Revenue (USD Million) by Type (2021-2032)
11.1.2. Asia Pacific Beverage Flavoring Agents Revenue (USD Million) by Application (2021-2032)
11.1.3. Asia Pacific Beverage Flavoring Agents Revenue (USD Million) by Product (2021-2032)
By Type
Natural
Artificial
By Application
Alcoholic
Non-alcoholic
Chapter 12. South America Beverage Flavoring Agents Analysis and Outlook
12.1. South America Beverage Flavoring Agents Revenue (USD Million), by Segments (2021-2032)
12.1.1. South America Beverage Flavoring Agents Revenue (USD Million) by Type (2021-2032)
12.1.2. South America Beverage Flavoring Agents Revenue (USD Million) by Application (2021-2032)
12.1.3. South America Beverage Flavoring Agents Revenue (USD Million) by Product (2021-2032)
By Type
Natural
Artificial
By Application
Alcoholic
Non-alcoholic
Chapter 13. Middle East and Africa Beverage Flavoring Agents Analysis and Outlook
13.1. Middle East and Africa Beverage Flavoring Agents Revenue (USD Million), by Segments (2021-2032)
13.1.1. Middle East and Africa Beverage Flavoring Agents Revenue (USD Million) by Type (2021-2032)
13.1.2. Middle East and Africa Beverage Flavoring Agents Revenue (USD Million) by Application (2021-2032)
13.1.3. Middle East and Africa Beverage Flavoring Agents Revenue (USD Million) by Product (2021-2032)
By Type
Natural
Artificial
By Application
Alcoholic
Non-alcoholic
Chapter 14. Beverage Flavoring Agents Company Profiles
14.1 Business Overview
14.2 Product Profiles
14.3 SWOT Profiles
14.5 Recent Developments
14.6 Financial Profile
List of Companies
Archer-Daniels-Midland Company (ADM)
Cargill Inc
Dohler
Firmenich SA
Flavorchem
Givaudan SA
International Flavors & Fragrances Inc (IFF)
Kerry Group Plc
Mane
Sensient Technologies Corp
Tate & Lyle Plc
15. Methodology and Data Sources
15.1 Customization Offerings
15.2 Subscription Services
15.3 Related Reports
15.4 Publisher Expertise
LIST OF TABLES
Table 1 Market Segmentation Analysis
Table 2 Global Beverage Flavoring Agents Market Share of Leading Companies, 2023
Table 3 Product Offerings of Leading Companies
Table 4 Low Growth Scenario Forecasts
Table 5 Reference Case Growth Scenario
Table 6 High Growth Case Scenario
Table 7 Global Beverage Flavoring Agents Revenue (USD Million) And CAGR (%) By Type (2021-2032)
Table 8 Global Beverage Flavoring Agents Revenue (USD Million) And CAGR (%) By Application (2021-2032)
Table 9 Global Beverage Flavoring Agents Revenue (USD Million) And CAGR (%) By Product (2021-2032)
Table 10 Global Beverage Flavoring Agents Market Revenue (USD Million) By Regions (2021-2032)
Table 11 Global Beverage Flavoring Agents Market Share (%) By Regions (2021-2032)
Table 12 North America Beverage Flavoring Agents Revenue (USD Million) By Country (2021-2032)
Table 13 Europe Beverage Flavoring Agents Revenue (USD Million) By Country (2021-2032)
Table 14 Asia Pacific Beverage Flavoring Agents Revenue (USD Million) By Country (2021-2032)
Table 15 South America Beverage Flavoring Agents Revenue (USD Million) By Country (2021-2032)
Table 16 Middle East and Africa Beverage Flavoring Agents Revenue (USD Million) By Region (2021-2032)
Table 17 North America Beverage Flavoring Agents Revenue (USD Million) By Type (2021-2032)
Table 18 North America Beverage Flavoring Agents Revenue (USD Million) By Application (2021-2032)
Table 19 North America Beverage Flavoring Agents Revenue (USD Million) By Product (2021-2032)
Table 20 Europe Beverage Flavoring Agents Revenue (USD Million) By Type (2021-2032)
Table 21 Europe Beverage Flavoring Agents Revenue (USD Million) By Application (2021-2032)
Table 22 Europe Beverage Flavoring Agents Revenue (USD Million) By Product (2021-2032)
Table 23 Asia Pacific Beverage Flavoring Agents Revenue (USD Million) By Type (2021-2032)
Table 24 Asia Pacific Beverage Flavoring Agents Revenue (USD Million) By Application (2021-2032)
Table 25 Asia Pacific Beverage Flavoring Agents Revenue (USD Million) By Product (2021-2032)
Table 26 South America Beverage Flavoring Agents Revenue (USD Million) By Type (2021-2032)
Table 27 South America Beverage Flavoring Agents Revenue (USD Million) By Application (2021-2032)
Table 28 South America Beverage Flavoring Agents Revenue (USD Million) By Product (2021-2032)
Table 29 Middle East and Africa Beverage Flavoring Agents Revenue (USD Million) By Type (2021-2032)
Table 30 Middle East and Africa Beverage Flavoring Agents Revenue (USD Million) By Application (2021-2032)
Table 31 Middle East and Africa Beverage Flavoring Agents Revenue (USD Million) By Product (2021-2032)
LIST OF FIGURES
Figure 1. Market Scope
Figure 2. Pricing Forecasts Per Unit, 2023- 2032
Figure 3. Porter’s Five Forces
Figure 4. Global Beverage Flavoring Agents Market Revenue (USD Million) By Regions (2021-2032)
Figure 5. Global Beverage Flavoring Agents Market Share (%) By Regions (2023)
Figure 6. North America Beverage Flavoring Agents Revenue (USD Million) By Country (2021-2032)
Figure 7. United States Beverage Flavoring Agents Revenue (USD Million) By Country (2021-2032)
Figure 8. Canada Beverage Flavoring Agents Revenue (USD Million) By Country (2021-2032)
Figure 9. Mexico Beverage Flavoring Agents Revenue (USD Million) By Country (2021-2032)
Figure 10. Europe Beverage Flavoring Agents Revenue (USD Million) By Country (2021-2032)
Figure 11. Germany Beverage Flavoring Agents Revenue (USD Million) By Country (2021-2032)
Figure 12. France Beverage Flavoring Agents Revenue (USD Million) By Country (2021-2032)
Figure 13. United Kingdom Beverage Flavoring Agents Revenue (USD Million) By Country (2021-2032)
Figure 14. Spain Beverage Flavoring Agents Revenue (USD Million) By Country (2021-2032)
Figure 15. Italy Beverage Flavoring Agents Revenue (USD Million) By Country (2021-2032)
Figure 16. Russia Beverage Flavoring Agents Revenue (USD Million) By Country (2021-2032)
Figure 17. Rest of Europe Beverage Flavoring Agents Revenue (USD Million) By Country (2021-2032)
Figure 11. Asia Pacific Beverage Flavoring Agents Revenue (USD Million) By Country (2021-2032)
Figure 12. China Beverage Flavoring Agents Revenue (USD Million) By Country (2021-2032)
Figure 13. Japan Beverage Flavoring Agents Revenue (USD Million) By Country (2021-2032)
Figure 14. India Beverage Flavoring Agents Revenue (USD Million) By Country (2021-2032)
Figure 15. South Korea Beverage Flavoring Agents Revenue (USD Million) By Country (2021-2032)
Figure 16. Australia Beverage Flavoring Agents Revenue (USD Million) By Country (2021-2032)
Figure 17. South East Asia Beverage Flavoring Agents Revenue (USD Million) By Country (2021-2032)
Figure 18. South America Beverage Flavoring Agents Revenue (USD Million) By Country (2021-2032)
Figure 19. Brazil Beverage Flavoring Agents Revenue (USD Million) By Country (2021-2032)
Figure 20. Argentina Beverage Flavoring Agents Revenue (USD Million) By Country (2021-2032)
Figure 21. Rest of Asia Pacific Beverage Flavoring Agents Revenue (USD Million) By Country (2021-2032)
Figure 22. Middle East and Africa Beverage Flavoring Agents Revenue (USD Million) By Region (2021-2032)
Figure 23. Saudi Arabia Beverage Flavoring Agents Revenue (USD Million) By Region (2021-2032)
Figure 24. The UAE Beverage Flavoring Agents Revenue (USD Million) By Region (2021-2032)
Figure 25. Rest of Middle East Beverage Flavoring Agents Revenue (USD Million) By Region (2021-2032)
Figure 26. South Africa Beverage Flavoring Agents Revenue (USD Million) By Region (2021-2032)
Figure 27. Africa Beverage Flavoring Agents Revenue (USD Million) By Region (2021-2032)
Figure 28. North America Beverage Flavoring Agents Revenue (USD Million) By Type (2021-2032)
Figure 29. North America Beverage Flavoring Agents Revenue (USD Million) By Application (2021-2032)
Figure 30. North America Beverage Flavoring Agents Revenue (USD Million) By Product (2021-2032)
Figure 31. Europe Beverage Flavoring Agents Revenue (USD Million) By Type (2021-2032)
Figure 32. Europe Beverage Flavoring Agents Revenue (USD Million) By Application (2021-2032)
Figure 33. Europe Beverage Flavoring Agents Revenue (USD Million) By Product (2021-2032)
Figure 34. Asia Pacific Beverage Flavoring Agents Revenue (USD Million) By Type (2021-2032)
Figure 35. Asia Pacific Beverage Flavoring Agents Revenue (USD Million) By Application (2021-2032)
Figure 36. Asia Pacific Beverage Flavoring Agents Revenue (USD Million) By Product (2021-2032)
Figure 37. South America Beverage Flavoring Agents Revenue (USD Million) By Type (2021-2032)
Figure 38. South America Beverage Flavoring Agents Revenue (USD Million) By Application (2021-2032)
Figure 39. South America Beverage Flavoring Agents Revenue (USD Million) By Product (2021-2032)
Figure 40. Middle East and Africa Beverage Flavoring Agents Revenue (USD Million) By Type (2021-2032)
Figure 41. Middle East and Africa Beverage Flavoring Agents Revenue (USD Million) By Application (2021-2032)
Figure 42. Middle East and Africa Beverage Flavoring Agents Revenue (USD Million) By Product (2021-2032)
By Type
Natural
Artificial
By Application
Alcoholic
Non-alcoholic
Countries Analyzed
North America (US, Canada, Mexico)
Europe (Germany, UK, France, Spain, Italy, Russia, Rest of Europe)
Asia Pacific (China, India, Japan, South Korea, Australia, South East Asia, Rest of Asia)
South America (Brazil, Argentina, Rest of South America)
Middle East and Africa (Saudi Arabia, UAE, Rest of Middle East, South Africa, Egypt, Rest of Africa)
