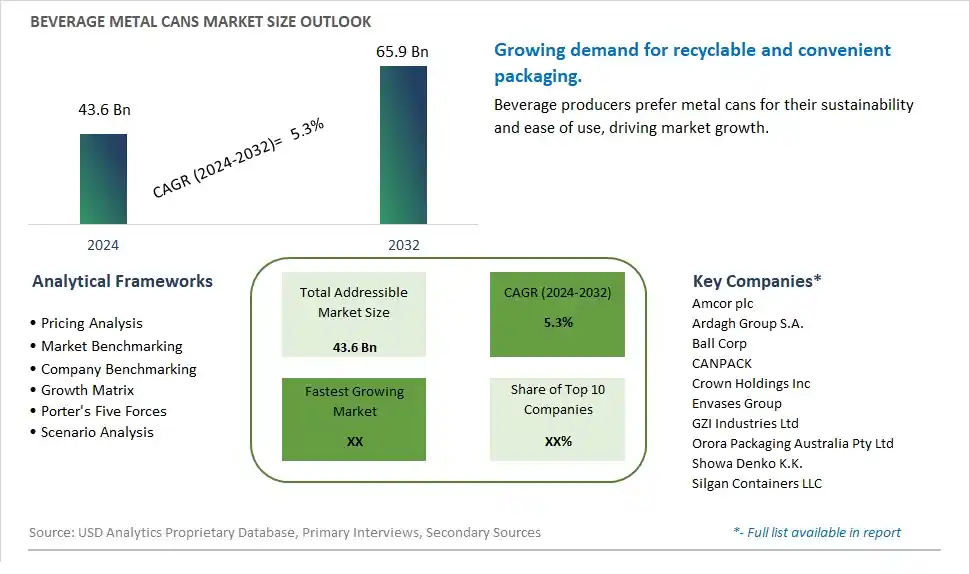
Global Beverage Metal Cans Market Size is valued at $43.6 Billion in 2024 and is forecast to register a growth rate (CAGR) of 5.3% to reach $65.9 Billion by 2032.
The global Beverage Metal Cans Market Comprehensive Study analyzes and forecasts the market size across 6 regions and 24 countries for diverse segments -By Material (Aluminum, Steel, Tin), By Beverage (Alcoholic, Non-Alcoholic), By Capacity (Up to 5oz, 6oz to 10oz, 11oz to 15oz, Above 15oz)
An Introduction to Beverage Metal Cans Market
In 2024, the Beverage Metal Cans market is witnessing robust growth, driven by the increasing demand for sustainable and convenient packaging solutions. Metal cans are favored for their durability, recyclability, and ability to preserve the flavor and carbonation of beverages. The market is supported by the rising popularity of canned beverages, including soft drinks, energy drinks, craft beers, and sparkling waters. Advances in can design and manufacturing technologies are improving the efficiency, aesthetics, and functionality of metal cans. The market is also benefiting from the trend towards environmentally friendly packaging, as consumers and companies alike prioritize sustainability and waste reduction.
Beverage Metal Cans Competitive Landscape
The market report analyses the leading companies in the industry including Amcor plc, Ardagh Group S.A., Ball Corp, CANPACK, Crown Holdings Inc, Envases Group, GZI Industries Ltd, Orora Packaging Australia Pty Ltd, Showa Denko K.K., Silgan Containers LLC, and Others.
Beverage Metal Cans Market Dynamics
Beverage Metal Cans Market Trend: Preference for Sustainable Packaging Solutions
The most prominent market trend for Beverage Metal Cans is the growing preference for sustainable packaging solutions. With increasing awareness of environmental issues and the importance of eco-friendly practices, consumers are gravitating towards beverage packaging that is recyclable, reusable, and has a lower environmental impact. Metal cans, being highly recyclable and possessing excellent barrier properties, are gaining favor as sustainable packaging options for various beverages, including carbonated drinks, energy drinks, ready-to-drink teas, and alcoholic beverages. This trend reflects a broader shift towards sustainability in the packaging industry, driving the demand for beverage metal cans as an eco-conscious choice.
Beverage Metal Cans Market Driver: Demand for Convenience, Portability, and Brand Differentiation
A key market driver for Beverage Metal Cans is the demand for convenience, portability, and brand differentiation. Metal cans offer convenience in terms of storage, transportation, and consumption, making them popular choices for on-the-go beverages. Additionally, the ability to customize can designs, sizes, and printing options allows brands to differentiate their products, create eye-catching packaging, and enhance brand visibility on store shelves. The driver of convenience, portability, and brand differentiation fuels the adoption of beverage metal cans as preferred packaging solutions across various beverage categories.
Beverage Metal Cans Market Opportunity: Innovation in Functional and Sustainable Can Designs
A potential opportunity within the Beverage Metal Cans market lies in innovation in functional and sustainable can designs. Collaborating with packaging experts and leveraging advanced technologies can lead to the development of metal cans with enhanced features, such as easy-open tabs, resealable lids, ergonomic shapes, and improved recyclability. Furthermore, focusing on sustainable practices throughout the can manufacturing process, including using recycled materials, reducing carbon footprint, and implementing energy-efficient production methods, can appeal to environmentally conscious consumers and contribute to a positive brand image. By focusing on innovation in functional and sustainable can designs, there are opportunities to meet consumer needs, drive product differentiation, and capture market share in the dynamic beverage packaging industry.
Beverage Metal Cans Market Share Analysis: Aluminium segment generated the highest revenue share in the industry
In the Beverage Metal Cans Market, the largest segment is Aluminium. Aluminium cans have gained significant popularity in the beverage packaging industry due to several factors. Firstly, aluminium is lightweight yet durable, making it ideal for packaging and transportation while reducing overall shipping costs. Additionally, aluminium cans offer excellent protection against light, oxygen, and moisture, ensuring the freshness and quality of beverages for extended periods. The recyclability of aluminium is another key advantage, as it promotes sustainability and environmental responsibility, aligning with the growing consumer demand for eco-friendly packaging solutions. Furthermore, aluminium cans are versatile and can be easily customized with various printing techniques, labels, and coatings to enhance branding and consumer appeal. These factors contribute to the dominance of aluminium as the largest segment in the Beverage Metal Cans Market, with continuous growth expected as the beverage industry continues to evolve.
Beverage Metal Cans Market Share Analysis: Non-Alcoholic Beverages is the fastest growing segment over the forecast period to 2032
Within the Beverage Metal Cans Market, the Non-Alcoholic Beverages segment is poised to be the fastest growing up to 2032. One sub-category experiencing rapid growth within non-alcoholic beverages is Ready-to-Drink (RTD) Beverages. RTD beverages include a wide range of non-alcoholic drinks such as energy drinks, iced tea, coffee, and fruit juices that are conveniently packaged in metal cans for on-the-go consumption. The fast growth of this segment can be attributed to shifting consumer preferences towards convenient and portable beverage options, especially among busy urban populations and millennials. RTD beverages offer convenience, freshness, and a variety of flavors, making them popular choices for consumers seeking quick refreshment without compromising on taste or quality. Furthermore, the increasing focus on health and wellness has led to the development of healthier RTD beverage options, such as low-sugar or sugar-free variants, driving additional growth in this segment. As a result, the Non-Alcoholic Beverages segment, particularly the RTD sub-category, is expected to experience significant growth in the Beverage Metal Cans Market through 2032.
Beverage Metal Cans Market Share Analysis: Above 15oz segment generated the highest revenue share in the industry
In the Beverage Metal Cans Market, the largest segment based on capacity is "Above 15oz." This segment includes larger-sized metal cans used for packaging beverages such as energy drinks, juices, and ready-to-drink teas in bulk quantities. The fast growth of this segment can be attributed to several factors. Firstly, the trend towards bulk purchasing and consumption, especially among households and businesses, has driven the demand for larger-sized cans that offer cost-effective packaging solutions. Additionally, the popularity of family-sized beverages and multipacks in retail outlets has further fueled the growth of the above 15oz segment. Furthermore, advancements in can manufacturing technologies have enabled the production of larger cans with improved durability, preservation properties, and branding capabilities, making them attractive to both manufacturers and consumers. As a result, the Above 15oz segment continues to dominate the Beverage Metal Cans Market, with sustained growth expected in the coming years.
Beverage Metal Cans Market Segmentation
By Material
Aluminum
Steel
Tin
By Beverage
Alcoholic
Non-Alcoholic
By Capacity
Up to 5oz
6oz to 10oz
11oz to 15oz
Above 15oz
Countries Analyzed
North America (US, Canada, Mexico)
Europe (Germany, UK, France, Spain, Italy, Russia, Rest of Europe)
Asia Pacific (China, India, Japan, South Korea, Australia, South East Asia, Rest of Asia)
South America (Brazil, Argentina, Rest of South America)
Middle East and Africa (Saudi Arabia, UAE, Rest of Middle East, South Africa, Egypt, Rest of Africa)
Beverage Metal Cans Companies Profiled in the Study
Amcor plc
Ardagh Group S.A.
Ball Corp
CANPACK
Crown Holdings Inc
Envases Group
GZI Industries Ltd
Orora Packaging Australia Pty Ltd
Showa Denko K.K.
Silgan Containers LLC
*- List Not Exhaustive
Chapter 1. TABLE OF CONTENTS
Chapter 2. Introduction to Beverage Metal Cans Market
2.1. Market Overview
2.2. Key Statistics and Report Highlights
2.3. Scope of the Comprehensive Study
2.3.1. Market Definition
2.3.2 Countries and Regions Covered
2.3.3 Research Objective
2.3.4 Units, Currency, and Conversions
2.3.5 Industry Value Chain
2.4. Key Market Segments
2.5. Key Companies
2.6. Study Period
Chapter 3. Strategic Analysis Review
3.1. Beverage Metal Cans Pricing Analysis and Forecast
3.2. Porter’s Five Forces
3.3. Market Ecosystem
3.4. SWOT Analysis
3.5. Regulatory Scenario
3.3. Effects of Inflation, Russia-Ukraine War, moderating economic growth, and other macroeconomic factors
Chapter 4. Competitive Landscape
4.1. Market Share Analysis
4.1.1. Global Beverage Metal Cans Market Share by Company, 2023
4.1.2. Product Offerings of Leading Beverage Metal Cans Companies
4.2. Market Entropy
4.2.1. New Product Launches in the Industry
4.2.2. Mergers, Acquisitions, Joint ventures, and Partnerships
4.3. Key Strategies and Best Practices
Chapter 5. Global Market Projections: Best, Reference, and Low Case Scenarios
5.1. Growth Analysis- Case Scenario Definitions
5.2. Low Growth Case Scenario Forecasts
5.3. Reference Growth Case Scenario Forecasts
5.4. High Growth Case Scenario Forecasts
Chapter 6. Market Dynamics
6.1. Beverage Metal Cans Market Drivers
6.2. Beverage Metal Cans Market Challenges
6.6. Beverage Metal Cans Market Opportunities
6.4. Beverage Metal Cans Market Trends
Chapter 7. Global Beverage Metal Cans Market Outlook Trends
7.1. Global Beverage Metal Cans Revenue (USD Million) and CAGR (%) by Type (2021-2032)
7.2. Global Beverage Metal Cans Revenue (USD Million) and CAGR (%) by Application (2021-2032)
7.3. Global Beverage Metal Cans Revenue (USD Million) and CAGR (%) by Product (2021-2032)
By Material
Aluminum
Steel
Tin
By Beverage
Alcoholic
Non-Alcoholic
By Capacity
Up to 5oz
6oz to 10oz
11oz to 15oz
Above 15oz
Chapter 8. Global Beverage Metal Cans Regional Analysis and Outlook
8.1. Global Beverage Metal Cans Revenue (USD Million) By Regions (2021- 2032)
8.2. North America Beverage Metal Cans Revenue (USD Million) by Country (2021-2032)
8.2.1. United States Beverage Metal Cans Regional Analysis and Outlook
8.2.2. Canada Beverage Metal Cans Regional Analysis and Outlook
8.2.3. Mexico Beverage Metal Cans Regional Analysis and Outlook
8.3. Europe Beverage Metal Cans Revenue (USD Million), by Country (2021-2032)
8.3.1. Germany Beverage Metal Cans Regional Analysis and Outlook
8.3.2. France Beverage Metal Cans Regional Analysis and Outlook
8.3.3. United Kingdom Beverage Metal Cans Regional Analysis and Outlook
8.3.4. Spain Beverage Metal Cans Regional Analysis and Outlook
8.3.5. Italy Beverage Metal Cans Regional Analysis and Outlook
8.3.6. Russia Beverage Metal Cans Regional Analysis and Outlook
8.3.7. Rest of Europe Beverage Metal Cans Regional Analysis and Outlook
8.4. Asia Pacific Beverage Metal Cans Revenue (USD Million) by Country (2021-2032)
8.4.1. China Beverage Metal Cans Regional Analysis and Outlook
8.4.2. Japan Beverage Metal Cans Regional Analysis and Outlook
8.4.3. India Beverage Metal Cans Regional Analysis and Outlook
8.4.4. South Korea Beverage Metal Cans Regional Analysis and Outlook
8.4.5. Australia Beverage Metal Cans Regional Analysis and Outlook
8.4.6. South East Asia Beverage Metal Cans Regional Analysis and Outlook
8.4.7. Rest of Asia Pacific Beverage Metal Cans Regional Analysis and Outlook
8.5. South America Beverage Metal Cans Revenue (USD Million), by Country (2021-2032)
8.5.1. Brazil Beverage Metal Cans Regional Analysis and Outlook
8.5.2. Argentina Beverage Metal Cans Regional Analysis and Outlook
8.5.3. Rest of South America Beverage Metal Cans Regional Analysis and Outlook
8.6. Middle East and Africa Beverage Metal Cans Revenue (USD Million) by Country (2021-2032)
8.6.1. Middle East Beverage Metal Cans Regional Analysis and Outlook
8.6.2. Africa Beverage Metal Cans Regional Analysis and Outlook
Chapter 9. North America Beverage Metal Cans Analysis and Outlook
9.1. North America Beverage Metal Cans Revenue (USD Million) by Segments (2021-2032)
9.1.1. North America Beverage Metal Cans Revenue (USD Million) by Type (2021-2032)
9.1.2. North America Beverage Metal Cans Revenue (USD Million) by Application (2021-2032)
9.1.3. North America Beverage Metal Cans Revenue (USD Million) by Product (2021-2032)
By Material
Aluminum
Steel
Tin
By Beverage
Alcoholic
Non-Alcoholic
By Capacity
Up to 5oz
6oz to 10oz
11oz to 15oz
Above 15oz
Chapter 10. Europe Beverage Metal Cans Analysis and Outlook
10.1. Europe Beverage Metal Cans Revenue (USD Million), by Segments (USD Million) (2021-2032)
10.1.1. Europe Beverage Metal Cans Revenue (USD Million) by Type (2021-2032)
10.1.2. Europe Beverage Metal Cans Revenue (USD Million) by Application (2021-2032)
10.1.3. Europe Beverage Metal Cans Revenue (USD Million) by Product (2021-2032)
By Material
Aluminum
Steel
Tin
By Beverage
Alcoholic
Non-Alcoholic
By Capacity
Up to 5oz
6oz to 10oz
11oz to 15oz
Above 15oz
Chapter 11. Asia Pacific Beverage Metal Cans Analysis and Outlook
11.1. Asia Pacific Beverage Metal Cans Revenue (USD Million), and Revenue (USD Million) by Segments (2021-2032)
11.1.1. Asia Pacific Beverage Metal Cans Revenue (USD Million) by Type (2021-2032)
11.1.2. Asia Pacific Beverage Metal Cans Revenue (USD Million) by Application (2021-2032)
11.1.3. Asia Pacific Beverage Metal Cans Revenue (USD Million) by Product (2021-2032)
By Material
Aluminum
Steel
Tin
By Beverage
Alcoholic
Non-Alcoholic
By Capacity
Up to 5oz
6oz to 10oz
11oz to 15oz
Above 15oz
Chapter 12. South America Beverage Metal Cans Analysis and Outlook
12.1. South America Beverage Metal Cans Revenue (USD Million), by Segments (2021-2032)
12.1.1. South America Beverage Metal Cans Revenue (USD Million) by Type (2021-2032)
12.1.2. South America Beverage Metal Cans Revenue (USD Million) by Application (2021-2032)
12.1.3. South America Beverage Metal Cans Revenue (USD Million) by Product (2021-2032)
By Material
Aluminum
Steel
Tin
By Beverage
Alcoholic
Non-Alcoholic
By Capacity
Up to 5oz
6oz to 10oz
11oz to 15oz
Above 15oz
Chapter 13. Middle East and Africa Beverage Metal Cans Analysis and Outlook
13.1. Middle East and Africa Beverage Metal Cans Revenue (USD Million), by Segments (2021-2032)
13.1.1. Middle East and Africa Beverage Metal Cans Revenue (USD Million) by Type (2021-2032)
13.1.2. Middle East and Africa Beverage Metal Cans Revenue (USD Million) by Application (2021-2032)
13.1.3. Middle East and Africa Beverage Metal Cans Revenue (USD Million) by Product (2021-2032)
By Material
Aluminum
Steel
Tin
By Beverage
Alcoholic
Non-Alcoholic
By Capacity
Up to 5oz
6oz to 10oz
11oz to 15oz
Above 15oz
Chapter 14. Beverage Metal Cans Company Profiles
14.1 Business Overview
14.2 Product Profiles
14.3 SWOT Profiles
14.5 Recent Developments
14.6 Financial Profile
List of Companies
Amcor plc
Ardagh Group S.A.
Ball Corp
CANPACK
Crown Holdings Inc
Envases Group
GZI Industries Ltd
Orora Packaging Australia Pty Ltd
Showa Denko K.K.
Silgan Containers LLC
15. Methodology and Data Sources
15.1 Customization Offerings
15.2 Subscription Services
15.3 Related Reports
15.4 Publisher Expertise
LIST OF TABLES
Table 1 Market Segmentation Analysis
Table 2 Global Beverage Metal Cans Market Share of Leading Companies, 2023
Table 3 Product Offerings of Leading Companies
Table 4 Low Growth Scenario Forecasts
Table 5 Reference Case Growth Scenario
Table 6 High Growth Case Scenario
Table 7 Global Beverage Metal Cans Revenue (USD Million) And CAGR (%) By Type (2021-2032)
Table 8 Global Beverage Metal Cans Revenue (USD Million) And CAGR (%) By Application (2021-2032)
Table 9 Global Beverage Metal Cans Revenue (USD Million) And CAGR (%) By Product (2021-2032)
Table 10 Global Beverage Metal Cans Market Revenue (USD Million) By Regions (2021-2032)
Table 11 Global Beverage Metal Cans Market Share (%) By Regions (2021-2032)
Table 12 North America Beverage Metal Cans Revenue (USD Million) By Country (2021-2032)
Table 13 Europe Beverage Metal Cans Revenue (USD Million) By Country (2021-2032)
Table 14 Asia Pacific Beverage Metal Cans Revenue (USD Million) By Country (2021-2032)
Table 15 South America Beverage Metal Cans Revenue (USD Million) By Country (2021-2032)
Table 16 Middle East and Africa Beverage Metal Cans Revenue (USD Million) By Region (2021-2032)
Table 17 North America Beverage Metal Cans Revenue (USD Million) By Type (2021-2032)
Table 18 North America Beverage Metal Cans Revenue (USD Million) By Application (2021-2032)
Table 19 North America Beverage Metal Cans Revenue (USD Million) By Product (2021-2032)
Table 20 Europe Beverage Metal Cans Revenue (USD Million) By Type (2021-2032)
Table 21 Europe Beverage Metal Cans Revenue (USD Million) By Application (2021-2032)
Table 22 Europe Beverage Metal Cans Revenue (USD Million) By Product (2021-2032)
Table 23 Asia Pacific Beverage Metal Cans Revenue (USD Million) By Type (2021-2032)
Table 24 Asia Pacific Beverage Metal Cans Revenue (USD Million) By Application (2021-2032)
Table 25 Asia Pacific Beverage Metal Cans Revenue (USD Million) By Product (2021-2032)
Table 26 South America Beverage Metal Cans Revenue (USD Million) By Type (2021-2032)
Table 27 South America Beverage Metal Cans Revenue (USD Million) By Application (2021-2032)
Table 28 South America Beverage Metal Cans Revenue (USD Million) By Product (2021-2032)
Table 29 Middle East and Africa Beverage Metal Cans Revenue (USD Million) By Type (2021-2032)
Table 30 Middle East and Africa Beverage Metal Cans Revenue (USD Million) By Application (2021-2032)
Table 31 Middle East and Africa Beverage Metal Cans Revenue (USD Million) By Product (2021-2032)
LIST OF FIGURES
Figure 1. Market Scope
Figure 2. Pricing Forecasts Per Unit, 2023- 2032
Figure 3. Porter’s Five Forces
Figure 4. Global Beverage Metal Cans Market Revenue (USD Million) By Regions (2021-2032)
Figure 5. Global Beverage Metal Cans Market Share (%) By Regions (2023)
Figure 6. North America Beverage Metal Cans Revenue (USD Million) By Country (2021-2032)
Figure 7. United States Beverage Metal Cans Revenue (USD Million) By Country (2021-2032)
Figure 8. Canada Beverage Metal Cans Revenue (USD Million) By Country (2021-2032)
Figure 9. Mexico Beverage Metal Cans Revenue (USD Million) By Country (2021-2032)
Figure 10. Europe Beverage Metal Cans Revenue (USD Million) By Country (2021-2032)
Figure 11. Germany Beverage Metal Cans Revenue (USD Million) By Country (2021-2032)
Figure 12. France Beverage Metal Cans Revenue (USD Million) By Country (2021-2032)
Figure 13. United Kingdom Beverage Metal Cans Revenue (USD Million) By Country (2021-2032)
Figure 14. Spain Beverage Metal Cans Revenue (USD Million) By Country (2021-2032)
Figure 15. Italy Beverage Metal Cans Revenue (USD Million) By Country (2021-2032)
Figure 16. Russia Beverage Metal Cans Revenue (USD Million) By Country (2021-2032)
Figure 17. Rest of Europe Beverage Metal Cans Revenue (USD Million) By Country (2021-2032)
Figure 11. Asia Pacific Beverage Metal Cans Revenue (USD Million) By Country (2021-2032)
Figure 12. China Beverage Metal Cans Revenue (USD Million) By Country (2021-2032)
Figure 13. Japan Beverage Metal Cans Revenue (USD Million) By Country (2021-2032)
Figure 14. India Beverage Metal Cans Revenue (USD Million) By Country (2021-2032)
Figure 15. South Korea Beverage Metal Cans Revenue (USD Million) By Country (2021-2032)
Figure 16. Australia Beverage Metal Cans Revenue (USD Million) By Country (2021-2032)
Figure 17. South East Asia Beverage Metal Cans Revenue (USD Million) By Country (2021-2032)
Figure 18. South America Beverage Metal Cans Revenue (USD Million) By Country (2021-2032)
Figure 19. Brazil Beverage Metal Cans Revenue (USD Million) By Country (2021-2032)
Figure 20. Argentina Beverage Metal Cans Revenue (USD Million) By Country (2021-2032)
Figure 21. Rest of Asia Pacific Beverage Metal Cans Revenue (USD Million) By Country (2021-2032)
Figure 22. Middle East and Africa Beverage Metal Cans Revenue (USD Million) By Region (2021-2032)
Figure 23. Saudi Arabia Beverage Metal Cans Revenue (USD Million) By Region (2021-2032)
Figure 24. The UAE Beverage Metal Cans Revenue (USD Million) By Region (2021-2032)
Figure 25. Rest of Middle East Beverage Metal Cans Revenue (USD Million) By Region (2021-2032)
Figure 26. South Africa Beverage Metal Cans Revenue (USD Million) By Region (2021-2032)
Figure 27. Africa Beverage Metal Cans Revenue (USD Million) By Region (2021-2032)
Figure 28. North America Beverage Metal Cans Revenue (USD Million) By Type (2021-2032)
Figure 29. North America Beverage Metal Cans Revenue (USD Million) By Application (2021-2032)
Figure 30. North America Beverage Metal Cans Revenue (USD Million) By Product (2021-2032)
Figure 31. Europe Beverage Metal Cans Revenue (USD Million) By Type (2021-2032)
Figure 32. Europe Beverage Metal Cans Revenue (USD Million) By Application (2021-2032)
Figure 33. Europe Beverage Metal Cans Revenue (USD Million) By Product (2021-2032)
Figure 34. Asia Pacific Beverage Metal Cans Revenue (USD Million) By Type (2021-2032)
Figure 35. Asia Pacific Beverage Metal Cans Revenue (USD Million) By Application (2021-2032)
Figure 36. Asia Pacific Beverage Metal Cans Revenue (USD Million) By Product (2021-2032)
Figure 37. South America Beverage Metal Cans Revenue (USD Million) By Type (2021-2032)
Figure 38. South America Beverage Metal Cans Revenue (USD Million) By Application (2021-2032)
Figure 39. South America Beverage Metal Cans Revenue (USD Million) By Product (2021-2032)
Figure 40. Middle East and Africa Beverage Metal Cans Revenue (USD Million) By Type (2021-2032)
Figure 41. Middle East and Africa Beverage Metal Cans Revenue (USD Million) By Application (2021-2032)
Figure 42. Middle East and Africa Beverage Metal Cans Revenue (USD Million) By Product (2021-2032)
By Material
Aluminum
Steel
Tin
By Beverage
Alcoholic
Non-Alcoholic
By Capacity
Up to 5oz
6oz to 10oz
11oz to 15oz
Above 15oz
Countries Analyzed
North America (US, Canada, Mexico)
Europe (Germany, UK, France, Spain, Italy, Russia, Rest of Europe)
Asia Pacific (China, India, Japan, South Korea, Australia, South East Asia, Rest of Asia)
South America (Brazil, Argentina, Rest of South America)
Middle East and Africa (Saudi Arabia, UAE, Rest of Middle East, South Africa, Egypt, Rest of Africa)
