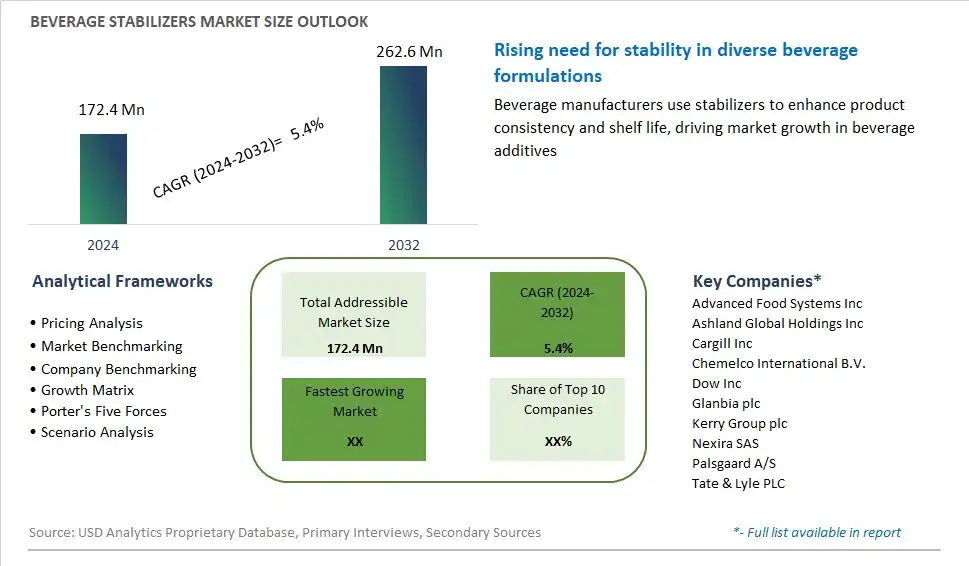
Global Beverage Stabilizers Market Size is valued at $172.4 Million in 2024 and is forecast to register a growth rate (CAGR) of 5.4% to reach $262.6 Million by 2032.
The global Beverage Stabilizers Market Comprehensive Study analyzes and forecasts the market size across 6 regions and 24 countries for diverse segments -By Application (Fruit drinks, Dairy products, Soft drinks, Alcoholic Beverages, Others), By Function (Stabilization, Texturization, Viscosification, Others), By Type (Xanthan Gum, Carrageenan, Gum Arabic, Carboxymethyl Cellulose, Others)
An Introduction to Beverage Stabilizers Market
Beverage stabilizers are essential ingredients used in the formulation of beverages to improve stability, texture, and sensory attributes in 2024. These multifunctional additives help prevent phase separation, sedimentation, and flavor degradation, ensuring that beverages maintain their desired appearance, mouthfeel, and shelf life throughout storage and distribution. With the growing demand for natural and clean-label products, beverage stabilizers derived from plant-based sources such as gums, starches, and proteins are gaining popularity as alternatives to synthetic stabilizers and emulsifiers. Whether used in soft drinks, dairy alternatives, or alcoholic beverages, stabilizers play a critical role in achieving the desired viscosity, suspension, and stability required for consumer acceptance and product success. As beverage formulations become more complex and diverse to meet evolving consumer preferences, the market for beverage stabilizers is expected to expand, driven by demand for innovative solutions that enhance product quality, functionality, and appeal.
Beverage Stabilizers Competitive Landscape
The market report analyses the leading companies in the industry including Advanced Food Systems Inc, Ashland Global Holdings Inc, Cargill Inc, Chemelco International B.V., Dow Inc, Glanbia plc, Kerry Group plc, Nexira SAS, Palsgaard A/S, Tate & Lyle PLC, and Others.
Beverage Stabilizers Market Dynamics
Beverage Stabilizers Market Trend: Growing Demand for Clean Label and Natural Ingredients
A significant trend in the beverage stabilizers market is the growing demand for clean label and natural ingredients in beverage formulations. As consumers become increasingly health-conscious and mindful of the ingredients they consume, there's a rising preference for beverages formulated with natural stabilizers and additives. This trend is driven by factors such as clean label initiatives, clean eating trends, and concerns about artificial additives and synthetic chemicals in food and beverages. Beverage manufacturers are responding to this trend by replacing synthetic stabilizers with natural alternatives such as plant-based gums, seaweed extracts, and pectins, which offer functional properties while aligning with clean label requirements. Additionally, natural stabilizers are perceived as healthier and more environmentally friendly options, appealing to consumers seeking wholesome and transparent beverage products. As a result, there's a growing market demand for beverage stabilizers derived from natural sources, driving innovation and product development in the beverage industry.
Market Driver: Demand for Extended Shelf Life and Product Quality
A key driver propelling the growth of the beverage stabilizers market is the increasing demand for extended shelf life and product quality in beverages. Stabilizers play a crucial role in maintaining the texture, consistency, and sensory attributes of beverages throughout their shelf life, preventing phase separation, sedimentation, and spoilage. This driver is fueled by factors such as changing consumer lifestyles, globalization of the food supply chain, and the rise of convenience and ready-to-drink beverages. Beverage manufacturers rely on stabilizers to ensure product stability, uniformity, and palatability, especially in applications such as dairy beverages, fruit juices, sports drinks, and functional beverages. Additionally, stabilizers help enhance mouthfeel, improve suspension of particulates, and prevent color fading or flavor degradation, contributing to overall product quality and consumer satisfaction. With consumers seeking beverages that offer longer shelf life, freshness, and sensory appeal, there's a growing demand for advanced stabilizer systems and formulations that deliver optimal performance and product stability across a wide range of beverage categories.
Market Opportunity: Expansion into Functional and Health-focused Beverages
An opportunity within the beverage stabilizers market lies in the expansion into functional and health-focused beverage segments to meet evolving consumer preferences and market trends. As consumers prioritize health and wellness, there's a growing demand for functional beverages formulated with added nutrients, botanical extracts, and bioactive ingredients to support specific health goals and lifestyle needs. Beverage stabilizers play a critical role in enhancing the stability, texture, and sensory attributes of functional beverages such as protein drinks, plant-based milks, probiotic beverages, and enhanced water products. Manufacturers have the opportunity to develop stabilizer systems tailored to the unique formulation requirements of functional beverages, ensuring compatibility with added ingredients and delivering optimal product performance. Additionally, there's potential for innovation in stabilizer formulations that address specific health concerns such as digestive health, immune support, and weight management, offering opportunities for differentiation and market leadership in the rapidly growing functional beverage market. By leveraging the functional benefits of stabilizers and addressing consumer demand for health-focused beverages, manufacturers can capitalize on this market opportunity and drive growth in the beverage stabilizers segment.
Beverage Stabilizers Market Share Analysis: Soft Drinks held the dominant market share in 2024
In the Beverage Stabilizers Market categorized by application, the largest segment is soft drinks, driven by several key factors. Soft drinks represent a ubiquitous beverage category enjoyed globally, with a vast consumer base and diverse product offerings. The dominance of soft drinks within the stabilizers market can be attributed to their widespread consumption across various demographics and occasions, ranging from carbonated sodas to non-carbonated beverages like flavored waters and energy drinks. Additionally, the demand for soft drinks is bolstered by factors such as convenience, affordability, and evolving consumer preferences for refreshing and indulgent beverage options. Beverage stabilizers play a crucial role in maintaining the desired texture, mouthfeel, and shelf stability of soft drinks, ensuring product quality and consistency throughout their shelf life. Further, the continuous innovation in soft drink formulations, including the introduction of natural and clean label ingredients, further drives the demand for specialized stabilizers that can meet the industry's evolving requirements. As a result, the soft drinks segment remains the largest application segment within the Beverage Stabilizers Market, poised for continued growth amid shifting consumer preferences and beverage trends.
Beverage Stabilizers Market Share Analysis: Stabilization market is poised to register the fastest growth rae over the forecast period to 2032
Within the Beverage Stabilizers Market categorized by function, the stabilization segment is the fastest-growing segment, fueled by several key factors. Stabilization plays a crucial role in ensuring the integrity and consistency of beverages, particularly in the face of evolving consumer preferences for natural, clean label, and functional ingredients. As manufacturers seek to meet these demands, there's a growing need for stabilizers that can effectively prevent phase separation, sedimentation, and degradation of ingredients in a wide range of beverage formulations. Further, the rise of innovative beverage categories such as plant-based beverages, functional beverages, and ready-to-drink (RTD) beverages has created new opportunities for stabilizer applications, driving the demand for specialized formulations that can address the unique stability challenges posed by these products. Additionally, the increasing emphasis on product differentiation and premiumization in the beverage industry has led to the adoption of advanced stabilization technologies that can enhance the sensory attributes and overall quality of beverages, further propelling the growth of the stabilization segment. As a result, the stabilization function within the Beverage Stabilizers Market is experiencing rapid expansion and is poised for sustained growth as beverage manufacturers continue to prioritize product stability and quality assurance.
Beverage Stabilizers Market Share Analysis: Xanthan Gum held the dominant market share in 2024
In the Beverage Stabilizers Market segmented by type, Xanthan Gum is the largest segment, driven by several key factors. Xanthan Gum possesses unique rheological properties, making it highly effective in stabilizing a wide range of beverages, including soft drinks, dairy products, and alcoholic beverages. Its ability to provide viscosity, suspension, and emulsion stability contributes to its widespread adoption by beverage manufacturers seeking to enhance product texture and mouthfeel. Further, Xanthan Gum offers versatility in application, exhibiting excellent stability across a broad pH range and compatibility with various processing conditions, including high shear and low temperature. Additionally, the growing demand for clean label and natural ingredients in beverages has further bolstered the popularity of Xanthan Gum, as it is derived through fermentation of carbohydrates by Xanthomonas campestris bacteria. Its reputation as a safe and approved food additive by regulatory bodies such as the FDA and EFSA further solidifies its position as the preferred stabilizer in the beverage industry. As a result, Xanthan Gum continues to dominate the Beverage Stabilizers Market, poised for sustained growth due to its functional benefits and widespread application across diverse beverage categories.
Beverage Stabilizers Market Segmentation
By Application
Fruit drinks
Dairy products
Soft drinks
Alcoholic Beverages
Others
By Function
Stabilization
Texturization
Viscosification
Others
By Type
Xanthan Gum
Carrageenan
Gum Arabic
Carboxymethyl Cellulose
Others
Countries Analyzed
North America (US, Canada, Mexico)
Europe (Germany, UK, France, Spain, Italy, Russia, Rest of Europe)
Asia Pacific (China, India, Japan, South Korea, Australia, South East Asia, Rest of Asia)
South America (Brazil, Argentina, Rest of South America)
Middle East and Africa (Saudi Arabia, UAE, Rest of Middle East, South Africa, Egypt, Rest of Africa)
Beverage Stabilizers Companies Profiled in the Study
Advanced Food Systems Inc
Ashland Global Holdings Inc
Cargill Inc
Chemelco International B.V.
Dow Inc
Glanbia plc
Kerry Group plc
Nexira SAS
Palsgaard A/S
Tate & Lyle PLC
*- List Not Exhaustive
Chapter 1. TABLE OF CONTENTS
Chapter 2. Introduction to Beverage Stabilizers Market
2.1. Market Overview
2.2. Key Statistics and Report Highlights
2.3. Scope of the Comprehensive Study
2.3.1. Market Definition
2.3.2 Countries and Regions Covered
2.3.3 Research Objective
2.3.4 Units, Currency, and Conversions
2.3.5 Industry Value Chain
2.4. Key Market Segments
2.5. Key Companies
2.6. Study Period
Chapter 3. Strategic Analysis Review
3.1. Beverage Stabilizers Pricing Analysis and Forecast
3.2. Porter’s Five Forces
3.3. Market Ecosystem
3.4. SWOT Analysis
3.5. Regulatory Scenario
3.3. Effects of Inflation, Russia-Ukraine War, moderating economic growth, and other macroeconomic factors
Chapter 4. Competitive Landscape
4.1. Market Share Analysis
4.1.1. Global Beverage Stabilizers Market Share by Company, 2023
4.1.2. Product Offerings of Leading Beverage Stabilizers Companies
4.2. Market Entropy
4.2.1. New Product Launches in the Industry
4.2.2. Mergers, Acquisitions, Joint ventures, and Partnerships
4.3. Key Strategies and Best Practices
Chapter 5. Global Market Projections: Best, Reference, and Low Case Scenarios
5.1. Growth Analysis- Case Scenario Definitions
5.2. Low Growth Case Scenario Forecasts
5.3. Reference Growth Case Scenario Forecasts
5.4. High Growth Case Scenario Forecasts
Chapter 6. Market Dynamics
6.1. Beverage Stabilizers Market Drivers
6.2. Beverage Stabilizers Market Challenges
6.6. Beverage Stabilizers Market Opportunities
6.4. Beverage Stabilizers Market Trends
Chapter 7. Global Beverage Stabilizers Market Outlook Trends
7.1. Global Beverage Stabilizers Revenue (USD Million) and CAGR (%) by Type (2021-2032)
7.2. Global Beverage Stabilizers Revenue (USD Million) and CAGR (%) by Application (2021-2032)
7.3. Global Beverage Stabilizers Revenue (USD Million) and CAGR (%) by Product (2021-2032)
By Application
Fruit drinks
Dairy products
Soft drinks
Alcoholic Beverages
Others
By Function
Stabilization
Texturization
Viscosification
Others
By Type
Xanthan Gum
Carrageenan
Gum Arabic
Carboxymethyl Cellulose
Others
Chapter 8. Global Beverage Stabilizers Regional Analysis and Outlook
8.1. Global Beverage Stabilizers Revenue (USD Million) By Regions (2021- 2032)
8.2. North America Beverage Stabilizers Revenue (USD Million) by Country (2021-2032)
8.2.1. United States Beverage Stabilizers Regional Analysis and Outlook
8.2.2. Canada Beverage Stabilizers Regional Analysis and Outlook
8.2.3. Mexico Beverage Stabilizers Regional Analysis and Outlook
8.3. Europe Beverage Stabilizers Revenue (USD Million), by Country (2021-2032)
8.3.1. Germany Beverage Stabilizers Regional Analysis and Outlook
8.3.2. France Beverage Stabilizers Regional Analysis and Outlook
8.3.3. United Kingdom Beverage Stabilizers Regional Analysis and Outlook
8.3.4. Spain Beverage Stabilizers Regional Analysis and Outlook
8.3.5. Italy Beverage Stabilizers Regional Analysis and Outlook
8.3.6. Russia Beverage Stabilizers Regional Analysis and Outlook
8.3.7. Rest of Europe Beverage Stabilizers Regional Analysis and Outlook
8.4. Asia Pacific Beverage Stabilizers Revenue (USD Million) by Country (2021-2032)
8.4.1. China Beverage Stabilizers Regional Analysis and Outlook
8.4.2. Japan Beverage Stabilizers Regional Analysis and Outlook
8.4.3. India Beverage Stabilizers Regional Analysis and Outlook
8.4.4. South Korea Beverage Stabilizers Regional Analysis and Outlook
8.4.5. Australia Beverage Stabilizers Regional Analysis and Outlook
8.4.6. South East Asia Beverage Stabilizers Regional Analysis and Outlook
8.4.7. Rest of Asia Pacific Beverage Stabilizers Regional Analysis and Outlook
8.5. South America Beverage Stabilizers Revenue (USD Million), by Country (2021-2032)
8.5.1. Brazil Beverage Stabilizers Regional Analysis and Outlook
8.5.2. Argentina Beverage Stabilizers Regional Analysis and Outlook
8.5.3. Rest of South America Beverage Stabilizers Regional Analysis and Outlook
8.6. Middle East and Africa Beverage Stabilizers Revenue (USD Million) by Country (2021-2032)
8.6.1. Middle East Beverage Stabilizers Regional Analysis and Outlook
8.6.2. Africa Beverage Stabilizers Regional Analysis and Outlook
Chapter 9. North America Beverage Stabilizers Analysis and Outlook
9.1. North America Beverage Stabilizers Revenue (USD Million) by Segments (2021-2032)
9.1.1. North America Beverage Stabilizers Revenue (USD Million) by Type (2021-2032)
9.1.2. North America Beverage Stabilizers Revenue (USD Million) by Application (2021-2032)
9.1.3. North America Beverage Stabilizers Revenue (USD Million) by Product (2021-2032)
By Application
Fruit drinks
Dairy products
Soft drinks
Alcoholic Beverages
Others
By Function
Stabilization
Texturization
Viscosification
Others
By Type
Xanthan Gum
Carrageenan
Gum Arabic
Carboxymethyl Cellulose
Others
Chapter 10. Europe Beverage Stabilizers Analysis and Outlook
10.1. Europe Beverage Stabilizers Revenue (USD Million), by Segments (USD Million) (2021-2032)
10.1.1. Europe Beverage Stabilizers Revenue (USD Million) by Type (2021-2032)
10.1.2. Europe Beverage Stabilizers Revenue (USD Million) by Application (2021-2032)
10.1.3. Europe Beverage Stabilizers Revenue (USD Million) by Product (2021-2032)
By Application
Fruit drinks
Dairy products
Soft drinks
Alcoholic Beverages
Others
By Function
Stabilization
Texturization
Viscosification
Others
By Type
Xanthan Gum
Carrageenan
Gum Arabic
Carboxymethyl Cellulose
Others
Chapter 11. Asia Pacific Beverage Stabilizers Analysis and Outlook
11.1. Asia Pacific Beverage Stabilizers Revenue (USD Million), and Revenue (USD Million) by Segments (2021-2032)
11.1.1. Asia Pacific Beverage Stabilizers Revenue (USD Million) by Type (2021-2032)
11.1.2. Asia Pacific Beverage Stabilizers Revenue (USD Million) by Application (2021-2032)
11.1.3. Asia Pacific Beverage Stabilizers Revenue (USD Million) by Product (2021-2032)
By Application
Fruit drinks
Dairy products
Soft drinks
Alcoholic Beverages
Others
By Function
Stabilization
Texturization
Viscosification
Others
By Type
Xanthan Gum
Carrageenan
Gum Arabic
Carboxymethyl Cellulose
Others
Chapter 12. South America Beverage Stabilizers Analysis and Outlook
12.1. South America Beverage Stabilizers Revenue (USD Million), by Segments (2021-2032)
12.1.1. South America Beverage Stabilizers Revenue (USD Million) by Type (2021-2032)
12.1.2. South America Beverage Stabilizers Revenue (USD Million) by Application (2021-2032)
12.1.3. South America Beverage Stabilizers Revenue (USD Million) by Product (2021-2032)
By Application
Fruit drinks
Dairy products
Soft drinks
Alcoholic Beverages
Others
By Function
Stabilization
Texturization
Viscosification
Others
By Type
Xanthan Gum
Carrageenan
Gum Arabic
Carboxymethyl Cellulose
Others
Chapter 13. Middle East and Africa Beverage Stabilizers Analysis and Outlook
13.1. Middle East and Africa Beverage Stabilizers Revenue (USD Million), by Segments (2021-2032)
13.1.1. Middle East and Africa Beverage Stabilizers Revenue (USD Million) by Type (2021-2032)
13.1.2. Middle East and Africa Beverage Stabilizers Revenue (USD Million) by Application (2021-2032)
13.1.3. Middle East and Africa Beverage Stabilizers Revenue (USD Million) by Product (2021-2032)
By Application
Fruit drinks
Dairy products
Soft drinks
Alcoholic Beverages
Others
By Function
Stabilization
Texturization
Viscosification
Others
By Type
Xanthan Gum
Carrageenan
Gum Arabic
Carboxymethyl Cellulose
Others
Chapter 14. Beverage Stabilizers Company Profiles
14.1 Business Overview
14.2 Product Profiles
14.3 SWOT Profiles
14.5 Recent Developments
14.6 Financial Profile
List of Companies
Advanced Food Systems Inc
Ashland Global Holdings Inc
Cargill Inc
Chemelco International B.V.
Dow Inc
Glanbia plc
Kerry Group plc
Nexira SAS
Palsgaard A/S
Tate & Lyle PLC
15. Methodology and Data Sources
15.1 Customization Offerings
15.2 Subscription Services
15.3 Related Reports
15.4 Publisher Expertise
LIST OF TABLES
Table 1 Market Segmentation Analysis
Table 2 Global Beverage Stabilizers Market Share of Leading Companies, 2023
Table 3 Product Offerings of Leading Companies
Table 4 Low Growth Scenario Forecasts
Table 5 Reference Case Growth Scenario
Table 6 High Growth Case Scenario
Table 7 Global Beverage Stabilizers Revenue (USD Million) And CAGR (%) By Type (2021-2032)
Table 8 Global Beverage Stabilizers Revenue (USD Million) And CAGR (%) By Application (2021-2032)
Table 9 Global Beverage Stabilizers Revenue (USD Million) And CAGR (%) By Product (2021-2032)
Table 10 Global Beverage Stabilizers Market Revenue (USD Million) By Regions (2021-2032)
Table 11 Global Beverage Stabilizers Market Share (%) By Regions (2021-2032)
Table 12 North America Beverage Stabilizers Revenue (USD Million) By Country (2021-2032)
Table 13 Europe Beverage Stabilizers Revenue (USD Million) By Country (2021-2032)
Table 14 Asia Pacific Beverage Stabilizers Revenue (USD Million) By Country (2021-2032)
Table 15 South America Beverage Stabilizers Revenue (USD Million) By Country (2021-2032)
Table 16 Middle East and Africa Beverage Stabilizers Revenue (USD Million) By Region (2021-2032)
Table 17 North America Beverage Stabilizers Revenue (USD Million) By Type (2021-2032)
Table 18 North America Beverage Stabilizers Revenue (USD Million) By Application (2021-2032)
Table 19 North America Beverage Stabilizers Revenue (USD Million) By Product (2021-2032)
Table 20 Europe Beverage Stabilizers Revenue (USD Million) By Type (2021-2032)
Table 21 Europe Beverage Stabilizers Revenue (USD Million) By Application (2021-2032)
Table 22 Europe Beverage Stabilizers Revenue (USD Million) By Product (2021-2032)
Table 23 Asia Pacific Beverage Stabilizers Revenue (USD Million) By Type (2021-2032)
Table 24 Asia Pacific Beverage Stabilizers Revenue (USD Million) By Application (2021-2032)
Table 25 Asia Pacific Beverage Stabilizers Revenue (USD Million) By Product (2021-2032)
Table 26 South America Beverage Stabilizers Revenue (USD Million) By Type (2021-2032)
Table 27 South America Beverage Stabilizers Revenue (USD Million) By Application (2021-2032)
Table 28 South America Beverage Stabilizers Revenue (USD Million) By Product (2021-2032)
Table 29 Middle East and Africa Beverage Stabilizers Revenue (USD Million) By Type (2021-2032)
Table 30 Middle East and Africa Beverage Stabilizers Revenue (USD Million) By Application (2021-2032)
Table 31 Middle East and Africa Beverage Stabilizers Revenue (USD Million) By Product (2021-2032)
LIST OF FIGURES
Figure 1. Market Scope
Figure 2. Pricing Forecasts Per Unit, 2023- 2032
Figure 3. Porter’s Five Forces
Figure 4. Global Beverage Stabilizers Market Revenue (USD Million) By Regions (2021-2032)
Figure 5. Global Beverage Stabilizers Market Share (%) By Regions (2023)
Figure 6. North America Beverage Stabilizers Revenue (USD Million) By Country (2021-2032)
Figure 7. United States Beverage Stabilizers Revenue (USD Million) By Country (2021-2032)
Figure 8. Canada Beverage Stabilizers Revenue (USD Million) By Country (2021-2032)
Figure 9. Mexico Beverage Stabilizers Revenue (USD Million) By Country (2021-2032)
Figure 10. Europe Beverage Stabilizers Revenue (USD Million) By Country (2021-2032)
Figure 11. Germany Beverage Stabilizers Revenue (USD Million) By Country (2021-2032)
Figure 12. France Beverage Stabilizers Revenue (USD Million) By Country (2021-2032)
Figure 13. United Kingdom Beverage Stabilizers Revenue (USD Million) By Country (2021-2032)
Figure 14. Spain Beverage Stabilizers Revenue (USD Million) By Country (2021-2032)
Figure 15. Italy Beverage Stabilizers Revenue (USD Million) By Country (2021-2032)
Figure 16. Russia Beverage Stabilizers Revenue (USD Million) By Country (2021-2032)
Figure 17. Rest of Europe Beverage Stabilizers Revenue (USD Million) By Country (2021-2032)
Figure 11. Asia Pacific Beverage Stabilizers Revenue (USD Million) By Country (2021-2032)
Figure 12. China Beverage Stabilizers Revenue (USD Million) By Country (2021-2032)
Figure 13. Japan Beverage Stabilizers Revenue (USD Million) By Country (2021-2032)
Figure 14. India Beverage Stabilizers Revenue (USD Million) By Country (2021-2032)
Figure 15. South Korea Beverage Stabilizers Revenue (USD Million) By Country (2021-2032)
Figure 16. Australia Beverage Stabilizers Revenue (USD Million) By Country (2021-2032)
Figure 17. South East Asia Beverage Stabilizers Revenue (USD Million) By Country (2021-2032)
Figure 18. South America Beverage Stabilizers Revenue (USD Million) By Country (2021-2032)
Figure 19. Brazil Beverage Stabilizers Revenue (USD Million) By Country (2021-2032)
Figure 20. Argentina Beverage Stabilizers Revenue (USD Million) By Country (2021-2032)
Figure 21. Rest of Asia Pacific Beverage Stabilizers Revenue (USD Million) By Country (2021-2032)
Figure 22. Middle East and Africa Beverage Stabilizers Revenue (USD Million) By Region (2021-2032)
Figure 23. Saudi Arabia Beverage Stabilizers Revenue (USD Million) By Region (2021-2032)
Figure 24. The UAE Beverage Stabilizers Revenue (USD Million) By Region (2021-2032)
Figure 25. Rest of Middle East Beverage Stabilizers Revenue (USD Million) By Region (2021-2032)
Figure 26. South Africa Beverage Stabilizers Revenue (USD Million) By Region (2021-2032)
Figure 27. Africa Beverage Stabilizers Revenue (USD Million) By Region (2021-2032)
Figure 28. North America Beverage Stabilizers Revenue (USD Million) By Type (2021-2032)
Figure 29. North America Beverage Stabilizers Revenue (USD Million) By Application (2021-2032)
Figure 30. North America Beverage Stabilizers Revenue (USD Million) By Product (2021-2032)
Figure 31. Europe Beverage Stabilizers Revenue (USD Million) By Type (2021-2032)
Figure 32. Europe Beverage Stabilizers Revenue (USD Million) By Application (2021-2032)
Figure 33. Europe Beverage Stabilizers Revenue (USD Million) By Product (2021-2032)
Figure 34. Asia Pacific Beverage Stabilizers Revenue (USD Million) By Type (2021-2032)
Figure 35. Asia Pacific Beverage Stabilizers Revenue (USD Million) By Application (2021-2032)
Figure 36. Asia Pacific Beverage Stabilizers Revenue (USD Million) By Product (2021-2032)
Figure 37. South America Beverage Stabilizers Revenue (USD Million) By Type (2021-2032)
Figure 38. South America Beverage Stabilizers Revenue (USD Million) By Application (2021-2032)
Figure 39. South America Beverage Stabilizers Revenue (USD Million) By Product (2021-2032)
Figure 40. Middle East and Africa Beverage Stabilizers Revenue (USD Million) By Type (2021-2032)
Figure 41. Middle East and Africa Beverage Stabilizers Revenue (USD Million) By Application (2021-2032)
Figure 42. Middle East and Africa Beverage Stabilizers Revenue (USD Million) By Product (2021-2032)
By Application
Fruit drinks
Dairy products
Soft drinks
Alcoholic Beverages
Others
By Function
Stabilization
Texturization
Viscosification
Others
By Type
Xanthan Gum
Carrageenan
Gum Arabic
Carboxymethyl Cellulose
Others
Countries Analyzed
North America (US, Canada, Mexico)
Europe (Germany, UK, France, Spain, Italy, Russia, Rest of Europe)
Asia Pacific (China, India, Japan, South Korea, Australia, South East Asia, Rest of Asia)
South America (Brazil, Argentina, Rest of South America)
Middle East and Africa (Saudi Arabia, UAE, Rest of Middle East, South Africa, Egypt, Rest of Africa)
