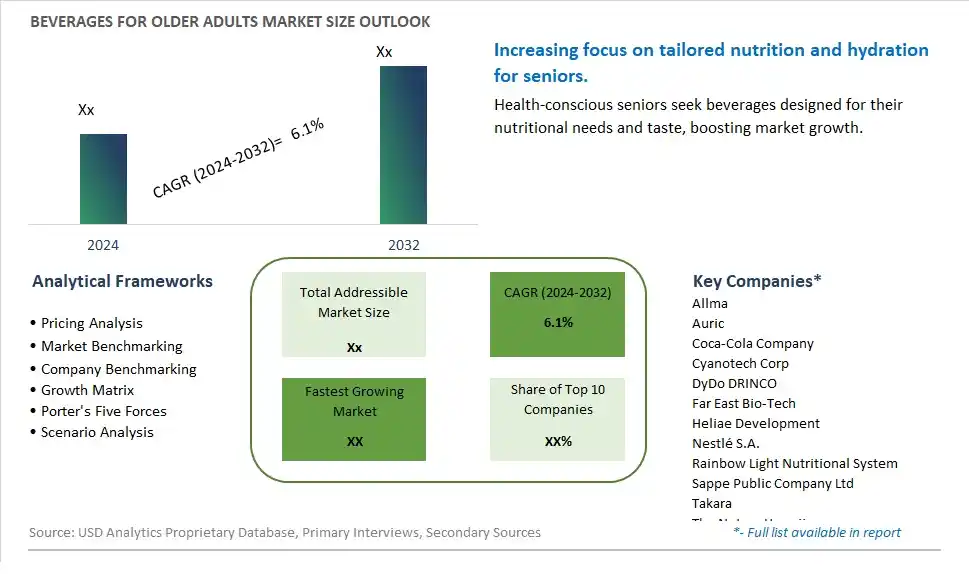
Global Beverages for Older Adults Market Size is valued at $XX Million in 2024 and is forecast to register a growth rate (CAGR) of 6.1% to reach $XX Million by 2032.
The global Beverages for Older Adults Market Comprehensive Study analyzes and forecasts the market size across 6 regions and 24 countries for diverse segments -By Type (Proteins/Collagen, Vitamins, Minerals, Fruit and Plant Extracts, Others), By Application (Online, Offline)
An Introduction to Beverages for Older Adults Market
The Beverages for Older Adults market in 2024 is expanding rapidly, driven by the growing focus on health and wellness among the aging population. These beverages are specifically formulated to address the nutritional needs and health concerns of older adults, including hydration, bone health, digestive health, and cognitive function. The market is supported by the increasing awareness of the importance of proper nutrition in aging, as well as the rising demand for functional and fortified beverages. Advances in nutritional science and product formulation are enhancing the efficacy, taste, and convenience of beverages for older adults, catering to their specific dietary requirements and preferences.
Beverages for Older Adults Competitive Landscape
The market report analyses the leading companies in the industry including Allma, Auric, Coca-Cola Company, Cyanotech Corp, DyDo DRINCO, Far East Bio-Tech, Heliae Development, Nestlé S.A., Rainbow Light Nutritional System, Sappe Public Company Ltd, Takara, The Nutrex Hawaii, and Others.
Beverages for Older Adults Market Dynamics
Beverages for Older Adults Market Trend: Rise in Demand for Functional and Health-focused Beverages
The most prominent market trend for Beverages for Older Adults is the rise in demand for functional and health-focused beverages. As the older adult population continues to grow globally, there is a corresponding increase in demand for beverages that cater to their specific health needs and preferences. Older adults are seeking beverages that offer nutritional benefits, such as vitamins, minerals, antioxidants, and functional ingredients that support bone health, cognitive function, immune system, and overall well-being. This trend reflects a broader shift towards proactive health management and personalized nutrition, driving the development and adoption of specialized beverages for older adults.
Beverages for Older Adults Market Driver: Aging Population and Health Consciousness
A key market driver for Beverages for Older Adults is the aging population and their increasing health consciousness. With advancements in healthcare and a focus on healthy aging, older adults are more proactive about maintaining their health and adopting lifestyle habits that support longevity and vitality. This demographic segment values beverages that not only taste good but also provide tangible health benefits, aligning with their wellness goals and nutritional requirements. The driver of the aging population and health consciousness propels the demand for beverages tailored to the specific needs and preferences of older adults.
Beverages for Older Adults Market Opportunity: Development of Nutrient-rich and Functional Beverages
A potential opportunity within the Beverages for Older Adults market lies in the development of nutrient-rich and functional beverages. Collaborating with nutritionists, geriatric specialists, and food scientists can lead to the creation of beverages that address age-related health concerns, such as bone health, joint support, cognitive function, digestive health, and cardiovascular wellness. Additionally, exploring opportunities in low-sugar, low-sodium, and fortified beverages can cater to the dietary restrictions and preferences of older adults, including those with diabetes, hypertension, and other chronic conditions. By focusing on the development of nutrient-rich and functional beverages, there are opportunities to meet the unique needs of older adult consumers, enhance their quality of life, and tap into a growing market segment with specific health and wellness requirements.
Beverages for Older Adults Market Share Analysis: Vitamins is the fastest growing segment over the forecast period to 2032
Within the Beverages for Older Adults Market, the largest segment is Vitamins. This segment focuses on beverages fortified with essential vitamins that cater to the specific nutritional needs of older adults. Vitamins play a crucial role in maintaining overall health and wellness, especially as individuals age and may require additional supplementation. The fast growth of this segment can be attributed to several factors. Firstly, there is a growing awareness among older adults about the importance of maintaining a balanced diet and consuming adequate vitamins to support their immune system, bone health, and cognitive function. Additionally, advancements in beverage formulation and technology have enabled the development of vitamin-enriched beverages that are not only nutritious but also palatable and convenient for older consumers. The Vitamins segment continues to expand as manufacturers innovate to meet the evolving nutritional needs of older adults, making it the largest and fastest-growing segment in the Beverages for Older Adults Market.
Beverages for Older Adults Market Share Analysis: Online is the fastest growing segment over the forecast period to 2032
In the Beverages for Older Adults Market, the Online segment is poised to be the fastest growing up to 2032. The rapid growth of online sales channels can be attributed to several factors. Firstly, the increasing digitalization and adoption of e-commerce platforms among older adults have made it easier for them to access a wide range of products, including specialized beverages tailored to their needs. Online platforms offer convenience, a broader product selection, and the ability to compare prices and read reviews, making them attractive options for older consumers looking for specific beverages. Further, the ongoing Past few yearshas accelerated the shift towards online shopping across all demographics, including older adults, who may prefer the safety and convenience of online purchasing. As a result, the Online segment in the Beverages for Older Adults Market is expected to experience substantial growth as more older consumers embrace digital platforms for their shopping needs.
Beverages for Older Adults Market Segmentation
By Type
Proteins/Collagen
Vitamins
Minerals
Fruit and Plant Extracts
Others
By Application
Online
Offline
Countries Analyzed
North America (US, Canada, Mexico)
Europe (Germany, UK, France, Spain, Italy, Russia, Rest of Europe)
Asia Pacific (China, India, Japan, South Korea, Australia, South East Asia, Rest of Asia)
South America (Brazil, Argentina, Rest of South America)
Middle East and Africa (Saudi Arabia, UAE, Rest of Middle East, South Africa, Egypt, Rest of Africa)
Beverages for Older Adults Companies Profiled in the Study
Allma
Auric
Coca-Cola Company
Cyanotech Corp
DyDo DRINCO
Far East Bio-Tech
Heliae Development
Nestlé S.A.
Rainbow Light Nutritional System
Sappe Public Company Ltd
Takara
The Nutrex Hawaii
*- List Not Exhaustive
Chapter 1. TABLE OF CONTENTS
Chapter 2. Introduction to Beverages for Older Adults Market
2.1. Market Overview
2.2. Key Statistics and Report Highlights
2.3. Scope of the Comprehensive Study
2.3.1. Market Definition
2.3.2 Countries and Regions Covered
2.3.3 Research Objective
2.3.4 Units, Currency, and Conversions
2.3.5 Industry Value Chain
2.4. Key Market Segments
2.5. Key Companies
2.6. Study Period
Chapter 3. Strategic Analysis Review
3.1. Beverages for Older Adults Pricing Analysis and Forecast
3.2. Porter’s Five Forces
3.3. Market Ecosystem
3.4. SWOT Analysis
3.5. Regulatory Scenario
3.3. Effects of Inflation, Russia-Ukraine War, moderating economic growth, and other macroeconomic factors
Chapter 4. Competitive Landscape
4.1. Market Share Analysis
4.1.1. Global Beverages for Older Adults Market Share by Company, 2023
4.1.2. Product Offerings of Leading Beverages for Older Adults Companies
4.2. Market Entropy
4.2.1. New Product Launches in the Industry
4.2.2. Mergers, Acquisitions, Joint ventures, and Partnerships
4.3. Key Strategies and Best Practices
Chapter 5. Global Market Projections: Best, Reference, and Low Case Scenarios
5.1. Growth Analysis- Case Scenario Definitions
5.2. Low Growth Case Scenario Forecasts
5.3. Reference Growth Case Scenario Forecasts
5.4. High Growth Case Scenario Forecasts
Chapter 6. Market Dynamics
6.1. Beverages for Older Adults Market Drivers
6.2. Beverages for Older Adults Market Challenges
6.6. Beverages for Older Adults Market Opportunities
6.4. Beverages for Older Adults Market Trends
Chapter 7. Global Beverages for Older Adults Market Outlook Trends
7.1. Global Beverages for Older Adults Revenue (USD Million) and CAGR (%) by Type (2021-2032)
7.2. Global Beverages for Older Adults Revenue (USD Million) and CAGR (%) by Application (2021-2032)
7.3. Global Beverages for Older Adults Revenue (USD Million) and CAGR (%) by Product (2021-2032)
By Type
Proteins/Collagen
Vitamins
Minerals
Fruit and Plant Extracts
Others
By Application
Online
Offline
Chapter 8. Global Beverages for Older Adults Regional Analysis and Outlook
8.1. Global Beverages for Older Adults Revenue (USD Million) By Regions (2021- 2032)
8.2. North America Beverages for Older Adults Revenue (USD Million) by Country (2021-2032)
8.2.1. United States Beverages for Older Adults Regional Analysis and Outlook
8.2.2. Canada Beverages for Older Adults Regional Analysis and Outlook
8.2.3. Mexico Beverages for Older Adults Regional Analysis and Outlook
8.3. Europe Beverages for Older Adults Revenue (USD Million), by Country (2021-2032)
8.3.1. Germany Beverages for Older Adults Regional Analysis and Outlook
8.3.2. France Beverages for Older Adults Regional Analysis and Outlook
8.3.3. United Kingdom Beverages for Older Adults Regional Analysis and Outlook
8.3.4. Spain Beverages for Older Adults Regional Analysis and Outlook
8.3.5. Italy Beverages for Older Adults Regional Analysis and Outlook
8.3.6. Russia Beverages for Older Adults Regional Analysis and Outlook
8.3.7. Rest of Europe Beverages for Older Adults Regional Analysis and Outlook
8.4. Asia Pacific Beverages for Older Adults Revenue (USD Million) by Country (2021-2032)
8.4.1. China Beverages for Older Adults Regional Analysis and Outlook
8.4.2. Japan Beverages for Older Adults Regional Analysis and Outlook
8.4.3. India Beverages for Older Adults Regional Analysis and Outlook
8.4.4. South Korea Beverages for Older Adults Regional Analysis and Outlook
8.4.5. Australia Beverages for Older Adults Regional Analysis and Outlook
8.4.6. South East Asia Beverages for Older Adults Regional Analysis and Outlook
8.4.7. Rest of Asia Pacific Beverages for Older Adults Regional Analysis and Outlook
8.5. South America Beverages for Older Adults Revenue (USD Million), by Country (2021-2032)
8.5.1. Brazil Beverages for Older Adults Regional Analysis and Outlook
8.5.2. Argentina Beverages for Older Adults Regional Analysis and Outlook
8.5.3. Rest of South America Beverages for Older Adults Regional Analysis and Outlook
8.6. Middle East and Africa Beverages for Older Adults Revenue (USD Million) by Country (2021-2032)
8.6.1. Middle East Beverages for Older Adults Regional Analysis and Outlook
8.6.2. Africa Beverages for Older Adults Regional Analysis and Outlook
Chapter 9. North America Beverages for Older Adults Analysis and Outlook
9.1. North America Beverages for Older Adults Revenue (USD Million) by Segments (2021-2032)
9.1.1. North America Beverages for Older Adults Revenue (USD Million) by Type (2021-2032)
9.1.2. North America Beverages for Older Adults Revenue (USD Million) by Application (2021-2032)
9.1.3. North America Beverages for Older Adults Revenue (USD Million) by Product (2021-2032)
By Type
Proteins/Collagen
Vitamins
Minerals
Fruit and Plant Extracts
Others
By Application
Online
Offline
Chapter 10. Europe Beverages for Older Adults Analysis and Outlook
10.1. Europe Beverages for Older Adults Revenue (USD Million), by Segments (USD Million) (2021-2032)
10.1.1. Europe Beverages for Older Adults Revenue (USD Million) by Type (2021-2032)
10.1.2. Europe Beverages for Older Adults Revenue (USD Million) by Application (2021-2032)
10.1.3. Europe Beverages for Older Adults Revenue (USD Million) by Product (2021-2032)
By Type
Proteins/Collagen
Vitamins
Minerals
Fruit and Plant Extracts
Others
By Application
Online
Offline
Chapter 11. Asia Pacific Beverages for Older Adults Analysis and Outlook
11.1. Asia Pacific Beverages for Older Adults Revenue (USD Million), and Revenue (USD Million) by Segments (2021-2032)
11.1.1. Asia Pacific Beverages for Older Adults Revenue (USD Million) by Type (2021-2032)
11.1.2. Asia Pacific Beverages for Older Adults Revenue (USD Million) by Application (2021-2032)
11.1.3. Asia Pacific Beverages for Older Adults Revenue (USD Million) by Product (2021-2032)
By Type
Proteins/Collagen
Vitamins
Minerals
Fruit and Plant Extracts
Others
By Application
Online
Offline
Chapter 12. South America Beverages for Older Adults Analysis and Outlook
12.1. South America Beverages for Older Adults Revenue (USD Million), by Segments (2021-2032)
12.1.1. South America Beverages for Older Adults Revenue (USD Million) by Type (2021-2032)
12.1.2. South America Beverages for Older Adults Revenue (USD Million) by Application (2021-2032)
12.1.3. South America Beverages for Older Adults Revenue (USD Million) by Product (2021-2032)
By Type
Proteins/Collagen
Vitamins
Minerals
Fruit and Plant Extracts
Others
By Application
Online
Offline
Chapter 13. Middle East and Africa Beverages for Older Adults Analysis and Outlook
13.1. Middle East and Africa Beverages for Older Adults Revenue (USD Million), by Segments (2021-2032)
13.1.1. Middle East and Africa Beverages for Older Adults Revenue (USD Million) by Type (2021-2032)
13.1.2. Middle East and Africa Beverages for Older Adults Revenue (USD Million) by Application (2021-2032)
13.1.3. Middle East and Africa Beverages for Older Adults Revenue (USD Million) by Product (2021-2032)
By Type
Proteins/Collagen
Vitamins
Minerals
Fruit and Plant Extracts
Others
By Application
Online
Offline
Chapter 14. Beverages for Older Adults Company Profiles
14.1 Business Overview
14.2 Product Profiles
14.3 SWOT Profiles
14.5 Recent Developments
14.6 Financial Profile
List of Companies
Allma
Auric
Coca-Cola Company
Cyanotech Corp
DyDo DRINCO
Far East Bio-Tech
Heliae Development
Nestlé S.A.
Rainbow Light Nutritional System
Sappe Public Company Ltd
Takara
The Nutrex Hawaii
15. Methodology and Data Sources
15.1 Customization Offerings
15.2 Subscription Services
15.3 Related Reports
15.4 Publisher Expertise
LIST OF TABLES
Table 1 Market Segmentation Analysis
Table 2 Global Beverages for Older Adults Market Share of Leading Companies, 2023
Table 3 Product Offerings of Leading Companies
Table 4 Low Growth Scenario Forecasts
Table 5 Reference Case Growth Scenario
Table 6 High Growth Case Scenario
Table 7 Global Beverages for Older Adults Revenue (USD Million) And CAGR (%) By Type (2021-2032)
Table 8 Global Beverages for Older Adults Revenue (USD Million) And CAGR (%) By Application (2021-2032)
Table 9 Global Beverages for Older Adults Revenue (USD Million) And CAGR (%) By Product (2021-2032)
Table 10 Global Beverages for Older Adults Market Revenue (USD Million) By Regions (2021-2032)
Table 11 Global Beverages for Older Adults Market Share (%) By Regions (2021-2032)
Table 12 North America Beverages for Older Adults Revenue (USD Million) By Country (2021-2032)
Table 13 Europe Beverages for Older Adults Revenue (USD Million) By Country (2021-2032)
Table 14 Asia Pacific Beverages for Older Adults Revenue (USD Million) By Country (2021-2032)
Table 15 South America Beverages for Older Adults Revenue (USD Million) By Country (2021-2032)
Table 16 Middle East and Africa Beverages for Older Adults Revenue (USD Million) By Region (2021-2032)
Table 17 North America Beverages for Older Adults Revenue (USD Million) By Type (2021-2032)
Table 18 North America Beverages for Older Adults Revenue (USD Million) By Application (2021-2032)
Table 19 North America Beverages for Older Adults Revenue (USD Million) By Product (2021-2032)
Table 20 Europe Beverages for Older Adults Revenue (USD Million) By Type (2021-2032)
Table 21 Europe Beverages for Older Adults Revenue (USD Million) By Application (2021-2032)
Table 22 Europe Beverages for Older Adults Revenue (USD Million) By Product (2021-2032)
Table 23 Asia Pacific Beverages for Older Adults Revenue (USD Million) By Type (2021-2032)
Table 24 Asia Pacific Beverages for Older Adults Revenue (USD Million) By Application (2021-2032)
Table 25 Asia Pacific Beverages for Older Adults Revenue (USD Million) By Product (2021-2032)
Table 26 South America Beverages for Older Adults Revenue (USD Million) By Type (2021-2032)
Table 27 South America Beverages for Older Adults Revenue (USD Million) By Application (2021-2032)
Table 28 South America Beverages for Older Adults Revenue (USD Million) By Product (2021-2032)
Table 29 Middle East and Africa Beverages for Older Adults Revenue (USD Million) By Type (2021-2032)
Table 30 Middle East and Africa Beverages for Older Adults Revenue (USD Million) By Application (2021-2032)
Table 31 Middle East and Africa Beverages for Older Adults Revenue (USD Million) By Product (2021-2032)
LIST OF FIGURES
Figure 1. Market Scope
Figure 2. Pricing Forecasts Per Unit, 2023- 2032
Figure 3. Porter’s Five Forces
Figure 4. Global Beverages for Older Adults Market Revenue (USD Million) By Regions (2021-2032)
Figure 5. Global Beverages for Older Adults Market Share (%) By Regions (2023)
Figure 6. North America Beverages for Older Adults Revenue (USD Million) By Country (2021-2032)
Figure 7. United States Beverages for Older Adults Revenue (USD Million) By Country (2021-2032)
Figure 8. Canada Beverages for Older Adults Revenue (USD Million) By Country (2021-2032)
Figure 9. Mexico Beverages for Older Adults Revenue (USD Million) By Country (2021-2032)
Figure 10. Europe Beverages for Older Adults Revenue (USD Million) By Country (2021-2032)
Figure 11. Germany Beverages for Older Adults Revenue (USD Million) By Country (2021-2032)
Figure 12. France Beverages for Older Adults Revenue (USD Million) By Country (2021-2032)
Figure 13. United Kingdom Beverages for Older Adults Revenue (USD Million) By Country (2021-2032)
Figure 14. Spain Beverages for Older Adults Revenue (USD Million) By Country (2021-2032)
Figure 15. Italy Beverages for Older Adults Revenue (USD Million) By Country (2021-2032)
Figure 16. Russia Beverages for Older Adults Revenue (USD Million) By Country (2021-2032)
Figure 17. Rest of Europe Beverages for Older Adults Revenue (USD Million) By Country (2021-2032)
Figure 11. Asia Pacific Beverages for Older Adults Revenue (USD Million) By Country (2021-2032)
Figure 12. China Beverages for Older Adults Revenue (USD Million) By Country (2021-2032)
Figure 13. Japan Beverages for Older Adults Revenue (USD Million) By Country (2021-2032)
Figure 14. India Beverages for Older Adults Revenue (USD Million) By Country (2021-2032)
Figure 15. South Korea Beverages for Older Adults Revenue (USD Million) By Country (2021-2032)
Figure 16. Australia Beverages for Older Adults Revenue (USD Million) By Country (2021-2032)
Figure 17. South East Asia Beverages for Older Adults Revenue (USD Million) By Country (2021-2032)
Figure 18. South America Beverages for Older Adults Revenue (USD Million) By Country (2021-2032)
Figure 19. Brazil Beverages for Older Adults Revenue (USD Million) By Country (2021-2032)
Figure 20. Argentina Beverages for Older Adults Revenue (USD Million) By Country (2021-2032)
Figure 21. Rest of Asia Pacific Beverages for Older Adults Revenue (USD Million) By Country (2021-2032)
Figure 22. Middle East and Africa Beverages for Older Adults Revenue (USD Million) By Region (2021-2032)
Figure 23. Saudi Arabia Beverages for Older Adults Revenue (USD Million) By Region (2021-2032)
Figure 24. The UAE Beverages for Older Adults Revenue (USD Million) By Region (2021-2032)
Figure 25. Rest of Middle East Beverages for Older Adults Revenue (USD Million) By Region (2021-2032)
Figure 26. South Africa Beverages for Older Adults Revenue (USD Million) By Region (2021-2032)
Figure 27. Africa Beverages for Older Adults Revenue (USD Million) By Region (2021-2032)
Figure 28. North America Beverages for Older Adults Revenue (USD Million) By Type (2021-2032)
Figure 29. North America Beverages for Older Adults Revenue (USD Million) By Application (2021-2032)
Figure 30. North America Beverages for Older Adults Revenue (USD Million) By Product (2021-2032)
Figure 31. Europe Beverages for Older Adults Revenue (USD Million) By Type (2021-2032)
Figure 32. Europe Beverages for Older Adults Revenue (USD Million) By Application (2021-2032)
Figure 33. Europe Beverages for Older Adults Revenue (USD Million) By Product (2021-2032)
Figure 34. Asia Pacific Beverages for Older Adults Revenue (USD Million) By Type (2021-2032)
Figure 35. Asia Pacific Beverages for Older Adults Revenue (USD Million) By Application (2021-2032)
Figure 36. Asia Pacific Beverages for Older Adults Revenue (USD Million) By Product (2021-2032)
Figure 37. South America Beverages for Older Adults Revenue (USD Million) By Type (2021-2032)
Figure 38. South America Beverages for Older Adults Revenue (USD Million) By Application (2021-2032)
Figure 39. South America Beverages for Older Adults Revenue (USD Million) By Product (2021-2032)
Figure 40. Middle East and Africa Beverages for Older Adults Revenue (USD Million) By Type (2021-2032)
Figure 41. Middle East and Africa Beverages for Older Adults Revenue (USD Million) By Application (2021-2032)
Figure 42. Middle East and Africa Beverages for Older Adults Revenue (USD Million) By Product (2021-2032)
By Type
Proteins/Collagen
Vitamins
Minerals
Fruit and Plant Extracts
Others
By Application
Online
Offline
Countries Analyzed
North America (US, Canada, Mexico)
Europe (Germany, UK, France, Spain, Italy, Russia, Rest of Europe)
Asia Pacific (China, India, Japan, South Korea, Australia, South East Asia, Rest of Asia)
South America (Brazil, Argentina, Rest of South America)
Middle East and Africa (Saudi Arabia, UAE, Rest of Middle East, South Africa, Egypt, Rest of Africa)
