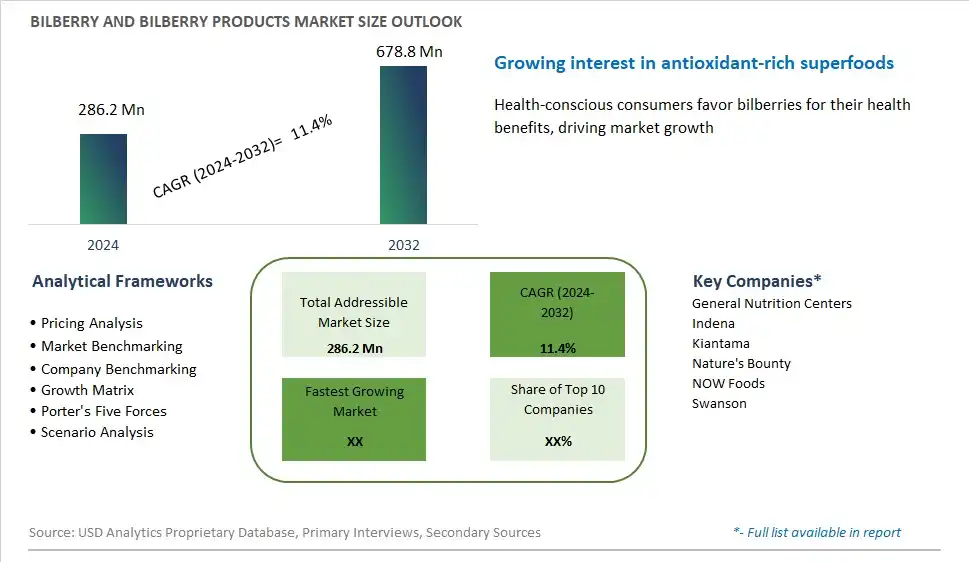
Global Bilberry and Bilberry Products Market Size is valued at $286.2 Million in 2024 and is forecast to register a growth rate (CAGR) of 11.4% to reach $678.8 Million by 2032.
The global Bilberry and Bilberry Products Market Comprehensive Study analyzes and forecasts the market size across 6 regions and 24 countries for diverse segments -By Type (Fresh Bilberry, Processed Bilberry), By Application (Nutraceuticals and Pharmaceuticals, Food and Beverages, Cosmetics, Others)
An Introduction to Bilberry and Bilberry Products Market
In 2024, bilberry and bilberry products continue to captivate consumers worldwide, not only for their delicious flavor but also for their potential health benefits. Bilberries are small, dark blue berries that closely resemble blueberries and are native to Europe, Asia, and North America. These berries are renowned for their rich antioxidant content, particularly anthocyanins, which contribute to their deep color and numerous health-promoting properties. Bilberry consumption has been associated with improved vision and eye health, as anthocyanins are believed to support retinal function and protect against age-related macular degeneration and cataracts. Furthermore, bilberries are celebrated for their anti-inflammatory and cardiovascular benefits, potentially reducing the risk of heart disease and supporting overall well-being. In addition to being consumed fresh, bilberries are utilized in various culinary applications, including jams, jellies, pies, and juices. Moreover, bilberry extracts and supplements are gaining popularity as convenient ways to reap the health benefits of these nutrient-packed berries. As consumers increasingly prioritize natural remedies and functional foods for health and wellness, bilberry and bilberry products remain highly sought after for their delicious taste and potential therapeutic effects.
Bilberry and Bilberry Products Competitive Landscape
The market report analyses the leading companies in the industry including General Nutrition Centers, Indena, Kiantama, Nature's Bounty, NOW Foods, Swanson, and Others.
Bilberry and Bilberry Products Market Dynamics
Bilberry and Bilberry Products Market Trend: Growing Interest in Natural Antioxidant-Rich Superfoods
The market trend for Bilberry and Bilberry products aligns with the growing interest in natural antioxidant-rich superfoods. Bilberries, known for their deep purple hue and potent health benefits, are gaining popularity as a nutritional powerhouse. Rich in anthocyanins, vitamins, and minerals, bilberries offer a range of potential health benefits, including improved vision, cardiovascular health, and cognitive function. As consumers become increasingly health-conscious and seek out foods with functional properties, there's a rising demand for bilberry-based products, such as supplements, extracts, jams, and juices. This trend is fueled by the perception of bilberries as a natural and wholesome ingredient that supports overall well-being, driving innovation and expansion in the bilberry market.
Market Driver: Growing Aging Population and Focus on Eye Health
A significant driver of the Bilberry and Bilberry products market is the growing aging population and the increasing focus on eye health. With aging comes a higher risk of age-related eye conditions such as macular degeneration and cataracts, driving demand for natural ingredients that support eye health and vision. Bilberries have long been associated with improved night vision and visual acuity, attributed to their high concentration of anthocyanins and other bioactive compounds. As awareness of the importance of preventive eye care grows, so does the demand for bilberry-based supplements and functional foods targeted towards maintaining optimal eye health. This driver underscores the importance of addressing the specific needs of aging consumers and promoting the vision-supporting properties of bilberries to drive market growth.
Market Opportunity: Innovating Bilberry Products for Functional and Culinary Applications
An opportunity in the Bilberry and Bilberry products market lies in innovating product offerings to cater to both functional and culinary applications. While bilberry supplements and extracts dominate the market, there's potential for diversification into a broader range of formats and formulations to appeal to different consumer preferences and usage occasions. For instance, incorporating bilberries into ready-to-eat snacks, bakery products, and beverages can introduce this superfood to a wider audience and integrate it seamlessly into everyday diets. Additionally, there's an opportunity to explore novel product concepts that combine bilberries with other complementary ingredients to enhance flavor profiles and nutritional benefits. By tapping into consumer trends such as clean label, organic, and sustainable sourcing, companies can differentiate their bilberry products and capitalize on the growing demand for natural, health-promoting foods.
Bilberry and Bilberry Products Market Share Analysis: Processed Bilberry Products held the dominant market share in 2024
In the Bilberry and Bilberry Products market, processed bilberry products emerge as the largest segment, primarily due to their extended shelf life, convenience, and versatility in culinary and medicinal applications. Processed bilberry products include dried bilberries, bilberry extracts, bilberry powders, and bilberry supplements, among others. These products offer consumers the benefits of bilberries in a more accessible and concentrated form, making them suitable for various uses such as dietary supplements, flavorings, and ingredients in food and beverage formulations. Further, processed bilberry products retain the nutritional profile and health benefits associated with fresh bilberries, including high levels of antioxidants, vitamins, and anthocyanins. The longer shelf life of processed bilberry products ensures year-round availability and wider distribution, catering to consumer demand beyond the limited harvesting season of fresh bilberries. Additionally, the growing awareness of the health benefits of bilberries, such as improved vision, cardiovascular health, and cognitive function, drives the demand for processed bilberry products among health-conscious consumers. With their convenience, versatility, and nutritional benefits, processed bilberry products maintain their dominance as the largest segment in the Bilberry and Bilberry Products market, meeting the diverse needs and preferences of consumers for natural and functional food ingredients.
Bilberry and Bilberry Products Market Share Analysis: Nutraceuticals and Pharmaceuticals market is poised to register the fastest growth rae over the forecast period to 2032
Among the applications in the Bilberry and Bilberry Products market, the Nutraceuticals and Pharmaceuticals segment is the fastest-growing, driven by several key factors. Firstly, the growing consumer interest in natural health supplements and functional foods fuels the demand for bilberry-based nutraceuticals, attributed to the fruit's rich antioxidant content and potential health benefits. Bilberries are known for their high levels of anthocyanins, which have been linked to improved eye health, cardiovascular function, and cognitive performance. This increased awareness of the health-promoting properties of bilberries drives the demand for dietary supplements and pharmaceutical formulations containing bilberry extracts. Secondly, the pharmaceutical industry recognizes the therapeutic potential of bilberries in addressing various health conditions, including eye disorders such as macular degeneration and diabetic retinopathy. Bilberry extracts are used in pharmaceutical formulations aimed at improving vision and preventing age-related eye diseases, contributing to the segment's growth. Thirdly, the versatility of bilberry extracts in food and beverage applications, such as juices, jams, and functional beverages, enhances their appeal as natural ingredients with added health benefits. Further, ongoing research and clinical studies validating the efficacy of bilberry-based products further stimulate growth in this segment. With their potential to support overall health and wellness, bilberry-based nutraceuticals and pharmaceuticals are poised to continue their rapid expansion, meeting the growing demand for natural and functional ingredients in the healthcare industry.
Bilberry and Bilberry Products Market Segmentation
By Type
Fresh Bilberry
Processed Bilberry
By Application
Nutraceuticals and Pharmaceuticals
Food and Beverages
Cosmetics
Others
Countries Analyzed
North America (US, Canada, Mexico)
Europe (Germany, UK, France, Spain, Italy, Russia, Rest of Europe)
Asia Pacific (China, India, Japan, South Korea, Australia, South East Asia, Rest of Asia)
South America (Brazil, Argentina, Rest of South America)
Middle East and Africa (Saudi Arabia, UAE, Rest of Middle East, South Africa, Egypt, Rest of Africa)
Bilberry and Bilberry Products Companies Profiled in the Study
General Nutrition Centers
Indena
Kiantama
Nature's Bounty
NOW Foods
Swanson
*- List Not Exhaustive
Chapter 1. TABLE OF CONTENTS
Chapter 2. Introduction to Bilberry and Bilberry Products Market
2.1. Market Overview
2.2. Key Statistics and Report Highlights
2.3. Scope of the Comprehensive Study
2.3.1. Market Definition
2.3.2 Countries and Regions Covered
2.3.3 Research Objective
2.3.4 Units, Currency, and Conversions
2.3.5 Industry Value Chain
2.4. Key Market Segments
2.5. Key Companies
2.6. Study Period
Chapter 3. Strategic Analysis Review
3.1. Bilberry and Bilberry Products Pricing Analysis and Forecast
3.2. Porter’s Five Forces
3.3. Market Ecosystem
3.4. SWOT Analysis
3.5. Regulatory Scenario
3.3. Effects of Inflation, Russia-Ukraine War, moderating economic growth, and other macroeconomic factors
Chapter 4. Competitive Landscape
4.1. Market Share Analysis
4.1.1. Global Bilberry and Bilberry Products Market Share by Company, 2023
4.1.2. Product Offerings of Leading Bilberry and Bilberry Products Companies
4.2. Market Entropy
4.2.1. New Product Launches in the Industry
4.2.2. Mergers, Acquisitions, Joint ventures, and Partnerships
4.3. Key Strategies and Best Practices
Chapter 5. Global Market Projections: Best, Reference, and Low Case Scenarios
5.1. Growth Analysis- Case Scenario Definitions
5.2. Low Growth Case Scenario Forecasts
5.3. Reference Growth Case Scenario Forecasts
5.4. High Growth Case Scenario Forecasts
Chapter 6. Market Dynamics
6.1. Bilberry and Bilberry Products Market Drivers
6.2. Bilberry and Bilberry Products Market Challenges
6.6. Bilberry and Bilberry Products Market Opportunities
6.4. Bilberry and Bilberry Products Market Trends
Chapter 7. Global Bilberry and Bilberry Products Market Outlook Trends
7.1. Global Bilberry and Bilberry Products Revenue (USD Million) and CAGR (%) by Type (2021-2032)
7.2. Global Bilberry and Bilberry Products Revenue (USD Million) and CAGR (%) by Application (2021-2032)
7.3. Global Bilberry and Bilberry Products Revenue (USD Million) and CAGR (%) by Product (2021-2032)
By Type
Fresh Bilberry
Processed Bilberry
By Application
Nutraceuticals and Pharmaceuticals
Food and Beverages
Cosmetics
Others
Chapter 8. Global Bilberry and Bilberry Products Regional Analysis and Outlook
8.1. Global Bilberry and Bilberry Products Revenue (USD Million) By Regions (2021- 2032)
8.2. North America Bilberry and Bilberry Products Revenue (USD Million) by Country (2021-2032)
8.2.1. United States Bilberry and Bilberry Products Regional Analysis and Outlook
8.2.2. Canada Bilberry and Bilberry Products Regional Analysis and Outlook
8.2.3. Mexico Bilberry and Bilberry Products Regional Analysis and Outlook
8.3. Europe Bilberry and Bilberry Products Revenue (USD Million), by Country (2021-2032)
8.3.1. Germany Bilberry and Bilberry Products Regional Analysis and Outlook
8.3.2. France Bilberry and Bilberry Products Regional Analysis and Outlook
8.3.3. United Kingdom Bilberry and Bilberry Products Regional Analysis and Outlook
8.3.4. Spain Bilberry and Bilberry Products Regional Analysis and Outlook
8.3.5. Italy Bilberry and Bilberry Products Regional Analysis and Outlook
8.3.6. Russia Bilberry and Bilberry Products Regional Analysis and Outlook
8.3.7. Rest of Europe Bilberry and Bilberry Products Regional Analysis and Outlook
8.4. Asia Pacific Bilberry and Bilberry Products Revenue (USD Million) by Country (2021-2032)
8.4.1. China Bilberry and Bilberry Products Regional Analysis and Outlook
8.4.2. Japan Bilberry and Bilberry Products Regional Analysis and Outlook
8.4.3. India Bilberry and Bilberry Products Regional Analysis and Outlook
8.4.4. South Korea Bilberry and Bilberry Products Regional Analysis and Outlook
8.4.5. Australia Bilberry and Bilberry Products Regional Analysis and Outlook
8.4.6. South East Asia Bilberry and Bilberry Products Regional Analysis and Outlook
8.4.7. Rest of Asia Pacific Bilberry and Bilberry Products Regional Analysis and Outlook
8.5. South America Bilberry and Bilberry Products Revenue (USD Million), by Country (2021-2032)
8.5.1. Brazil Bilberry and Bilberry Products Regional Analysis and Outlook
8.5.2. Argentina Bilberry and Bilberry Products Regional Analysis and Outlook
8.5.3. Rest of South America Bilberry and Bilberry Products Regional Analysis and Outlook
8.6. Middle East and Africa Bilberry and Bilberry Products Revenue (USD Million) by Country (2021-2032)
8.6.1. Middle East Bilberry and Bilberry Products Regional Analysis and Outlook
8.6.2. Africa Bilberry and Bilberry Products Regional Analysis and Outlook
Chapter 9. North America Bilberry and Bilberry Products Analysis and Outlook
9.1. North America Bilberry and Bilberry Products Revenue (USD Million) by Segments (2021-2032)
9.1.1. North America Bilberry and Bilberry Products Revenue (USD Million) by Type (2021-2032)
9.1.2. North America Bilberry and Bilberry Products Revenue (USD Million) by Application (2021-2032)
9.1.3. North America Bilberry and Bilberry Products Revenue (USD Million) by Product (2021-2032)
By Type
Fresh Bilberry
Processed Bilberry
By Application
Nutraceuticals and Pharmaceuticals
Food and Beverages
Cosmetics
Others
Chapter 10. Europe Bilberry and Bilberry Products Analysis and Outlook
10.1. Europe Bilberry and Bilberry Products Revenue (USD Million), by Segments (USD Million) (2021-2032)
10.1.1. Europe Bilberry and Bilberry Products Revenue (USD Million) by Type (2021-2032)
10.1.2. Europe Bilberry and Bilberry Products Revenue (USD Million) by Application (2021-2032)
10.1.3. Europe Bilberry and Bilberry Products Revenue (USD Million) by Product (2021-2032)
By Type
Fresh Bilberry
Processed Bilberry
By Application
Nutraceuticals and Pharmaceuticals
Food and Beverages
Cosmetics
Others
Chapter 11. Asia Pacific Bilberry and Bilberry Products Analysis and Outlook
11.1. Asia Pacific Bilberry and Bilberry Products Revenue (USD Million), and Revenue (USD Million) by Segments (2021-2032)
11.1.1. Asia Pacific Bilberry and Bilberry Products Revenue (USD Million) by Type (2021-2032)
11.1.2. Asia Pacific Bilberry and Bilberry Products Revenue (USD Million) by Application (2021-2032)
11.1.3. Asia Pacific Bilberry and Bilberry Products Revenue (USD Million) by Product (2021-2032)
By Type
Fresh Bilberry
Processed Bilberry
By Application
Nutraceuticals and Pharmaceuticals
Food and Beverages
Cosmetics
Others
Chapter 12. South America Bilberry and Bilberry Products Analysis and Outlook
12.1. South America Bilberry and Bilberry Products Revenue (USD Million), by Segments (2021-2032)
12.1.1. South America Bilberry and Bilberry Products Revenue (USD Million) by Type (2021-2032)
12.1.2. South America Bilberry and Bilberry Products Revenue (USD Million) by Application (2021-2032)
12.1.3. South America Bilberry and Bilberry Products Revenue (USD Million) by Product (2021-2032)
By Type
Fresh Bilberry
Processed Bilberry
By Application
Nutraceuticals and Pharmaceuticals
Food and Beverages
Cosmetics
Others
Chapter 13. Middle East and Africa Bilberry and Bilberry Products Analysis and Outlook
13.1. Middle East and Africa Bilberry and Bilberry Products Revenue (USD Million), by Segments (2021-2032)
13.1.1. Middle East and Africa Bilberry and Bilberry Products Revenue (USD Million) by Type (2021-2032)
13.1.2. Middle East and Africa Bilberry and Bilberry Products Revenue (USD Million) by Application (2021-2032)
13.1.3. Middle East and Africa Bilberry and Bilberry Products Revenue (USD Million) by Product (2021-2032)
By Type
Fresh Bilberry
Processed Bilberry
By Application
Nutraceuticals and Pharmaceuticals
Food and Beverages
Cosmetics
Others
Chapter 14. Bilberry and Bilberry Products Company Profiles
14.1 Business Overview
14.2 Product Profiles
14.3 SWOT Profiles
14.5 Recent Developments
14.6 Financial Profile
List of Companies
General Nutrition Centers
Indena
Kiantama
Nature's Bounty
NOW Foods
Swanson
15. Methodology and Data Sources
15.1 Customization Offerings
15.2 Subscription Services
15.3 Related Reports
15.4 Publisher Expertise
LIST OF TABLES
Table 1 Market Segmentation Analysis
Table 2 Global Bilberry and Bilberry Products Market Share of Leading Companies, 2023
Table 3 Product Offerings of Leading Companies
Table 4 Low Growth Scenario Forecasts
Table 5 Reference Case Growth Scenario
Table 6 High Growth Case Scenario
Table 7 Global Bilberry and Bilberry Products Revenue (USD Million) And CAGR (%) By Type (2021-2032)
Table 8 Global Bilberry and Bilberry Products Revenue (USD Million) And CAGR (%) By Application (2021-2032)
Table 9 Global Bilberry and Bilberry Products Revenue (USD Million) And CAGR (%) By Product (2021-2032)
Table 10 Global Bilberry and Bilberry Products Market Revenue (USD Million) By Regions (2021-2032)
Table 11 Global Bilberry and Bilberry Products Market Share (%) By Regions (2021-2032)
Table 12 North America Bilberry and Bilberry Products Revenue (USD Million) By Country (2021-2032)
Table 13 Europe Bilberry and Bilberry Products Revenue (USD Million) By Country (2021-2032)
Table 14 Asia Pacific Bilberry and Bilberry Products Revenue (USD Million) By Country (2021-2032)
Table 15 South America Bilberry and Bilberry Products Revenue (USD Million) By Country (2021-2032)
Table 16 Middle East and Africa Bilberry and Bilberry Products Revenue (USD Million) By Region (2021-2032)
Table 17 North America Bilberry and Bilberry Products Revenue (USD Million) By Type (2021-2032)
Table 18 North America Bilberry and Bilberry Products Revenue (USD Million) By Application (2021-2032)
Table 19 North America Bilberry and Bilberry Products Revenue (USD Million) By Product (2021-2032)
Table 20 Europe Bilberry and Bilberry Products Revenue (USD Million) By Type (2021-2032)
Table 21 Europe Bilberry and Bilberry Products Revenue (USD Million) By Application (2021-2032)
Table 22 Europe Bilberry and Bilberry Products Revenue (USD Million) By Product (2021-2032)
Table 23 Asia Pacific Bilberry and Bilberry Products Revenue (USD Million) By Type (2021-2032)
Table 24 Asia Pacific Bilberry and Bilberry Products Revenue (USD Million) By Application (2021-2032)
Table 25 Asia Pacific Bilberry and Bilberry Products Revenue (USD Million) By Product (2021-2032)
Table 26 South America Bilberry and Bilberry Products Revenue (USD Million) By Type (2021-2032)
Table 27 South America Bilberry and Bilberry Products Revenue (USD Million) By Application (2021-2032)
Table 28 South America Bilberry and Bilberry Products Revenue (USD Million) By Product (2021-2032)
Table 29 Middle East and Africa Bilberry and Bilberry Products Revenue (USD Million) By Type (2021-2032)
Table 30 Middle East and Africa Bilberry and Bilberry Products Revenue (USD Million) By Application (2021-2032)
Table 31 Middle East and Africa Bilberry and Bilberry Products Revenue (USD Million) By Product (2021-2032)
LIST OF FIGURES
Figure 1. Market Scope
Figure 2. Pricing Forecasts Per Unit, 2023- 2032
Figure 3. Porter’s Five Forces
Figure 4. Global Bilberry and Bilberry Products Market Revenue (USD Million) By Regions (2021-2032)
Figure 5. Global Bilberry and Bilberry Products Market Share (%) By Regions (2023)
Figure 6. North America Bilberry and Bilberry Products Revenue (USD Million) By Country (2021-2032)
Figure 7. United States Bilberry and Bilberry Products Revenue (USD Million) By Country (2021-2032)
Figure 8. Canada Bilberry and Bilberry Products Revenue (USD Million) By Country (2021-2032)
Figure 9. Mexico Bilberry and Bilberry Products Revenue (USD Million) By Country (2021-2032)
Figure 10. Europe Bilberry and Bilberry Products Revenue (USD Million) By Country (2021-2032)
Figure 11. Germany Bilberry and Bilberry Products Revenue (USD Million) By Country (2021-2032)
Figure 12. France Bilberry and Bilberry Products Revenue (USD Million) By Country (2021-2032)
Figure 13. United Kingdom Bilberry and Bilberry Products Revenue (USD Million) By Country (2021-2032)
Figure 14. Spain Bilberry and Bilberry Products Revenue (USD Million) By Country (2021-2032)
Figure 15. Italy Bilberry and Bilberry Products Revenue (USD Million) By Country (2021-2032)
Figure 16. Russia Bilberry and Bilberry Products Revenue (USD Million) By Country (2021-2032)
Figure 17. Rest of Europe Bilberry and Bilberry Products Revenue (USD Million) By Country (2021-2032)
Figure 11. Asia Pacific Bilberry and Bilberry Products Revenue (USD Million) By Country (2021-2032)
Figure 12. China Bilberry and Bilberry Products Revenue (USD Million) By Country (2021-2032)
Figure 13. Japan Bilberry and Bilberry Products Revenue (USD Million) By Country (2021-2032)
Figure 14. India Bilberry and Bilberry Products Revenue (USD Million) By Country (2021-2032)
Figure 15. South Korea Bilberry and Bilberry Products Revenue (USD Million) By Country (2021-2032)
Figure 16. Australia Bilberry and Bilberry Products Revenue (USD Million) By Country (2021-2032)
Figure 17. South East Asia Bilberry and Bilberry Products Revenue (USD Million) By Country (2021-2032)
Figure 18. South America Bilberry and Bilberry Products Revenue (USD Million) By Country (2021-2032)
Figure 19. Brazil Bilberry and Bilberry Products Revenue (USD Million) By Country (2021-2032)
Figure 20. Argentina Bilberry and Bilberry Products Revenue (USD Million) By Country (2021-2032)
Figure 21. Rest of Asia Pacific Bilberry and Bilberry Products Revenue (USD Million) By Country (2021-2032)
Figure 22. Middle East and Africa Bilberry and Bilberry Products Revenue (USD Million) By Region (2021-2032)
Figure 23. Saudi Arabia Bilberry and Bilberry Products Revenue (USD Million) By Region (2021-2032)
Figure 24. The UAE Bilberry and Bilberry Products Revenue (USD Million) By Region (2021-2032)
Figure 25. Rest of Middle East Bilberry and Bilberry Products Revenue (USD Million) By Region (2021-2032)
Figure 26. South Africa Bilberry and Bilberry Products Revenue (USD Million) By Region (2021-2032)
Figure 27. Africa Bilberry and Bilberry Products Revenue (USD Million) By Region (2021-2032)
Figure 28. North America Bilberry and Bilberry Products Revenue (USD Million) By Type (2021-2032)
Figure 29. North America Bilberry and Bilberry Products Revenue (USD Million) By Application (2021-2032)
Figure 30. North America Bilberry and Bilberry Products Revenue (USD Million) By Product (2021-2032)
Figure 31. Europe Bilberry and Bilberry Products Revenue (USD Million) By Type (2021-2032)
Figure 32. Europe Bilberry and Bilberry Products Revenue (USD Million) By Application (2021-2032)
Figure 33. Europe Bilberry and Bilberry Products Revenue (USD Million) By Product (2021-2032)
Figure 34. Asia Pacific Bilberry and Bilberry Products Revenue (USD Million) By Type (2021-2032)
Figure 35. Asia Pacific Bilberry and Bilberry Products Revenue (USD Million) By Application (2021-2032)
Figure 36. Asia Pacific Bilberry and Bilberry Products Revenue (USD Million) By Product (2021-2032)
Figure 37. South America Bilberry and Bilberry Products Revenue (USD Million) By Type (2021-2032)
Figure 38. South America Bilberry and Bilberry Products Revenue (USD Million) By Application (2021-2032)
Figure 39. South America Bilberry and Bilberry Products Revenue (USD Million) By Product (2021-2032)
Figure 40. Middle East and Africa Bilberry and Bilberry Products Revenue (USD Million) By Type (2021-2032)
Figure 41. Middle East and Africa Bilberry and Bilberry Products Revenue (USD Million) By Application (2021-2032)
Figure 42. Middle East and Africa Bilberry and Bilberry Products Revenue (USD Million) By Product (2021-2032)
By Type
Fresh Bilberry
Processed Bilberry
By Application
Nutraceuticals and Pharmaceuticals
Food and Beverages
Cosmetics
Others
Countries Analyzed
North America (US, Canada, Mexico)
Europe (Germany, UK, France, Spain, Italy, Russia, Rest of Europe)
Asia Pacific (China, India, Japan, South Korea, Australia, South East Asia, Rest of Asia)
South America (Brazil, Argentina, Rest of South America)
Middle East and Africa (Saudi Arabia, UAE, Rest of Middle East, South Africa, Egypt, Rest of Africa)
