Bio-LNG Market Outlook 2023
1 Market Overview
1.1 Introduction to the Bio-LNG Market
1.2 Scope of the Study
1.3 Research Objective
1.3.1 Key Market Scope and Segments
1.3.2 Players Covered
1.3.3 Years Considered
2 Executive Summary
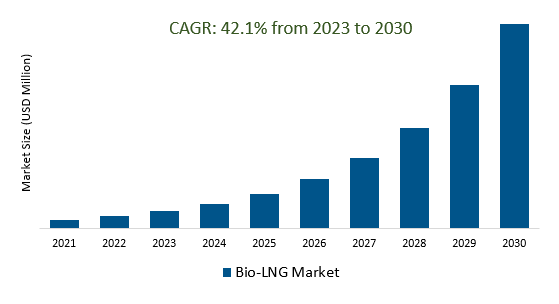
2.1 2023 Bio-LNG Industry- Market Statistics
3 Market Dynamics
3.1 Market Drivers
3.2 Market Challenges
3.3 Market Opportunities
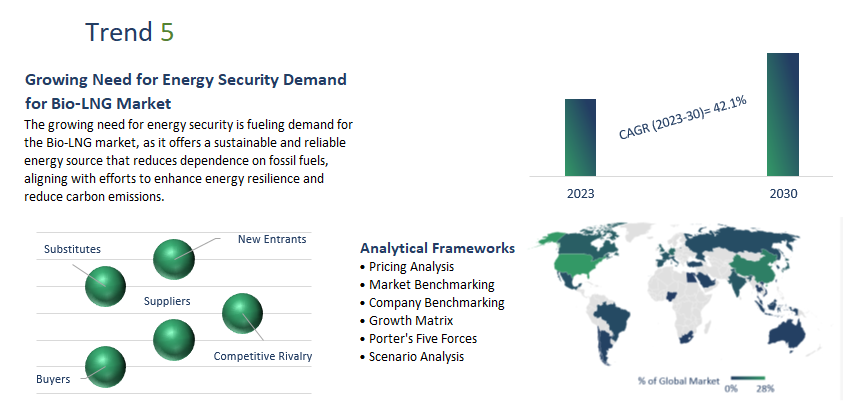
3.4 Market Trends
4 Market Factor Analysis
4.1 Porter’s Five Forces
4.2 Market Entropy
4.2.1 Global Bio-LNG Market Companies with Area Served
4.2.2 Products Offerings Global Bio-LNG Market
5 COVID-19 Impact Analysis and Outlook Scenarios
5.1.1 Covid-19 Impact Analysis
5.1.2 post-COVID-19 Scenario- Low Growth Case
5.1.3 post-COVID-19 Scenario- Reference Growth Case
5.1.4 post-COVID-19 Scenario- Low Growth Case
6 Global Bio-LNG Market Trends
6.1 Global Bio-LNG Revenue (USD Million) and CAGR (%) by Type (2018-2030)
6.2 Global Bio-LNG Revenue (USD Million) and CAGR (%) by Applications (2018-2030)
6.3 Global Bio-LNG Revenue (USD Million) and CAGR (%) by regions (2018-2030)
7 Global Bio-LNG Market Revenue (USD Million) by Type, and Applications (2018-2022)
7.1 Global Bio-LNG Revenue (USD Million) by Type (2018-2022)
7.1.1 Global Bio-LNG Revenue (USD Million), Market Share (%) by Type (2018-2022)
7.2 Global Bio-LNG Revenue (USD Million) by Applications (2018-2022)
7.2.1 Global Bio-LNG Revenue (USD Million), Market Share (%) by Applications (2018-2022)
8 Global Bio-LNG Development Regional Status and Outlook
8.1 Global Bio-LNG Revenue (USD Million) By Regions (2018-2022)
8.2 North America Bio-LNG Revenue (USD Million) by Type, and Application (2018-2022)
8.2.1 North America Bio-LNG Revenue (USD Million) by Country (2018-2022)
8.2.2 North America Bio-LNG Revenue (USD Million) by Type (2018-2022)
8.2.3 North America Bio-LNG Revenue (USD Million) by Applications (2018-2022)
8.3 Europe Bio-LNG Revenue (USD Million), by Type, and Applications (USD Million) (2018-2022)
8.3.1 Europe Bio-LNG Revenue (USD Million), by Country (2018-2022)
8.3.2 Europe Bio-LNG Revenue (USD Million) by Type (2018-2022)
8.3.3 Europe Bio-LNG Revenue (USD Million) by Applications (2018-2022)
8.4 Asia Pacific Bio-LNG Revenue (USD Million), and Revenue (USD Million) by Type, and Applications (2018-2022)
8.4.1 Asia Pacific Bio-LNG Revenue (USD Million) by Country (2018-2022)
8.4.2 Asia Pacific Bio-LNG Revenue (USD Million) by Type (2018-2022)
8.4.3 Asia Pacific Bio-LNG Revenue (USD Million) by Applications (2018-2022)
8.5 South America Bio-LNG Revenue (USD Million), by Type, and Applications (2018-2022)
8.5.1 South America Bio-LNG Revenue (USD Million), by Country (2018-2022)
8.5.2 South America Bio-LNG Revenue (USD Million) by Type (2018-2022)
8.5.3 South America Bio-LNG Revenue (USD Million) by Applications (2018-2022)
8.6 Middle East and Africa Bio-LNG Revenue (USD Million), by Type, Technology, Application, Thickness (2018-2022)
8.6.1 Middle East and Africa Bio-LNG Revenue (USD Million) by Country (2018-2022)
8.6.2 Middle East and Africa Bio-LNG Revenue (USD Million) by Type (2018-2022)
8.6.3 Middle East and Africa Bio-LNG Revenue (USD Million) by Applications (2018-2022)
9 Company Profiles
10 Global Bio-LNG Market Revenue (USD Million), by Type, and Applications (2023-2030)
10.1 Global Bio-LNG Revenue (USD Million) and Market Share (%) by Type (2023-2030)
10.1.1 Global Bio-LNG Revenue (USD Million), and Market Share (%) by Type (2023-2030)
10.2 Global Bio-LNG Revenue (USD Million) and Market Share (%) by Applications (2023-2030)
10.2.1 Global Bio-LNG Revenue (USD Million), and Market Share (%) by Applications (2023-2030)
11 Global Bio-LNG Development Regional Status and Outlook Forecast
11.1 Global Bio-LNG Revenue (USD Million) By Regions (2023-2030)
11.2 North America Bio-LNG Revenue (USD Million) by Type, and Applications (2023-2030)
11.2.1 North America Bio-LNG Revenue (USD) Million by Country (2023-2030)
11.2.2 North America Bio-LNG Revenue (USD Million), by Type (2023-2030)
11.2.3 North America Bio-LNG Revenue (USD Million), Market Share (%) by Applications (2023-2030)
11.3 Europe Bio-LNG Revenue (USD Million), by Type, and Applications (2023-2030)
11.3.1 Europe Bio-LNG Revenue (USD Million), by Country (2023-2030)
11.3.2 Europe Bio-LNG Revenue (USD Million), by Type (2023-2030)
11.3.3 Europe Bio-LNG Revenue (USD Million), by Applications (2023-2030)
11.4 Asia Pacific Bio-LNG Revenue (USD Million) by Type, and Applications (2023-2030)
11.4.1 Asia Pacific Bio-LNG Revenue (USD Million), by Country (2023-2030)
11.4.2 Asia Pacific Bio-LNG Revenue (USD Million), by Type (2023-2030)
11.4.3 Asia Pacific Bio-LNG Revenue (USD Million), by Applications (2023-2030)
11.5 South America Bio-LNG Revenue (USD Million), by Type, and Applications (2023-2030)
11.5.1 South America Bio-LNG Revenue (USD Million), by Country (2023-2030)
11.5.2 South America Bio-LNG Revenue (USD Million), by Type (2023-2030)
11.5.3 South America Bio-LNG Revenue (USD Million), by Applications (2023-2030)
11.6 Middle East and Africa Bio-LNG Revenue (USD Million), by Type, and Applications (2023-2030)
11.6.1 Middle East and Africa Bio-LNG Revenue (USD Million), by region (2023-2030)
11.6.2 Middle East and Africa Bio-LNG Revenue (USD Million), by Type (2023-2030)
11.6.3 Middle East and Africa Bio-LNG Revenue (USD Million), by Applications (2023-2030)
12 Methodology and Data Sources
12.1 Methodology/Research Approach
12.1.1 Research Programs/Design
12.1.2 Market Size Estimation
12.1.3 Market Breakdown and Data Triangulation
12.2 Data Sources
12.2.1 Secondary Sources
12.2.2 Primary Sources
12.3 Disclaimer
List of Tables
Table 1 Market Segmentation Analysis
Table 2 Global Bio-LNG Market Companies with Areas Served
Table 3 Products Offerings Global Bio-LNG Market
Table 4 Low Growth Scenario Forecasts
Table 5 Reference Case Growth Scenario
Table 6 High Growth Case Scenario
Table 7 Global Bio-LNG Revenue (USD Million) And CAGR (%) By Type (2018-2030)
Table 8 Global Bio-LNG Revenue (USD Million) And CAGR (%) By Applications (2018-2030)
Table 9 Global Bio-LNG Revenue (USD Million) And CAGR (%) By Regions (2018-2030)
Table 10 Global Bio-LNG Revenue (USD Million) By Type (2018-2022)
Table 11 Global Bio-LNG Revenue Market Share (%) By Type (2018-2022)
Table 12 Global Bio-LNG Revenue (USD Million) By Applications (2018-2022)
Table 13 Global Bio-LNG Revenue Market Share (%) By Applications (2018-2022)
Table 14 Global Bio-LNG Market Revenue (USD Million) By Regions (2018-2022)
Table 15 Global Bio-LNG Market Share (%) By Regions (2018-2022)
Table 16 North America Bio-LNG Revenue (USD Million) By Country (2018-2022)
Table 17 North America Bio-LNG Revenue (USD Million) By Type (2018-2022)
Table 18 North America Bio-LNG Revenue (USD Million) By Applications (2018-2022)
Table 19 Europe Bio-LNG Revenue (USD Million) By Country (2018-2022)
Table 20 Europe Bio-LNG Revenue (USD Million) By Type (2018-2022)
Table 21 Europe Bio-LNG Revenue (USD Million) By Applications (2018-2022)
Table 22 Asia Pacific Bio-LNG Revenue (USD Million) By Country (2018-2022)
Table 23 Asia Pacific Bio-LNG Revenue (USD Million) By Type (2018-2022)
Table 24 Asia Pacific Bio-LNG Revenue (USD Million) By Applications (2018-2022)
Table 25 South America Bio-LNG Revenue (USD Million) By Country (2018-2022)
Table 26 South America Bio-LNG Revenue (USD Million) By Type (2018-2022)
Table 27 South America Bio-LNG Revenue (USD Million) By Applications (2018-2022)
Table 28 Middle East and Africa Bio-LNG Revenue (USD Million) By Region (2018-2022)
Table 29 Middle East and Africa Bio-LNG Revenue (USD Million) By Type (2018-2022)
Table 30 Middle East and Africa Bio-LNG Revenue (USD Million) By Applications (2018-2022)
Table 31 Financial Analysis
Table 32 Global Bio-LNG Revenue (USD Million) By Type (2023-2030)
Table 33 Global Bio-LNG Revenue Market Share (%) By Type (2023-2030)
Table 34 Global Bio-LNG Revenue (USD Million) By Applications (2023-2030)
Table 35 Global Bio-LNG Revenue Market Share (%) By Applications (2023-2030)
Table 36 Global Bio-LNG Market Revenue (USD Million), And Revenue (USD Million) By Regions (2023-2030)
Table 37 North America Bio-LNG Revenue (USD)By Country (2023-2030)
Table 38 North America Bio-LNG Revenue (USD Million) By Type (2023-2030)
Table 39 North America Bio-LNG Revenue (USD Million) By Applications (2023-2030)
Table 40 Europe Bio-LNG Revenue (USD Million) By Country (2023-2030)
Table 41 Europe Bio-LNG Revenue (USD Million) By Type (2023-2030)
Table 42 Europe Bio-LNG Revenue (USD Million) By Applications (2023-2030)
Table 43 Asia Pacific Bio-LNG Revenue (USD Million) By Country (2023-2030)
Table 44 Asia Pacific Bio-LNG Revenue (USD Million) By Type (2023-2030)
Table 45 Asia Pacific Bio-LNG Revenue (USD Million) By Applications (2023-2030)
Table 46 South America Bio-LNG Revenue (USD Million) By Country (2023-2030)
Table 47 South America Bio-LNG Revenue (USD Million) By Type (2023-2030)
Table 48 South America Bio-LNG Revenue (USD Million) By Applications (2023-2030)
Table 49 Middle East and Africa Bio-LNG Revenue (USD Million) By Region (2023-2030)
Table 50 Middle East and Africa Bio-LNG Revenue (USD Million) By Region (2023-2030)
Table 51 Middle East and Africa Bio-LNG Revenue (USD Million) By Type (2023-2030)
Table 52 Middle East and Africa Bio-LNG Revenue (USD Million) By Applications (2023-2030)
Table 53 Research Programs/Design for This Report
Table 54 Key Data Information from Secondary Sources
Table 55 Key Data Information from Primary Sources
List of Figures
Figure 1 Market Scope
Figure 2 Porter’s Five Forces
Figure 3 Global Bio-LNG Revenue (USD Million) By Type (2018-2022)
Figure 4 Global Bio-LNG Revenue Market Share (%) By Type (2022)
Figure 5 Global Bio-LNG Revenue (USD Million) By Applications (2018-2022)
Figure 6 Global Bio-LNG Revenue Market Share (%) By Applications (2022)
Figure 7 Global Bio-LNG Market Revenue (USD Million) By Regions (2018-2022)
Figure 8 Global Bio-LNG Market Share (%) By Regions (2022)
Figure 9 North America Bio-LNG Revenue (USD Million) By Country (2018-2022)
Figure 10 North America Bio-LNG Revenue (USD Million) By Type (2018-2022)
Figure 11 North America Bio-LNG Revenue (USD Million) By Applications (2018-2022)
Figure 12 Europe Bio-LNG Revenue (USD Million) By Country (2018-2022)
Figure 13 Europe Bio-LNG Revenue (USD Million) By Type (2018-2022)
Figure 14 Europe Bio-LNG Revenue (USD Million) By Applications (2018-2022)
Figure 15 Asia Pacific Bio-LNG Revenue (USD Million) By Country (2018-2022)
Figure 16 Asia Pacific Bio-LNG Revenue (USD Million) By Type (2018-2022)
Figure 17 Asia Pacific Bio-LNG Revenue (USD Million) By Applications (2018-2022)
Figure 18 South America Bio-LNG Revenue (USD Million) By Country (2018-2022)
Figure 19 South America Bio-LNG Revenue (USD Million) By Type (2018-2022)
Figure 20 South America Bio-LNG Revenue (USD Million) By Applications (2018-2022)
Figure 21 Middle East and Africa Bio-LNG Revenue (USD Million) By Region (2018-2022)
Figure 22 Middle East and Africa Bio-LNG Revenue (USD Million) By Type (2018-2022)
Figure 23 Middle East and Africa Bio-LNG Revenue (USD Million) By Applications (2018-2022)
Figure 24 Global Bio-LNG Revenue (USD Million) By Type (2023-2030)
Figure 25 Global Bio-LNG Revenue Market Share (%) By Type (2030)
Figure 26 Global Bio-LNG Revenue (USD Million) By Applications (2023-2030)
Figure 27 Global Bio-LNG Revenue Market Share (%) By Applications (2030)
Figure 28 Global Bio-LNG Market Revenue (USD Million) By Regions (2023-2030)
Figure 29 North America Bio-LNG Revenue (USD Million) By Country (2023-2030)
Figure 30 North America Bio-LNG Revenue (USD Million) By Type (2023-2030)
Figure 31 North America Bio-LNG Revenue (USD Million) By Applications (2023-2030)
Figure 32 Europe Bio-LNG Revenue (USD Million) By Country (2023-2030)
Figure 33 Europe Bio-LNG Revenue (USD Million) By Type (2023-2030)
Figure 34 Europe Bio-LNG Revenue (USD Million) By Applications (2023-2030)
Figure 35 Asia Pacific Bio-LNG Revenue (USD Million) By Country (2023-2030)
Figure 36 Asia Pacific Bio-LNG Revenue (USD Million) By Type (2023-2030)
Figure 37 Asia Pacific Bio-LNG Revenue (USD Million) By Applications (2023-2030)
Figure 38 South America Bio-LNG Revenue (USD Million) By Country (2023-2030)
Figure 39 South America Bio-LNG Revenue (USD Million) By Type (2023-2030)
Figure 40 South America Bio-LNG Revenue (USD Million) By Applications (2023-2030)
Figure 41 Middle East and Africa Bio-LNG Revenue (USD Million) By Region (2023-2030)
Figure 42 Middle East and Africa Bio-LNG Revenue (USD Million) By Region (2023-2030)
Figure 43 Middle East and Africa Bio-LNG Revenue (USD Million) By Type (2023-2030)
Figure 44 Middle East and Africa Bio-LNG Revenue (USD Million) By Applications (2023-2030)
Figure 45 Bottom-Up and Top-Down Approaches for This Report
Figure 46 Data Triangulation