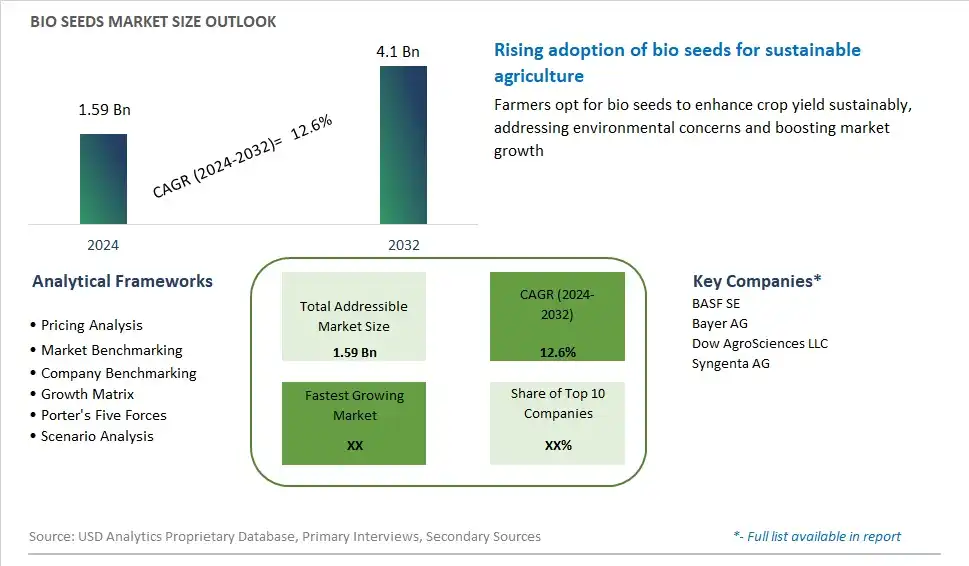
Global Bio Seeds Market Size is valued at $1.59 Billion in 2024 and is forecast to register a growth rate (CAGR) of 12.6% to reach $4.1 Billion by 2032.
The global Bio Seeds Market Comprehensive Study analyzes and forecasts the market size across 6 regions and 24 countries for diverse segments -By Trait (Herbicide Tolerant, Insect Resistant, Others), By Crop (Soya bean, Maize Cotton, Canola, Sugar Beet, Others)
An Introduction to Bio Seeds Market
The bio seeds market in 2024 is growing rapidly, driven by the increasing adoption of sustainable agriculture practices and the rising demand for organic food products. Bio seeds, which include organic, non-GMO, and heirloom varieties, are developed through natural breeding techniques without the use of genetic modification. These seeds are favored by farmers and gardeners aiming to produce crops with enhanced nutritional profiles, better taste, and improved resistance to pests and diseases. The market is supported by government initiatives promoting sustainable farming, consumer awareness about the benefits of organic foods, and the overall trend towards health and environmental consciousness. Innovations in seed technology and distribution are also making bio seeds more accessible to a broader range of agricultural producers.
Bio Seeds Competitive Landscape
The market report analyses the leading companies in the industry including BASF SE, Bayer AG, Dow AgroSciences LLC, Syngenta AG, and Others.
Bio Seeds Market Dynamics
Bio Seeds Market Trend: Growing Demand for Sustainable and Organic Farming Practices
One of the most prominent trends in the bio seeds market is the growing demand for sustainable and organic farming practices. Consumers and farmers alike are increasingly prioritizing environmental sustainability and the health benefits of organic produce. This trend is driven by a heightened awareness of the negative impacts of conventional farming methods, such as pesticide use and soil degradation, on the environment and human health. Bio seeds, which are non-GMO and often certified organic, align with these values by promoting biodiversity, improving soil health, and reducing the reliance on chemical inputs. As a result, there is a significant increase in the adoption of bio seeds by farmers seeking to meet the rising consumer demand for organic and sustainably grown products. This trend is further supported by government policies and incentives aimed at encouraging organic farming and sustainable agricultural practices.
Market Driver: Increasing Health Awareness and Demand for Nutritious Food
The primary driver of the bio seeds market is the increasing health awareness and demand for nutritious food. As consumers become more informed about the links between diet, health, and wellness, there is a growing preference for foods that are perceived as healthier and safer. Bio seeds, which produce crops free from synthetic pesticides and fertilizers, are seen as a key component in achieving a healthier diet. This demand for nutritious and safe food is driving farmers to adopt bio seeds to produce high-quality crops that can command a premium price in the market. Additionally, the rise of chronic health issues such as obesity, diabetes, and cardiovascular diseases has prompted consumers to seek out food products that are not only safe but also rich in essential nutrients. This health consciousness is a significant factor propelling the growth of the bio seeds market, as consumers increasingly seek out organic produce as part of a healthier lifestyle.
Market Opportunity: Expansion into Emerging Markets
A significant opportunity for the bio seeds market lies in expansion into emerging markets. Regions such as Asia-Pacific, Latin America, and Africa are witnessing rapid urbanization, economic growth, and a burgeoning middle class with increasing disposable incomes. These demographic shifts are leading to a greater demand for high-quality, nutritious, and safe food products. By introducing bio seeds into these emerging markets, companies can tap into the growing consumer base that is becoming more health-conscious and environmentally aware. Furthermore, many of these regions have agricultural sectors that are looking to improve productivity and sustainability. Bio seeds offer a viable solution by enhancing crop yields, improving resistance to pests and diseases, and promoting sustainable farming practices. Investing in local production facilities, distribution networks, and farmer education programs can facilitate market entry and growth in these regions. This strategic expansion can significantly boost the global footprint of bio seed companies and drive substantial market growth.
Bio Seeds Market Share Analysis: Herbicide Tolerant held the dominant market share in 2024
Herbicide tolerant is the largest segment in the bio seeds market due to its widespread adoption by farmers seeking efficient weed management solutions. Herbicide-tolerant bio seeds are genetically engineered to withstand the application of specific herbicides, allowing farmers to control weeds while preserving crop yields. This trait offers farmers greater flexibility in weed control practices, reducing the need for manual labor and minimizing crop damage from weed competition. Additionally, herbicide-tolerant bio seeds contribute to sustainable agricultural practices by enabling the use of less toxic herbicides and reducing overall chemical usage in farming operations. The proven effectiveness and economic benefits of herbicide-tolerant bio seeds have propelled their dominance in the bio seeds market, as farmers prioritize traits that enhance productivity and profitability while minimizing environmental impact. As the demand for sustainable agriculture solutions continues to grow, the herbicide-tolerant segment is expected to maintain its leadership position in the bio seeds market.
Bio Seeds Market Share Analysis: Soybean market is poised to register the fastest growth rae over the forecast period to 2032
Soybean is the fastest-growing segment in the bio seeds market, fueled by increasing demand for sustainable protein sources and the versatility of soybeans in various applications. Soybeans are a key crop for bio seeds due to their high protein content, which makes them valuable for animal feed, human consumption, and industrial uses such as biodiesel production. The growing awareness of the environmental benefits associated with biofuels and plant-based protein sources has led to heightened interest in soybean cultivation. Additionally, advancements in biotechnology have enabled the development of genetically modified soybean varieties with traits such as herbicide tolerance and insect resistance, further driving adoption among farmers. As global populations continue to grow and demand for sustainable food and fuel sources rises, the soybean segment is expected to experience rapid growth in the bio seeds market.
Bio Seeds Market Segmentation
By Trait
Herbicide Tolerant
Insect Resistant
Others
By Crop
Soya bean
Maize Cotton
Canola
Sugar Beet
Others
Countries Analyzed
North America (US, Canada, Mexico)
Europe (Germany, UK, France, Spain, Italy, Russia, Rest of Europe)
Asia Pacific (China, India, Japan, South Korea, Australia, South East Asia, Rest of Asia)
South America (Brazil, Argentina, Rest of South America)
Middle East and Africa (Saudi Arabia, UAE, Rest of Middle East, South Africa, Egypt, Rest of Africa)
Bio Seeds Companies Profiled in the Study
BASF SE
Bayer AG
Dow AgroSciences LLC
Syngenta AG
*- List Not Exhaustive
Chapter 1. TABLE OF CONTENTS
Chapter 2. Introduction to Bio Seeds Market
2.1. Market Overview
2.2. Key Statistics and Report Highlights
2.3. Scope of the Comprehensive Study
2.3.1. Market Definition
2.3.2 Countries and Regions Covered
2.3.3 Research Objective
2.3.4 Units, Currency, and Conversions
2.3.5 Industry Value Chain
2.4. Key Market Segments
2.5. Key Companies
2.6. Study Period
Chapter 3. Strategic Analysis Review
3.1. Bio Seeds Pricing Analysis and Forecast
3.2. Porter’s Five Forces
3.3. Market Ecosystem
3.4. SWOT Analysis
3.5. Regulatory Scenario
3.3. Effects of Inflation, Russia-Ukraine War, moderating economic growth, and other macroeconomic factors
Chapter 4. Competitive Landscape
4.1. Market Share Analysis
4.1.1. Global Bio Seeds Market Share by Company, 2023
4.1.2. Product Offerings of Leading Bio Seeds Companies
4.2. Market Entropy
4.2.1. New Product Launches in the Industry
4.2.2. Mergers, Acquisitions, Joint ventures, and Partnerships
4.3. Key Strategies and Best Practices
Chapter 5. Global Market Projections: Best, Reference, and Low Case Scenarios
5.1. Growth Analysis- Case Scenario Definitions
5.2. Low Growth Case Scenario Forecasts
5.3. Reference Growth Case Scenario Forecasts
5.4. High Growth Case Scenario Forecasts
Chapter 6. Market Dynamics
6.1. Bio Seeds Market Drivers
6.2. Bio Seeds Market Challenges
6.6. Bio Seeds Market Opportunities
6.4. Bio Seeds Market Trends
Chapter 7. Global Bio Seeds Market Outlook Trends
7.1. Global Bio Seeds Revenue (USD Million) and CAGR (%) by Type (2021-2032)
7.2. Global Bio Seeds Revenue (USD Million) and CAGR (%) by Application (2021-2032)
7.3. Global Bio Seeds Revenue (USD Million) and CAGR (%) by Product (2021-2032)
By Trait
Herbicide Tolerant
Insect Resistant
Others
By Crop
Soya bean
Maize Cotton
Canola
Sugar Beet
Others
Chapter 8. Global Bio Seeds Regional Analysis and Outlook
8.1. Global Bio Seeds Revenue (USD Million) By Regions (2021- 2032)
8.2. North America Bio Seeds Revenue (USD Million) by Country (2021-2032)
8.2.1. United States Bio Seeds Regional Analysis and Outlook
8.2.2. Canada Bio Seeds Regional Analysis and Outlook
8.2.3. Mexico Bio Seeds Regional Analysis and Outlook
8.3. Europe Bio Seeds Revenue (USD Million), by Country (2021-2032)
8.3.1. Germany Bio Seeds Regional Analysis and Outlook
8.3.2. France Bio Seeds Regional Analysis and Outlook
8.3.3. United Kingdom Bio Seeds Regional Analysis and Outlook
8.3.4. Spain Bio Seeds Regional Analysis and Outlook
8.3.5. Italy Bio Seeds Regional Analysis and Outlook
8.3.6. Russia Bio Seeds Regional Analysis and Outlook
8.3.7. Rest of Europe Bio Seeds Regional Analysis and Outlook
8.4. Asia Pacific Bio Seeds Revenue (USD Million) by Country (2021-2032)
8.4.1. China Bio Seeds Regional Analysis and Outlook
8.4.2. Japan Bio Seeds Regional Analysis and Outlook
8.4.3. India Bio Seeds Regional Analysis and Outlook
8.4.4. South Korea Bio Seeds Regional Analysis and Outlook
8.4.5. Australia Bio Seeds Regional Analysis and Outlook
8.4.6. South East Asia Bio Seeds Regional Analysis and Outlook
8.4.7. Rest of Asia Pacific Bio Seeds Regional Analysis and Outlook
8.5. South America Bio Seeds Revenue (USD Million), by Country (2021-2032)
8.5.1. Brazil Bio Seeds Regional Analysis and Outlook
8.5.2. Argentina Bio Seeds Regional Analysis and Outlook
8.5.3. Rest of South America Bio Seeds Regional Analysis and Outlook
8.6. Middle East and Africa Bio Seeds Revenue (USD Million) by Country (2021-2032)
8.6.1. Middle East Bio Seeds Regional Analysis and Outlook
8.6.2. Africa Bio Seeds Regional Analysis and Outlook
Chapter 9. North America Bio Seeds Analysis and Outlook
9.1. North America Bio Seeds Revenue (USD Million) by Segments (2021-2032)
9.1.1. North America Bio Seeds Revenue (USD Million) by Type (2021-2032)
9.1.2. North America Bio Seeds Revenue (USD Million) by Application (2021-2032)
9.1.3. North America Bio Seeds Revenue (USD Million) by Product (2021-2032)
By Trait
Herbicide Tolerant
Insect Resistant
Others
By Crop
Soya bean
Maize Cotton
Canola
Sugar Beet
Others
Chapter 10. Europe Bio Seeds Analysis and Outlook
10.1. Europe Bio Seeds Revenue (USD Million), by Segments (USD Million) (2021-2032)
10.1.1. Europe Bio Seeds Revenue (USD Million) by Type (2021-2032)
10.1.2. Europe Bio Seeds Revenue (USD Million) by Application (2021-2032)
10.1.3. Europe Bio Seeds Revenue (USD Million) by Product (2021-2032)
By Trait
Herbicide Tolerant
Insect Resistant
Others
By Crop
Soya bean
Maize Cotton
Canola
Sugar Beet
Others
Chapter 11. Asia Pacific Bio Seeds Analysis and Outlook
11.1. Asia Pacific Bio Seeds Revenue (USD Million), and Revenue (USD Million) by Segments (2021-2032)
11.1.1. Asia Pacific Bio Seeds Revenue (USD Million) by Type (2021-2032)
11.1.2. Asia Pacific Bio Seeds Revenue (USD Million) by Application (2021-2032)
11.1.3. Asia Pacific Bio Seeds Revenue (USD Million) by Product (2021-2032)
By Trait
Herbicide Tolerant
Insect Resistant
Others
By Crop
Soya bean
Maize Cotton
Canola
Sugar Beet
Others
Chapter 12. South America Bio Seeds Analysis and Outlook
12.1. South America Bio Seeds Revenue (USD Million), by Segments (2021-2032)
12.1.1. South America Bio Seeds Revenue (USD Million) by Type (2021-2032)
12.1.2. South America Bio Seeds Revenue (USD Million) by Application (2021-2032)
12.1.3. South America Bio Seeds Revenue (USD Million) by Product (2021-2032)
By Trait
Herbicide Tolerant
Insect Resistant
Others
By Crop
Soya bean
Maize Cotton
Canola
Sugar Beet
Others
Chapter 13. Middle East and Africa Bio Seeds Analysis and Outlook
13.1. Middle East and Africa Bio Seeds Revenue (USD Million), by Segments (2021-2032)
13.1.1. Middle East and Africa Bio Seeds Revenue (USD Million) by Type (2021-2032)
13.1.2. Middle East and Africa Bio Seeds Revenue (USD Million) by Application (2021-2032)
13.1.3. Middle East and Africa Bio Seeds Revenue (USD Million) by Product (2021-2032)
By Trait
Herbicide Tolerant
Insect Resistant
Others
By Crop
Soya bean
Maize Cotton
Canola
Sugar Beet
Others
Chapter 14. Bio Seeds Company Profiles
14.1 Business Overview
14.2 Product Profiles
14.3 SWOT Profiles
14.5 Recent Developments
14.6 Financial Profile
List of Companies
BASF SE
Bayer AG
Dow AgroSciences LLC
Syngenta AG
15. Methodology and Data Sources
15.1 Customization Offerings
15.2 Subscription Services
15.3 Related Reports
15.4 Publisher Expertise
LIST OF TABLES
Table 1 Market Segmentation Analysis
Table 2 Global Bio Seeds Market Share of Leading Companies, 2023
Table 3 Product Offerings of Leading Companies
Table 4 Low Growth Scenario Forecasts
Table 5 Reference Case Growth Scenario
Table 6 High Growth Case Scenario
Table 7 Global Bio Seeds Revenue (USD Million) And CAGR (%) By Type (2021-2032)
Table 8 Global Bio Seeds Revenue (USD Million) And CAGR (%) By Application (2021-2032)
Table 9 Global Bio Seeds Revenue (USD Million) And CAGR (%) By Product (2021-2032)
Table 10 Global Bio Seeds Market Revenue (USD Million) By Regions (2021-2032)
Table 11 Global Bio Seeds Market Share (%) By Regions (2021-2032)
Table 12 North America Bio Seeds Revenue (USD Million) By Country (2021-2032)
Table 13 Europe Bio Seeds Revenue (USD Million) By Country (2021-2032)
Table 14 Asia Pacific Bio Seeds Revenue (USD Million) By Country (2021-2032)
Table 15 South America Bio Seeds Revenue (USD Million) By Country (2021-2032)
Table 16 Middle East and Africa Bio Seeds Revenue (USD Million) By Region (2021-2032)
Table 17 North America Bio Seeds Revenue (USD Million) By Type (2021-2032)
Table 18 North America Bio Seeds Revenue (USD Million) By Application (2021-2032)
Table 19 North America Bio Seeds Revenue (USD Million) By Product (2021-2032)
Table 20 Europe Bio Seeds Revenue (USD Million) By Type (2021-2032)
Table 21 Europe Bio Seeds Revenue (USD Million) By Application (2021-2032)
Table 22 Europe Bio Seeds Revenue (USD Million) By Product (2021-2032)
Table 23 Asia Pacific Bio Seeds Revenue (USD Million) By Type (2021-2032)
Table 24 Asia Pacific Bio Seeds Revenue (USD Million) By Application (2021-2032)
Table 25 Asia Pacific Bio Seeds Revenue (USD Million) By Product (2021-2032)
Table 26 South America Bio Seeds Revenue (USD Million) By Type (2021-2032)
Table 27 South America Bio Seeds Revenue (USD Million) By Application (2021-2032)
Table 28 South America Bio Seeds Revenue (USD Million) By Product (2021-2032)
Table 29 Middle East and Africa Bio Seeds Revenue (USD Million) By Type (2021-2032)
Table 30 Middle East and Africa Bio Seeds Revenue (USD Million) By Application (2021-2032)
Table 31 Middle East and Africa Bio Seeds Revenue (USD Million) By Product (2021-2032)
LIST OF FIGURES
Figure 1. Market Scope
Figure 2. Pricing Forecasts Per Unit, 2023- 2032
Figure 3. Porter’s Five Forces
Figure 4. Global Bio Seeds Market Revenue (USD Million) By Regions (2021-2032)
Figure 5. Global Bio Seeds Market Share (%) By Regions (2023)
Figure 6. North America Bio Seeds Revenue (USD Million) By Country (2021-2032)
Figure 7. United States Bio Seeds Revenue (USD Million) By Country (2021-2032)
Figure 8. Canada Bio Seeds Revenue (USD Million) By Country (2021-2032)
Figure 9. Mexico Bio Seeds Revenue (USD Million) By Country (2021-2032)
Figure 10. Europe Bio Seeds Revenue (USD Million) By Country (2021-2032)
Figure 11. Germany Bio Seeds Revenue (USD Million) By Country (2021-2032)
Figure 12. France Bio Seeds Revenue (USD Million) By Country (2021-2032)
Figure 13. United Kingdom Bio Seeds Revenue (USD Million) By Country (2021-2032)
Figure 14. Spain Bio Seeds Revenue (USD Million) By Country (2021-2032)
Figure 15. Italy Bio Seeds Revenue (USD Million) By Country (2021-2032)
Figure 16. Russia Bio Seeds Revenue (USD Million) By Country (2021-2032)
Figure 17. Rest of Europe Bio Seeds Revenue (USD Million) By Country (2021-2032)
Figure 11. Asia Pacific Bio Seeds Revenue (USD Million) By Country (2021-2032)
Figure 12. China Bio Seeds Revenue (USD Million) By Country (2021-2032)
Figure 13. Japan Bio Seeds Revenue (USD Million) By Country (2021-2032)
Figure 14. India Bio Seeds Revenue (USD Million) By Country (2021-2032)
Figure 15. South Korea Bio Seeds Revenue (USD Million) By Country (2021-2032)
Figure 16. Australia Bio Seeds Revenue (USD Million) By Country (2021-2032)
Figure 17. South East Asia Bio Seeds Revenue (USD Million) By Country (2021-2032)
Figure 18. South America Bio Seeds Revenue (USD Million) By Country (2021-2032)
Figure 19. Brazil Bio Seeds Revenue (USD Million) By Country (2021-2032)
Figure 20. Argentina Bio Seeds Revenue (USD Million) By Country (2021-2032)
Figure 21. Rest of Asia Pacific Bio Seeds Revenue (USD Million) By Country (2021-2032)
Figure 22. Middle East and Africa Bio Seeds Revenue (USD Million) By Region (2021-2032)
Figure 23. Saudi Arabia Bio Seeds Revenue (USD Million) By Region (2021-2032)
Figure 24. The UAE Bio Seeds Revenue (USD Million) By Region (2021-2032)
Figure 25. Rest of Middle East Bio Seeds Revenue (USD Million) By Region (2021-2032)
Figure 26. South Africa Bio Seeds Revenue (USD Million) By Region (2021-2032)
Figure 27. Africa Bio Seeds Revenue (USD Million) By Region (2021-2032)
Figure 28. North America Bio Seeds Revenue (USD Million) By Type (2021-2032)
Figure 29. North America Bio Seeds Revenue (USD Million) By Application (2021-2032)
Figure 30. North America Bio Seeds Revenue (USD Million) By Product (2021-2032)
Figure 31. Europe Bio Seeds Revenue (USD Million) By Type (2021-2032)
Figure 32. Europe Bio Seeds Revenue (USD Million) By Application (2021-2032)
Figure 33. Europe Bio Seeds Revenue (USD Million) By Product (2021-2032)
Figure 34. Asia Pacific Bio Seeds Revenue (USD Million) By Type (2021-2032)
Figure 35. Asia Pacific Bio Seeds Revenue (USD Million) By Application (2021-2032)
Figure 36. Asia Pacific Bio Seeds Revenue (USD Million) By Product (2021-2032)
Figure 37. South America Bio Seeds Revenue (USD Million) By Type (2021-2032)
Figure 38. South America Bio Seeds Revenue (USD Million) By Application (2021-2032)
Figure 39. South America Bio Seeds Revenue (USD Million) By Product (2021-2032)
Figure 40. Middle East and Africa Bio Seeds Revenue (USD Million) By Type (2021-2032)
Figure 41. Middle East and Africa Bio Seeds Revenue (USD Million) By Application (2021-2032)
Figure 42. Middle East and Africa Bio Seeds Revenue (USD Million) By Product (2021-2032)
By Trait
Herbicide Tolerant
Insect Resistant
Others
By Crop
Soya bean
Maize Cotton
Canola
Sugar Beet
Others
Countries Analyzed
North America (US, Canada, Mexico)
Europe (Germany, UK, France, Spain, Italy, Russia, Rest of Europe)
Asia Pacific (China, India, Japan, South Korea, Australia, South East Asia, Rest of Asia)
South America (Brazil, Argentina, Rest of South America)
Middle East and Africa (Saudi Arabia, UAE, Rest of Middle East, South Africa, Egypt, Rest of Africa)
