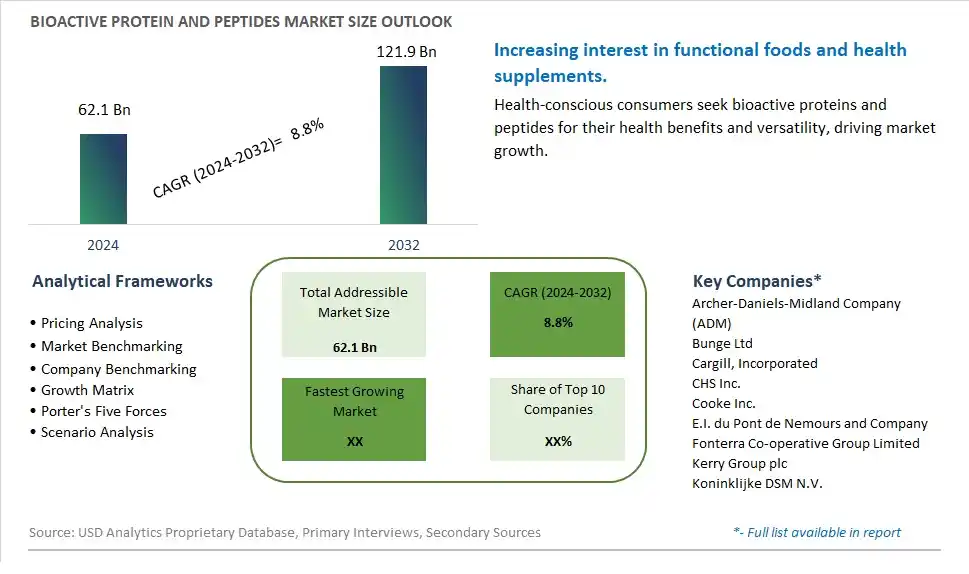
Global Bioactive Protein and Peptides Market Size is valued at $62.1 Billion in 2024 and is forecast to register a growth rate (CAGR) of 8.8% to reach $121.9 Billion by 2032.
The global Bioactive Protein and Peptides Market Comprehensive Study analyzes and forecasts the market size across 6 regions and 24 countries for diverse segments -By Source (Animal, -Dairy, -Egg & Meat, -Gelatin, -Seafood, Plant, -Cereals , -Legumes, -Pseudo cereals, -Brasssicaceae species, -Others), By Application (Functional Food, Functional Beverages, Dietary Supplements, Animal Nutrition, Personal Care, Others)
An Introduction to Bioactive Protein and Peptides Market
In 2024, the Bioactive Protein and Peptides market is witnessing robust growth, driven by the increasing demand for functional ingredients that offer health benefits beyond basic nutrition. Bioactive proteins and peptides, derived from various sources such as dairy, plants, and marine organisms, are known for their roles in supporting muscle health, immune function, and metabolic health. The market is supported by the growing interest in functional foods, dietary supplements, and sports nutrition products. Advances in extraction and processing technologies are enhancing the bioavailability, stability, and efficacy of bioactive proteins and peptides. The market is also benefiting from the trend towards personalized nutrition and the rising awareness of preventive health measures.
Bioactive Protein and Peptides Competitive Landscape
The market report analyses the leading companies in the industry including Archer-Daniels-Midland Company (ADM), Bunge Ltd, Cargill, Incorporated, CHS Inc., Cooke Inc., E.I. du Pont de Nemours and Company, Fonterra Co-operative Group Limited, Kerry Group plc, Koninklijke DSM N.V., and Others.
Bioactive Protein and Peptides Market Dynamics
Bioactive Protein and Peptides Market Trend: Growing Interest in Functional Foods and Nutraceuticals
The most prominent market trend for Bioactive Protein and Peptides is the growing interest in functional foods and nutraceuticals. Consumers are increasingly seeking food products that offer additional health benefits beyond basic nutrition, driving the demand for bioactive ingredients like proteins and peptides. These bioactive compounds have demonstrated various health-promoting properties, such as antioxidant, anti-inflammatory, immune-modulatory, and metabolic effects. As a result, there is a rising trend towards incorporating bioactive proteins and peptides into food and beverage formulations to create functional products that support overall health and well-being.
Bioactive Protein and Peptides Market Driver: Health and Wellness Conscious Consumer Preferences
A key market driver for Bioactive Protein and Peptides is the health and wellness-conscious consumer preferences. With growing concerns about health issues such as obesity, diabetes, cardiovascular diseases, and aging-related conditions, consumers are actively seeking food choices that contribute positively to their health outcomes. Bioactive proteins and peptides are perceived as natural, bioavailable, and beneficial ingredients that can help address specific health concerns, enhance physical performance, promote muscle recovery, and support healthy aging. The driver of health and wellness-conscious consumer preferences fuels the demand for bioactive protein and peptide products across various market segments.
Bioactive Protein and Peptides Market Opportunity: Innovation in Product Development and Functional Ingredients
A potential opportunity within the Bioactive Protein and Peptides market lies in innovation in product development and functional ingredients. Collaborating with research institutions, food scientists, and ingredient suppliers can lead to the discovery and development of novel bioactive proteins and peptides with enhanced bioactivity, stability, and functionality. Furthermore, exploring opportunities to combine bioactive proteins and peptides with other functional ingredients, such as vitamins, minerals, probiotics, prebiotics, and plant-based extracts, can create synergistic formulations that offer comprehensive health benefits and meet evolving consumer demands for holistic wellness solutions. By focusing on innovation in product development and functional ingredients, there are opportunities to create value-added bioactive protein and peptide products, differentiate offerings in the market, and capitalize on the growing demand for functional foods and nutraceuticals.
Bioactive Protein and Peptides Market Share Analysis: Animal - Dairy segment generated the highest revenue share in the industry
In the Bioactive Protein and Peptides Market, the largest segment is Animal - Dairy. This segment encompasses proteins and peptides derived from dairy sources such as milk and its derivatives like whey and casein. The fast growth of the Animal - Dairy segment can be attributed to several factors. Firstly, dairy proteins are rich in essential amino acids and bioactive peptides that offer numerous health benefits, including muscle growth, immune support, and improved bone health. Additionally, the widespread availability of dairy products globally and their incorporation into various food and beverage applications contribute to the dominance of this segment. Further, the rising demand for functional foods and nutritional supplements fortified with dairy-derived proteins and peptides further drives the growth of the Animal - Dairy segment in the Bioactive Protein and Peptides Market.
Bioactive Protein and Peptides Market Share Analysis: Functional Food is the fastest growing segment over the forecast period to 2032
Within the Bioactive Protein and Peptides Market, the Functional Food segment is anticipated to be the fastest growing up to 2032. The rapid growth of bioactive proteins and peptides in functional foods can be attributed to several key factors. Firstly, there is a growing consumer awareness and interest in adopting healthier lifestyles, leading to increased demand for functional foods that offer specific health benefits beyond basic nutrition. Bioactive proteins and peptides derived from various sources such as dairy, plant, and animal sources are incorporated into functional foods to provide benefits such as improved digestion, cardiovascular health, immune support, and weight management. Additionally, advancements in food technology and formulation have enabled the development of innovative functional food products that cater to diverse consumer needs and preferences. Further, regulatory support and endorsements from health authorities regarding the efficacy and safety of bioactive proteins and peptides in functional foods further contribute to the rapid growth of the Functional Food segment in the Bioactive Protein and Peptides Market. As a result, this segment presents significant growth opportunities for manufacturers and stakeholders in the coming years.
Bioactive Protein and Peptides Market Segmentation
By Source
Animal
-Dairy
-Egg & Meat
-Gelatin
-Seafood
Plant
-Cereals
-Legumes
-Pseudo cereals
-Brasssicaceae species
-Others
By Application
Functional Food
Functional Beverages
Dietary Supplements
Animal Nutrition
Personal Care
Others
Countries Analyzed
North America (US, Canada, Mexico)
Europe (Germany, UK, France, Spain, Italy, Russia, Rest of Europe)
Asia Pacific (China, India, Japan, South Korea, Australia, South East Asia, Rest of Asia)
South America (Brazil, Argentina, Rest of South America)
Middle East and Africa (Saudi Arabia, UAE, Rest of Middle East, South Africa, Egypt, Rest of Africa)
Bioactive Protein and Peptides Companies Profiled in the Study
Archer-Daniels-Midland Company (ADM)
Bunge Ltd
Cargill, Incorporated
CHS Inc.
Cooke Inc.
E.I. du Pont de Nemours and Company
Fonterra Co-operative Group Limited
Kerry Group plc
Koninklijke DSM N.V.
*- List Not Exhaustive
Chapter 1. TABLE OF CONTENTS
Chapter 2. Introduction to Bioactive Protein and Peptides Market
2.1. Market Overview
2.2. Key Statistics and Report Highlights
2.3. Scope of the Comprehensive Study
2.3.1. Market Definition
2.3.2 Countries and Regions Covered
2.3.3 Research Objective
2.3.4 Units, Currency, and Conversions
2.3.5 Industry Value Chain
2.4. Key Market Segments
2.5. Key Companies
2.6. Study Period
Chapter 3. Strategic Analysis Review
3.1. Bioactive Protein and Peptides Pricing Analysis and Forecast
3.2. Porter’s Five Forces
3.3. Market Ecosystem
3.4. SWOT Analysis
3.5. Regulatory Scenario
3.3. Effects of Inflation, Russia-Ukraine War, moderating economic growth, and other macroeconomic factors
Chapter 4. Competitive Landscape
4.1. Market Share Analysis
4.1.1. Global Bioactive Protein and Peptides Market Share by Company, 2023
4.1.2. Product Offerings of Leading Bioactive Protein and Peptides Companies
4.2. Market Entropy
4.2.1. New Product Launches in the Industry
4.2.2. Mergers, Acquisitions, Joint ventures, and Partnerships
4.3. Key Strategies and Best Practices
Chapter 5. Global Market Projections: Best, Reference, and Low Case Scenarios
5.1. Growth Analysis- Case Scenario Definitions
5.2. Low Growth Case Scenario Forecasts
5.3. Reference Growth Case Scenario Forecasts
5.4. High Growth Case Scenario Forecasts
Chapter 6. Market Dynamics
6.1. Bioactive Protein and Peptides Market Drivers
6.2. Bioactive Protein and Peptides Market Challenges
6.6. Bioactive Protein and Peptides Market Opportunities
6.4. Bioactive Protein and Peptides Market Trends
Chapter 7. Global Bioactive Protein and Peptides Market Outlook Trends
7.1. Global Bioactive Protein and Peptides Revenue (USD Million) and CAGR (%) by Type (2021-2032)
7.2. Global Bioactive Protein and Peptides Revenue (USD Million) and CAGR (%) by Application (2021-2032)
7.3. Global Bioactive Protein and Peptides Revenue (USD Million) and CAGR (%) by Product (2021-2032)
By Source
Animal
-Dairy
-Egg & Meat
-Gelatin
-Seafood
Plant
-Cereals
-Legumes
-Pseudo cereals
-Brasssicaceae species
-Others
By Application
Functional Food
Functional Beverages
Dietary Supplements
Animal Nutrition
Personal Care
Others
Chapter 8. Global Bioactive Protein and Peptides Regional Analysis and Outlook
8.1. Global Bioactive Protein and Peptides Revenue (USD Million) By Regions (2021- 2032)
8.2. North America Bioactive Protein and Peptides Revenue (USD Million) by Country (2021-2032)
8.2.1. United States Bioactive Protein and Peptides Regional Analysis and Outlook
8.2.2. Canada Bioactive Protein and Peptides Regional Analysis and Outlook
8.2.3. Mexico Bioactive Protein and Peptides Regional Analysis and Outlook
8.3. Europe Bioactive Protein and Peptides Revenue (USD Million), by Country (2021-2032)
8.3.1. Germany Bioactive Protein and Peptides Regional Analysis and Outlook
8.3.2. France Bioactive Protein and Peptides Regional Analysis and Outlook
8.3.3. United Kingdom Bioactive Protein and Peptides Regional Analysis and Outlook
8.3.4. Spain Bioactive Protein and Peptides Regional Analysis and Outlook
8.3.5. Italy Bioactive Protein and Peptides Regional Analysis and Outlook
8.3.6. Russia Bioactive Protein and Peptides Regional Analysis and Outlook
8.3.7. Rest of Europe Bioactive Protein and Peptides Regional Analysis and Outlook
8.4. Asia Pacific Bioactive Protein and Peptides Revenue (USD Million) by Country (2021-2032)
8.4.1. China Bioactive Protein and Peptides Regional Analysis and Outlook
8.4.2. Japan Bioactive Protein and Peptides Regional Analysis and Outlook
8.4.3. India Bioactive Protein and Peptides Regional Analysis and Outlook
8.4.4. South Korea Bioactive Protein and Peptides Regional Analysis and Outlook
8.4.5. Australia Bioactive Protein and Peptides Regional Analysis and Outlook
8.4.6. South East Asia Bioactive Protein and Peptides Regional Analysis and Outlook
8.4.7. Rest of Asia Pacific Bioactive Protein and Peptides Regional Analysis and Outlook
8.5. South America Bioactive Protein and Peptides Revenue (USD Million), by Country (2021-2032)
8.5.1. Brazil Bioactive Protein and Peptides Regional Analysis and Outlook
8.5.2. Argentina Bioactive Protein and Peptides Regional Analysis and Outlook
8.5.3. Rest of South America Bioactive Protein and Peptides Regional Analysis and Outlook
8.6. Middle East and Africa Bioactive Protein and Peptides Revenue (USD Million) by Country (2021-2032)
8.6.1. Middle East Bioactive Protein and Peptides Regional Analysis and Outlook
8.6.2. Africa Bioactive Protein and Peptides Regional Analysis and Outlook
Chapter 9. North America Bioactive Protein and Peptides Analysis and Outlook
9.1. North America Bioactive Protein and Peptides Revenue (USD Million) by Segments (2021-2032)
9.1.1. North America Bioactive Protein and Peptides Revenue (USD Million) by Type (2021-2032)
9.1.2. North America Bioactive Protein and Peptides Revenue (USD Million) by Application (2021-2032)
9.1.3. North America Bioactive Protein and Peptides Revenue (USD Million) by Product (2021-2032)
By Source
Animal
-Dairy
-Egg & Meat
-Gelatin
-Seafood
Plant
-Cereals
-Legumes
-Pseudo cereals
-Brasssicaceae species
-Others
By Application
Functional Food
Functional Beverages
Dietary Supplements
Animal Nutrition
Personal Care
Others
Chapter 10. Europe Bioactive Protein and Peptides Analysis and Outlook
10.1. Europe Bioactive Protein and Peptides Revenue (USD Million), by Segments (USD Million) (2021-2032)
10.1.1. Europe Bioactive Protein and Peptides Revenue (USD Million) by Type (2021-2032)
10.1.2. Europe Bioactive Protein and Peptides Revenue (USD Million) by Application (2021-2032)
10.1.3. Europe Bioactive Protein and Peptides Revenue (USD Million) by Product (2021-2032)
By Source
Animal
-Dairy
-Egg & Meat
-Gelatin
-Seafood
Plant
-Cereals
-Legumes
-Pseudo cereals
-Brasssicaceae species
-Others
By Application
Functional Food
Functional Beverages
Dietary Supplements
Animal Nutrition
Personal Care
Others
Chapter 11. Asia Pacific Bioactive Protein and Peptides Analysis and Outlook
11.1. Asia Pacific Bioactive Protein and Peptides Revenue (USD Million), and Revenue (USD Million) by Segments (2021-2032)
11.1.1. Asia Pacific Bioactive Protein and Peptides Revenue (USD Million) by Type (2021-2032)
11.1.2. Asia Pacific Bioactive Protein and Peptides Revenue (USD Million) by Application (2021-2032)
11.1.3. Asia Pacific Bioactive Protein and Peptides Revenue (USD Million) by Product (2021-2032)
By Source
Animal
-Dairy
-Egg & Meat
-Gelatin
-Seafood
Plant
-Cereals
-Legumes
-Pseudo cereals
-Brasssicaceae species
-Others
By Application
Functional Food
Functional Beverages
Dietary Supplements
Animal Nutrition
Personal Care
Others
Chapter 12. South America Bioactive Protein and Peptides Analysis and Outlook
12.1. South America Bioactive Protein and Peptides Revenue (USD Million), by Segments (2021-2032)
12.1.1. South America Bioactive Protein and Peptides Revenue (USD Million) by Type (2021-2032)
12.1.2. South America Bioactive Protein and Peptides Revenue (USD Million) by Application (2021-2032)
12.1.3. South America Bioactive Protein and Peptides Revenue (USD Million) by Product (2021-2032)
By Source
Animal
-Dairy
-Egg & Meat
-Gelatin
-Seafood
Plant
-Cereals
-Legumes
-Pseudo cereals
-Brasssicaceae species
-Others
By Application
Functional Food
Functional Beverages
Dietary Supplements
Animal Nutrition
Personal Care
Others
Chapter 13. Middle East and Africa Bioactive Protein and Peptides Analysis and Outlook
13.1. Middle East and Africa Bioactive Protein and Peptides Revenue (USD Million), by Segments (2021-2032)
13.1.1. Middle East and Africa Bioactive Protein and Peptides Revenue (USD Million) by Type (2021-2032)
13.1.2. Middle East and Africa Bioactive Protein and Peptides Revenue (USD Million) by Application (2021-2032)
13.1.3. Middle East and Africa Bioactive Protein and Peptides Revenue (USD Million) by Product (2021-2032)
By Source
Animal
-Dairy
-Egg & Meat
-Gelatin
-Seafood
Plant
-Cereals
-Legumes
-Pseudo cereals
-Brasssicaceae species
-Others
By Application
Functional Food
Functional Beverages
Dietary Supplements
Animal Nutrition
Personal Care
Others
Chapter 14. Bioactive Protein and Peptides Company Profiles
14.1 Business Overview
14.2 Product Profiles
14.3 SWOT Profiles
14.5 Recent Developments
14.6 Financial Profile
List of Companies
Archer-Daniels-Midland Company (ADM)
Bunge Ltd
Cargill, Incorporated
CHS Inc.
Cooke Inc.
E.I. du Pont de Nemours and Company
Fonterra Co-operative Group Limited
Kerry Group plc
Koninklijke DSM N.V.
15. Methodology and Data Sources
15.1 Customization Offerings
15.2 Subscription Services
15.3 Related Reports
15.4 Publisher Expertise
LIST OF TABLES
Table 1 Market Segmentation Analysis
Table 2 Global Bioactive Protein and Peptides Market Share of Leading Companies, 2023
Table 3 Product Offerings of Leading Companies
Table 4 Low Growth Scenario Forecasts
Table 5 Reference Case Growth Scenario
Table 6 High Growth Case Scenario
Table 7 Global Bioactive Protein and Peptides Revenue (USD Million) And CAGR (%) By Type (2021-2032)
Table 8 Global Bioactive Protein and Peptides Revenue (USD Million) And CAGR (%) By Application (2021-2032)
Table 9 Global Bioactive Protein and Peptides Revenue (USD Million) And CAGR (%) By Product (2021-2032)
Table 10 Global Bioactive Protein and Peptides Market Revenue (USD Million) By Regions (2021-2032)
Table 11 Global Bioactive Protein and Peptides Market Share (%) By Regions (2021-2032)
Table 12 North America Bioactive Protein and Peptides Revenue (USD Million) By Country (2021-2032)
Table 13 Europe Bioactive Protein and Peptides Revenue (USD Million) By Country (2021-2032)
Table 14 Asia Pacific Bioactive Protein and Peptides Revenue (USD Million) By Country (2021-2032)
Table 15 South America Bioactive Protein and Peptides Revenue (USD Million) By Country (2021-2032)
Table 16 Middle East and Africa Bioactive Protein and Peptides Revenue (USD Million) By Region (2021-2032)
Table 17 North America Bioactive Protein and Peptides Revenue (USD Million) By Type (2021-2032)
Table 18 North America Bioactive Protein and Peptides Revenue (USD Million) By Application (2021-2032)
Table 19 North America Bioactive Protein and Peptides Revenue (USD Million) By Product (2021-2032)
Table 20 Europe Bioactive Protein and Peptides Revenue (USD Million) By Type (2021-2032)
Table 21 Europe Bioactive Protein and Peptides Revenue (USD Million) By Application (2021-2032)
Table 22 Europe Bioactive Protein and Peptides Revenue (USD Million) By Product (2021-2032)
Table 23 Asia Pacific Bioactive Protein and Peptides Revenue (USD Million) By Type (2021-2032)
Table 24 Asia Pacific Bioactive Protein and Peptides Revenue (USD Million) By Application (2021-2032)
Table 25 Asia Pacific Bioactive Protein and Peptides Revenue (USD Million) By Product (2021-2032)
Table 26 South America Bioactive Protein and Peptides Revenue (USD Million) By Type (2021-2032)
Table 27 South America Bioactive Protein and Peptides Revenue (USD Million) By Application (2021-2032)
Table 28 South America Bioactive Protein and Peptides Revenue (USD Million) By Product (2021-2032)
Table 29 Middle East and Africa Bioactive Protein and Peptides Revenue (USD Million) By Type (2021-2032)
Table 30 Middle East and Africa Bioactive Protein and Peptides Revenue (USD Million) By Application (2021-2032)
Table 31 Middle East and Africa Bioactive Protein and Peptides Revenue (USD Million) By Product (2021-2032)
LIST OF FIGURES
Figure 1. Market Scope
Figure 2. Pricing Forecasts Per Unit, 2023- 2032
Figure 3. Porter’s Five Forces
Figure 4. Global Bioactive Protein and Peptides Market Revenue (USD Million) By Regions (2021-2032)
Figure 5. Global Bioactive Protein and Peptides Market Share (%) By Regions (2023)
Figure 6. North America Bioactive Protein and Peptides Revenue (USD Million) By Country (2021-2032)
Figure 7. United States Bioactive Protein and Peptides Revenue (USD Million) By Country (2021-2032)
Figure 8. Canada Bioactive Protein and Peptides Revenue (USD Million) By Country (2021-2032)
Figure 9. Mexico Bioactive Protein and Peptides Revenue (USD Million) By Country (2021-2032)
Figure 10. Europe Bioactive Protein and Peptides Revenue (USD Million) By Country (2021-2032)
Figure 11. Germany Bioactive Protein and Peptides Revenue (USD Million) By Country (2021-2032)
Figure 12. France Bioactive Protein and Peptides Revenue (USD Million) By Country (2021-2032)
Figure 13. United Kingdom Bioactive Protein and Peptides Revenue (USD Million) By Country (2021-2032)
Figure 14. Spain Bioactive Protein and Peptides Revenue (USD Million) By Country (2021-2032)
Figure 15. Italy Bioactive Protein and Peptides Revenue (USD Million) By Country (2021-2032)
Figure 16. Russia Bioactive Protein and Peptides Revenue (USD Million) By Country (2021-2032)
Figure 17. Rest of Europe Bioactive Protein and Peptides Revenue (USD Million) By Country (2021-2032)
Figure 11. Asia Pacific Bioactive Protein and Peptides Revenue (USD Million) By Country (2021-2032)
Figure 12. China Bioactive Protein and Peptides Revenue (USD Million) By Country (2021-2032)
Figure 13. Japan Bioactive Protein and Peptides Revenue (USD Million) By Country (2021-2032)
Figure 14. India Bioactive Protein and Peptides Revenue (USD Million) By Country (2021-2032)
Figure 15. South Korea Bioactive Protein and Peptides Revenue (USD Million) By Country (2021-2032)
Figure 16. Australia Bioactive Protein and Peptides Revenue (USD Million) By Country (2021-2032)
Figure 17. South East Asia Bioactive Protein and Peptides Revenue (USD Million) By Country (2021-2032)
Figure 18. South America Bioactive Protein and Peptides Revenue (USD Million) By Country (2021-2032)
Figure 19. Brazil Bioactive Protein and Peptides Revenue (USD Million) By Country (2021-2032)
Figure 20. Argentina Bioactive Protein and Peptides Revenue (USD Million) By Country (2021-2032)
Figure 21. Rest of Asia Pacific Bioactive Protein and Peptides Revenue (USD Million) By Country (2021-2032)
Figure 22. Middle East and Africa Bioactive Protein and Peptides Revenue (USD Million) By Region (2021-2032)
Figure 23. Saudi Arabia Bioactive Protein and Peptides Revenue (USD Million) By Region (2021-2032)
Figure 24. The UAE Bioactive Protein and Peptides Revenue (USD Million) By Region (2021-2032)
Figure 25. Rest of Middle East Bioactive Protein and Peptides Revenue (USD Million) By Region (2021-2032)
Figure 26. South Africa Bioactive Protein and Peptides Revenue (USD Million) By Region (2021-2032)
Figure 27. Africa Bioactive Protein and Peptides Revenue (USD Million) By Region (2021-2032)
Figure 28. North America Bioactive Protein and Peptides Revenue (USD Million) By Type (2021-2032)
Figure 29. North America Bioactive Protein and Peptides Revenue (USD Million) By Application (2021-2032)
Figure 30. North America Bioactive Protein and Peptides Revenue (USD Million) By Product (2021-2032)
Figure 31. Europe Bioactive Protein and Peptides Revenue (USD Million) By Type (2021-2032)
Figure 32. Europe Bioactive Protein and Peptides Revenue (USD Million) By Application (2021-2032)
Figure 33. Europe Bioactive Protein and Peptides Revenue (USD Million) By Product (2021-2032)
Figure 34. Asia Pacific Bioactive Protein and Peptides Revenue (USD Million) By Type (2021-2032)
Figure 35. Asia Pacific Bioactive Protein and Peptides Revenue (USD Million) By Application (2021-2032)
Figure 36. Asia Pacific Bioactive Protein and Peptides Revenue (USD Million) By Product (2021-2032)
Figure 37. South America Bioactive Protein and Peptides Revenue (USD Million) By Type (2021-2032)
Figure 38. South America Bioactive Protein and Peptides Revenue (USD Million) By Application (2021-2032)
Figure 39. South America Bioactive Protein and Peptides Revenue (USD Million) By Product (2021-2032)
Figure 40. Middle East and Africa Bioactive Protein and Peptides Revenue (USD Million) By Type (2021-2032)
Figure 41. Middle East and Africa Bioactive Protein and Peptides Revenue (USD Million) By Application (2021-2032)
Figure 42. Middle East and Africa Bioactive Protein and Peptides Revenue (USD Million) By Product (2021-2032)
By Source
Animal
-Dairy
-Egg & Meat
-Gelatin
-Seafood
Plant
-Cereals
-Legumes
-Pseudo cereals
-Brasssicaceae species
-Others
By Application
Functional Food
Functional Beverages
Dietary Supplements
Animal Nutrition
Personal Care
Others
Countries Analyzed
North America (US, Canada, Mexico)
Europe (Germany, UK, France, Spain, Italy, Russia, Rest of Europe)
Asia Pacific (China, India, Japan, South Korea, Australia, South East Asia, Rest of Asia)
South America (Brazil, Argentina, Rest of South America)
Middle East and Africa (Saudi Arabia, UAE, Rest of Middle East, South Africa, Egypt, Rest of Africa)
