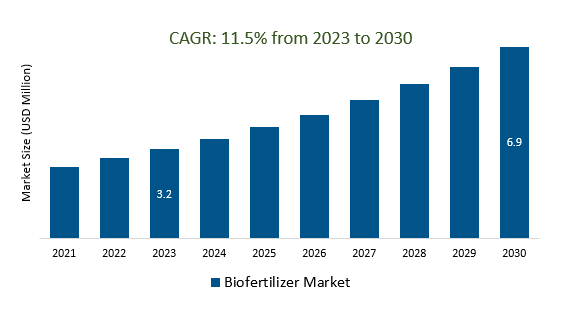
Global Biofertilizers Market Size is valued at $3.6 Billion in 2024 and is forecast to register a growth rate (CAGR) of 11.5% to reach $8.6 Billion by 2032.
The market growth is driven by growing awareness about the environmental and health hazards associated with chemical fertilizers has led to a shift towards sustainable farming practices, including the use of biofertilizers. Leading companies are focusing on Sustainable Agriculture, Organic Farming, Environmental Regulations, Crop-Specific Formulations, and others to boost market shares in the industry.
Market Overview
The biofertilizer market is a rapidly growing segment of agriculture, driven by increasing awareness of the environmental impact of chemical fertilizers, government support, and consumer demand for sustainable, organic farming. Biofertilizers are derived from beneficial microorganisms that enhance soil health, reduce environmental harm, and improve crop yields
Market Dynamics
Market Trends- Integrated Nutrient Management (INM) A New Approach to Sustainable Crop Production
Integrated Nutrient Management (INM) is a sustainable crop production approach that enhances the biofertilizer market by promoting the judicious use of biofertilizers alongside chemical fertilizers and organic materials. INM reduces reliance on chemical fertilizers, improves soil health, and aligns with environmental sustainability goals, driving the adoption of eco-friendly biofertilizers.
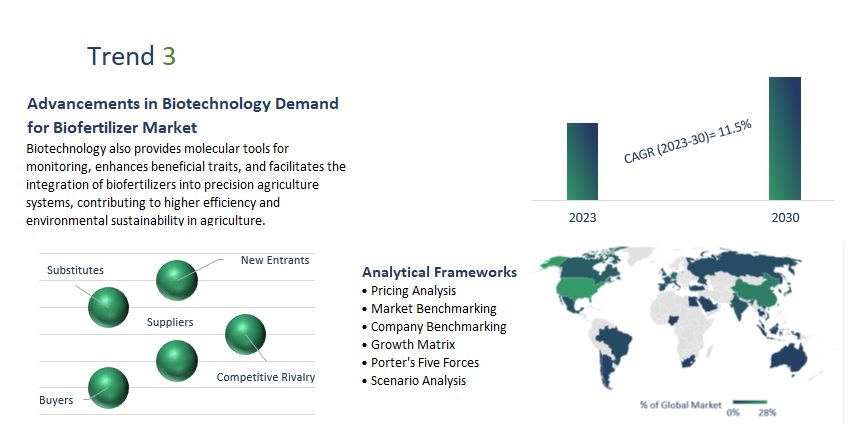
Market Driver- Advancements in Biotechnology Demand for Biofertilizer Market
Advancements in biotechnology have revolutionized the biofertilizer market by enabling the selection and engineering of microbial strains, the development of microbial consortia, improved formulations, and encapsulation techniques for increased shelf life and controlled release. Biotechnology also provides molecular tools for monitoring, enhances beneficial traits, and facilitates the integration of biofertilizers into precision agriculture systems, contributing to higher efficiency and environmental sustainability in agriculture.
Market Opportunity-Introduction of Technological Advancements
Technological advancements in the biofertilizer market encompass strain improvement, microbial consortia, encapsulation, molecular tools, bioprocess optimization, trait enhancement, symbiotic associations, precision agriculture integration, data analytics, blockchain, artificial intelligence, and nanotechnology.
Market Share Analysis- nitrogen-fixing biofertilizers Biofertilizer Market will register the fastest growth
The Global Biofertilizer Market is analyzed across Nitrogen-fixing biofertilizers, Phosphate solubilizing and mobilizing biofertilizers, Potassium solubilizing and mobilizing biofertilizers, and others. Of these, nitrogen-fixing biofertilizers will register the fastest growth. Nitrogen-fixing biofertilizers, comprising beneficial nitrogen-fixing bacteria, are integral to the biofertilizer market, boosting nitrogen availability to plants, reducing synthetic nitrogen fertilizer reliance, promoting soil health, and aligning with environmental sustainability goals. These biofertilizers are vital for sustainable agriculture, often utilized in crop rotation.
Market Share Analysis- cereals and grains held a significant market share in 2023
The Global Biofertilizer Market is analyzed across various Crop types including Cereals and grains, Pulses and oilseeds, Fruits and vegetables, and others. Of these, cereals and grains held a significant market share in 2023. Biofertilizers are integral to the cereal and grain market, boosting yields, quality, and sustainability while reducing reliance on chemical fertilizers and mitigating environmental impact. Their application promotes soil health, minimizes nitrogen pollution, and supports organic farming certification. Biofertilizers are adaptable to cereals and grains, optimizing nutrient delivery, enhancing crop resilience to environmental stressors, and meeting consumer demands for sustainably produced crops, making them a valuable asset in modern agriculture.
Biofertilizer Market Segmentation
By Type
By Crop Type
- Cereals and grains
- Pulses and oilseeds
- Fruits and vegetables
- Others
By Mode of Application
- Soil treatment
- Seed treatment
- Others
By Form
By Region
- North America (United States, Canada, Mexico)
- Europe (Germany, France, United Kingdom, Spain, Italy, Others)
- Asia Pacific (China, India, Japan, South Korea, Australia, Others)
- Latin America (Brazil, Argentina, Others)
- Middle East and Africa (Saudi Arabia, UAE, Kuwait, Other Middle East, South Africa, Nigeria, Other Africa)
Biofertilizer Market Companies
- Lallemand Inc (Canada)
- Novozymes (Denmark)
- UPL (India)
- Chr. Hansen Holding A/S (Denmark)
- Syngenta (Switzerland)
- Vega Lab SA (Switzerland)
- Rizobacter Argentina S.A. (Argentina)
- IPL Biologicals Limited (India)
- Kiwa Bio-tech Product Group Cooperation (China)
- T. Stanes and Company Limited (India)
- Symborg (Spain)
- Kan Biosys (India)
- Seipasa (Spain)
- AgriLife (India)
- Mapleton Agri Biotec Pt Ltd (Australia)
* List not exhaustive
Biofertilizer Market Outlook 2023
1 Market Overview
1.1 Introduction to the Biofertilizer Market
1.2 Scope of the Study
1.3 Research Objective
1.3.1 Key Market Scope and Segments
1.3.2 Players Covered
1.3.3 Years Considered
2 Executive Summary
2.1 2023 Biofertilizer Industry- Market Statistics
3 Market Dynamics
3.1 Market Drivers
3.2 Market Challenges
3.3 Market Opportunities
3.4 Market Trends
4 Market Factor Analysis
4.1 Porter’s Five Forces
4.2 Market Entropy
4.2.1 Global Biofertilizer Market Companies with Area Served
4.2.2 Products Offerings Global Biofertilizer Market
5 COVID-19 Impact Analysis and Outlook Scenarios
5.1.1 Covid-19 Impact Analysis
5.1.2 post-COVID-19 Scenario- Low Growth Case
5.1.3 post-COVID-19 Scenario- Reference Growth Case
5.1.4 post-COVID-19 Scenario- Low Growth Case
6 Global Biofertilizer Market Trends
6.1 Global Biofertilizer Revenue (USD Million) and CAGR (%) by Type (2018-2030)
6.2 Global Biofertilizer Revenue (USD Million) and CAGR (%) by Applications (2018-2030)
6.3 Global Biofertilizer Revenue (USD Million) and CAGR (%) by regions (2018-2030)
7 Global Biofertilizer Market Revenue (USD Million) by Type, and Applications (2018-2022)
7.1 Global Biofertilizer Revenue (USD Million) by Type (2018-2022)
7.1.1 Global Biofertilizer Revenue (USD Million), Market Share (%) by Type (2018-2022)
7.2 Global Biofertilizer Revenue (USD Million) by Applications (2018-2022)
7.2.1 Global Biofertilizer Revenue (USD Million), Market Share (%) by Applications (2018-2022)
8 Global Biofertilizer Development Regional Status and Outlook
8.1 Global Biofertilizer Revenue (USD Million) By Regions (2018-2022)
8.2 North America Biofertilizer Revenue (USD Million) by Type, and Application (2018-2022)
8.2.1 North America Biofertilizer Revenue (USD Million) by Country (2018-2022)
8.2.2 North America Biofertilizer Revenue (USD Million) by Type (2018-2022)
8.2.3 North America Biofertilizer Revenue (USD Million) by Applications (2018-2022)
8.3 Europe Biofertilizer Revenue (USD Million), by Type, and Applications (USD Million) (2018-2022)
8.3.1 Europe Biofertilizer Revenue (USD Million), by Country (2018-2022)
8.3.2 Europe Biofertilizer Revenue (USD Million) by Type (2018-2022)
8.3.3 Europe Biofertilizer Revenue (USD Million) by Applications (2018-2022)
8.4 Asia Pacific Biofertilizer Revenue (USD Million), and Revenue (USD Million) by Type, and Applications (2018-2022)
8.4.1 Asia Pacific Biofertilizer Revenue (USD Million) by Country (2018-2022)
8.4.2 Asia Pacific Biofertilizer Revenue (USD Million) by Type (2018-2022)
8.4.3 Asia Pacific Biofertilizer Revenue (USD Million) by Applications (2018-2022)
8.5 South America Biofertilizer Revenue (USD Million), by Type, and Applications (2018-2022)
8.5.1 South America Biofertilizer Revenue (USD Million), by Country (2018-2022)
8.5.2 South America Biofertilizer Revenue (USD Million) by Type (2018-2022)
8.5.3 South America Biofertilizer Revenue (USD Million) by Applications (2018-2022)
8.6 Middle East and Africa Biofertilizer Revenue (USD Million), by Type, Technology, Application, Thickness (2018-2022)
8.6.1 Middle East and Africa Biofertilizer Revenue (USD Million) by Country (2018-2022)
8.6.2 Middle East and Africa Biofertilizer Revenue (USD Million) by Type (2018-2022)
8.6.3 Middle East and Africa Biofertilizer Revenue (USD Million) by Applications (2018-2022)
9 Company Profiles
10 Global Biofertilizer Market Revenue (USD Million), by Type, and Applications (2023-2030)
10.1 Global Biofertilizer Revenue (USD Million) and Market Share (%) by Type (2023-2030)
10.1.1 Global Biofertilizer Revenue (USD Million), and Market Share (%) by Type (2023-2030)
10.2 Global Biofertilizer Revenue (USD Million) and Market Share (%) by Applications (2023-2030)
10.2.1 Global Biofertilizer Revenue (USD Million), and Market Share (%) by Applications (2023-2030)
11 Global Biofertilizer Development Regional Status and Outlook Forecast
11.1 Global Biofertilizer Revenue (USD Million) By Regions (2023-2030)
11.2 North America Biofertilizer Revenue (USD Million) by Type, and Applications (2023-2030)
11.2.1 North America Biofertilizer Revenue (USD) Million by Country (2023-2030)
11.2.2 North America Biofertilizer Revenue (USD Million), by Type (2023-2030)
11.2.3 North America Biofertilizer Revenue (USD Million), Market Share (%) by Applications (2023-2030)
11.3 Europe Biofertilizer Revenue (USD Million), by Type, and Applications (2023-2030)
11.3.1 Europe Biofertilizer Revenue (USD Million), by Country (2023-2030)
11.3.2 Europe Biofertilizer Revenue (USD Million), by Type (2023-2030)
11.3.3 Europe Biofertilizer Revenue (USD Million), by Applications (2023-2030)
11.4 Asia Pacific Biofertilizer Revenue (USD Million) by Type, and Applications (2023-2030)
11.4.1 Asia Pacific Biofertilizer Revenue (USD Million), by Country (2023-2030)
11.4.2 Asia Pacific Biofertilizer Revenue (USD Million), by Type (2023-2030)
11.4.3 Asia Pacific Biofertilizer Revenue (USD Million), by Applications (2023-2030)
11.5 South America Biofertilizer Revenue (USD Million), by Type, and Applications (2023-2030)
11.5.1 South America Biofertilizer Revenue (USD Million), by Country (2023-2030)
11.5.2 South America Biofertilizer Revenue (USD Million), by Type (2023-2030)
11.5.3 South America Biofertilizer Revenue (USD Million), by Applications (2023-2030)
11.6 Middle East and Africa Biofertilizer Revenue (USD Million), by Type, and Applications (2023-2030)
11.6.1 Middle East and Africa Biofertilizer Revenue (USD Million), by region (2023-2030)
11.6.2 Middle East and Africa Biofertilizer Revenue (USD Million), by Type (2023-2030)
11.6.3 Middle East and Africa Biofertilizer Revenue (USD Million), by Applications (2023-2030)
12 Methodology and Data Sources
12.1 Methodology/Research Approach
12.1.1 Research Programs/Design
12.1.2 Market Size Estimation
12.1.3 Market Breakdown and Data Triangulation
12.2 Data Sources
12.2.1 Secondary Sources
12.2.2 Primary Sources
12.3 Disclaimer
List of Tables
Table 1 Market Segmentation Analysis
Table 2 Global Biofertilizer Market Companies with Areas Served
Table 3 Products Offerings Global Biofertilizer Market
Table 4 Low Growth Scenario Forecasts
Table 5 Reference Case Growth Scenario
Table 6 High Growth Case Scenario
Table 7 Global Biofertilizer Revenue (USD Million) And CAGR (%) By Type (2018-2030)
Table 8 Global Biofertilizer Revenue (USD Million) And CAGR (%) By Applications (2018-2030)
Table 9 Global Biofertilizer Revenue (USD Million) And CAGR (%) By Regions (2018-2030)
Table 10 Global Biofertilizer Revenue (USD Million) By Type (2018-2022)
Table 11 Global Biofertilizer Revenue Market Share (%) By Type (2018-2022)
Table 12 Global Biofertilizer Revenue (USD Million) By Applications (2018-2022)
Table 13 Global Biofertilizer Revenue Market Share (%) By Applications (2018-2022)
Table 14 Global Biofertilizer Market Revenue (USD Million) By Regions (2018-2022)
Table 15 Global Biofertilizer Market Share (%) By Regions (2018-2022)
Table 16 North America Biofertilizer Revenue (USD Million) By Country (2018-2022)
Table 17 North America Biofertilizer Revenue (USD Million) By Type (2018-2022)
Table 18 North America Biofertilizer Revenue (USD Million) By Applications (2018-2022)
Table 19 Europe Biofertilizer Revenue (USD Million) By Country (2018-2022)
Table 20 Europe Biofertilizer Revenue (USD Million) By Type (2018-2022)
Table 21 Europe Biofertilizer Revenue (USD Million) By Applications (2018-2022)
Table 22 Asia Pacific Biofertilizer Revenue (USD Million) By Country (2018-2022)
Table 23 Asia Pacific Biofertilizer Revenue (USD Million) By Type (2018-2022)
Table 24 Asia Pacific Biofertilizer Revenue (USD Million) By Applications (2018-2022)
Table 25 South America Biofertilizer Revenue (USD Million) By Country (2018-2022)
Table 26 South America Biofertilizer Revenue (USD Million) By Type (2018-2022)
Table 27 South America Biofertilizer Revenue (USD Million) By Applications (2018-2022)
Table 28 Middle East and Africa Biofertilizer Revenue (USD Million) By Region (2018-2022)
Table 29 Middle East and Africa Biofertilizer Revenue (USD Million) By Type (2018-2022)
Table 30 Middle East and Africa Biofertilizer Revenue (USD Million) By Applications (2018-2022)
Table 31 Financial Analysis
Table 32 Global Biofertilizer Revenue (USD Million) By Type (2023-2030)
Table 33 Global Biofertilizer Revenue Market Share (%) By Type (2023-2030)
Table 34 Global Biofertilizer Revenue (USD Million) By Applications (2023-2030)
Table 35 Global Biofertilizer Revenue Market Share (%) By Applications (2023-2030)
Table 36 Global Biofertilizer Market Revenue (USD Million), And Revenue (USD Million) By Regions (2023-2030)
Table 37 North America Biofertilizer Revenue (USD)By Country (2023-2030)
Table 38 North America Biofertilizer Revenue (USD Million) By Type (2023-2030)
Table 39 North America Biofertilizer Revenue (USD Million) By Applications (2023-2030)
Table 40 Europe Biofertilizer Revenue (USD Million) By Country (2023-2030)
Table 41 Europe Biofertilizer Revenue (USD Million) By Type (2023-2030)
Table 42 Europe Biofertilizer Revenue (USD Million) By Applications (2023-2030)
Table 43 Asia Pacific Biofertilizer Revenue (USD Million) By Country (2023-2030)
Table 44 Asia Pacific Biofertilizer Revenue (USD Million) By Type (2023-2030)
Table 45 Asia Pacific Biofertilizer Revenue (USD Million) By Applications (2023-2030)
Table 46 South America Biofertilizer Revenue (USD Million) By Country (2023-2030)
Table 47 South America Biofertilizer Revenue (USD Million) By Type (2023-2030)
Table 48 South America Biofertilizer Revenue (USD Million) By Applications (2023-2030)
Table 49 Middle East and Africa Biofertilizer Revenue (USD Million) By Region (2023-2030)
Table 50 Middle East and Africa Biofertilizer Revenue (USD Million) By Region (2023-2030)
Table 51 Middle East and Africa Biofertilizer Revenue (USD Million) By Type (2023-2030)
Table 52 Middle East and Africa Biofertilizer Revenue (USD Million) By Applications (2023-2030)
Table 53 Research Programs/Design for This Report
Table 54 Key Data Information from Secondary Sources
Table 55 Key Data Information from Primary Sources
List of Figures
Figure 1 Market Scope
Figure 2 Porter’s Five Forces
Figure 3 Global Biofertilizer Revenue (USD Million) By Type (2018-2022)
Figure 4 Global Biofertilizer Revenue Market Share (%) By Type (2022)
Figure 5 Global Biofertilizer Revenue (USD Million) By Applications (2018-2022)
Figure 6 Global Biofertilizer Revenue Market Share (%) By Applications (2022)
Figure 7 Global Biofertilizer Market Revenue (USD Million) By Regions (2018-2022)
Figure 8 Global Biofertilizer Market Share (%) By Regions (2022)
Figure 9 North America Biofertilizer Revenue (USD Million) By Country (2018-2022)
Figure 10 North America Biofertilizer Revenue (USD Million) By Type (2018-2022)
Figure 11 North America Biofertilizer Revenue (USD Million) By Applications (2018-2022)
Figure 12 Europe Biofertilizer Revenue (USD Million) By Country (2018-2022)
Figure 13 Europe Biofertilizer Revenue (USD Million) By Type (2018-2022)
Figure 14 Europe Biofertilizer Revenue (USD Million) By Applications (2018-2022)
Figure 15 Asia Pacific Biofertilizer Revenue (USD Million) By Country (2018-2022)
Figure 16 Asia Pacific Biofertilizer Revenue (USD Million) By Type (2018-2022)
Figure 17 Asia Pacific Biofertilizer Revenue (USD Million) By Applications (2018-2022)
Figure 18 South America Biofertilizer Revenue (USD Million) By Country (2018-2022)
Figure 19 South America Biofertilizer Revenue (USD Million) By Type (2018-2022)
Figure 20 South America Biofertilizer Revenue (USD Million) By Applications (2018-2022)
Figure 21 Middle East and Africa Biofertilizer Revenue (USD Million) By Region (2018-2022)
Figure 22 Middle East and Africa Biofertilizer Revenue (USD Million) By Type (2018-2022)
Figure 23 Middle East and Africa Biofertilizer Revenue (USD Million) By Applications (2018-2022)
Figure 24 Global Biofertilizer Revenue (USD Million) By Type (2023-2030)
Figure 25 Global Biofertilizer Revenue Market Share (%) By Type (2030)
Figure 26 Global Biofertilizer Revenue (USD Million) By Applications (2023-2030)
Figure 27 Global Biofertilizer Revenue Market Share (%) By Applications (2030)
Figure 28 Global Biofertilizer Market Revenue (USD Million) By Regions (2023-2030)
Figure 29 North America Biofertilizer Revenue (USD Million) By Country (2023-2030)
Figure 30 North America Biofertilizer Revenue (USD Million) By Type (2023-2030)
Figure 31 North America Biofertilizer Revenue (USD Million) By Applications (2023-2030)
Figure 32 Europe Biofertilizer Revenue (USD Million) By Country (2023-2030)
Figure 33 Europe Biofertilizer Revenue (USD Million) By Type (2023-2030)
Figure 34 Europe Biofertilizer Revenue (USD Million) By Applications (2023-2030)
Figure 35 Asia Pacific Biofertilizer Revenue (USD Million) By Country (2023-2030)
Figure 36 Asia Pacific Biofertilizer Revenue (USD Million) By Type (2023-2030)
Figure 37 Asia Pacific Biofertilizer Revenue (USD Million) By Applications (2023-2030)
Figure 38 South America Biofertilizer Revenue (USD Million) By Country (2023-2030)
Figure 39 South America Biofertilizer Revenue (USD Million) By Type (2023-2030)
Figure 40 South America Biofertilizer Revenue (USD Million) By Applications (2023-2030)
Figure 41 Middle East and Africa Biofertilizer Revenue (USD Million) By Region (2023-2030)
Figure 42 Middle East and Africa Biofertilizer Revenue (USD Million) By Region (2023-2030)
Figure 43 Middle East and Africa Biofertilizer Revenue (USD Million) By Type (2023-2030)
Figure 44 Middle East and Africa Biofertilizer Revenue (USD Million) By Applications (2023-2030)
Figure 45 Bottom-Up and Top-Down Approaches for This Report
Figure 46 Data Triangulation
