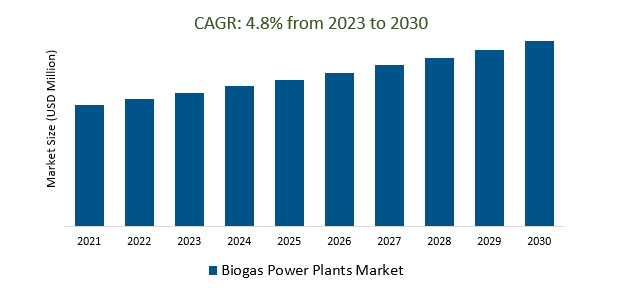
The Global Biogas Power Plants Market Size is estimated to register 4.8% growth over the forecast period from 2023 to 2030.
The market growth is driven by the increasing concerns about climate change and the need to reduce greenhouse gas emissions has driven the demand for renewable energy sources, including biogas. Leading Companies that are focusing on Continued Emphasis on Renewable Energy, Climate Change Mitigation, Circular Economy, Decentralized Energy Generation, Hydrogen Production, Waste Reduction and Resource Recovery, Innovative Business Models, and others to boost market shares in the industry.
Market Overview
The biogas power plants market is a growing segment within renewable energy, driven by the global shift toward sustainable energy sources, stringent environmental regulations, and the need for efficient organic waste management. Biogas, produced through anaerobic digestion of organic materials, serves as a versatile and clean energy source, with agricultural residues, sewage, and industrial waste as common feedstock. The market is characterized by steady growth, and its future is expected to be influenced by technological advancements, greater integration with other renewable sources, and the potential for green hydrogen production, all underpinned by supportive government policies and a focus on reducing carbon emissions.
Market Dynamics
Market Trends - Biogas power plants can be used to produce green hydrogen, a clean fuel that can help to decarbonize the economy
Biogas power plants are instrumental in producing green hydrogen, a clean, zero-emission fuel that holds significant promise for decarbonizing the economy. By using surplus biogas to generate green hydrogen via electrolysis, these facilities contribute to a circular energy system, supporting diverse applications like transportation, industry, and grid stability. This integration aligns with global efforts to reduce carbon emissions and advance a low-carbon future, positioning biogas as a vital component of sustainable energy solutions.
Market Driver- The demand for biogas power plants is increasing as countries and businesses seek to generate more energy from decentralized sources
The demand for biogas power plants is on a steady rise as countries and businesses across the globe actively pursue diversified energy generation strategies. One of the most compelling factors propelling this growth is the emphasis on decentralized energy sources. With the desire to reduce reliance on centralized power grids and enhance energy security, biogas power plants have garnered attention for their ability to produce renewable energy locally. This trend is particularly prominent in agricultural regions, where these facilities can efficiently convert agricultural waste, such as manure and crop residues, into electricity and heat. Furthermore, the decentralization of energy generation minimizes transmission losses and boosts energy resilience, contributing to a more sustainable and reliable energy ecosystem.
Market Opportunity- Technological advancements are being introduced to improve the efficiency and performance of biogas power plants.
Continual technological advancements are driving improvements in the efficiency and performance of biogas power plants. These innovations span various aspects of the biogas production process, including enhanced digester designs, advanced monitoring systems, and the implementation of co-digestion techniques. These developments result in higher gas yields, shorter retention times, and more cost-effective operations, positioning biogas power plants as a significant player in the renewable energy sector with the potential for increased energy production and environmental sustainability.
Market Share Analysis- Floating Drum Biogas Power Plants Market will register the Significant growth
The Global Biogas Power Plants Market is analyzed across Fixed Dome, Balloon Plants, and others. Floating Drum is poised to register significant growth. Floating drum biogas power plants are specialized facilities designed to produce renewable energy using a floating drum or balloon structure for biogas capture and storage. They are particularly suitable for areas with limited land availability or flooding risks. These plants use organic waste materials for biogas production via anaerobic digestion. While not as common as other types of biogas plants, the market for floating drum biogas power plants has been growing, driven by the need for sustainable energy solutions, especially in regions with land constraints or flood vulnerability. For the most up-to-date information on this market, consult industry reports and sources specific to this niche sector.
Market Share Analysis- Electricity Generation held a significant market share in 2023
The Global Biogas Power Plants Market is analyzed across various Installation Mode including Electricity Generation, Biofuel, Power Generation, and others. Of these, Electricity Generation held a significant market share in 2023. The electricity generation segment in the biogas power plants market involves converting biogas, produced from organic materials through anaerobic digestion, into electrical energy. Biogas power plants use generators for this purpose, and the electricity generated can be employed for diverse applications. This market is driven by the global shift toward cleaner and sustainable energy solutions, underpinned by environmental concerns, government policies, technological advancements, and the increasing demand for renewable power sources. The growth of this sector is closely aligned with the broader goal of reducing carbon emissions and promoting the use of renewable resources in the energy landscape.
Biogas Power Plants Market Segmentation
By Type
- Fixed Dome
- Floating Drum
- Balloon Plants
- Others
By Application
- Electricity Generation
- Biofuel
- Power Generation
By Region
- North America (United States, Canada, Mexico)
- Europe (Germany, France, United Kingdom, Spain, Italy, Others)
- Asia Pacific (China, India, Japan, South Korea, Australia, Others)
- Latin America (Brazil, Argentina, Others)
- Middle East and Africa (Saudi Arabia, UAE, Kuwait, Other Middle East, South Africa, Nigeria, Other Africa)
Biogas Power Plants Market Companies
- Xebec Adsorption (Canada)
- CarbonOrO (Netherlands)
- HomeBiogas Ltd (Israel)
- Greenlane Biogas (Canada)
- PlanET Biogas (United Kingdom)
- PlanET Biogas (United Kingdom)
- Albany (United States)
- EnviTec Biogas (United Kingdom)
- Schmack Biogas (Germany)
- Biomass One (United States)
*List not exhaustive
Biogas Power Plants Market Outlook 2023
1 Market Overview
1.1 Introduction to the Biogas Power Plants Market
1.2 Scope of the Study
1.3 Research Objective
1.3.1 Key Market Scope and Segments
1.3.2 Players Covered
1.3.3 Years Considered
2 Executive Summary
2.1 2023 Biogas Power Plants Industry- Market Statistics
3 Market Dynamics
3.1 Market Drivers
3.2 Market Challenges
3.3 Market Opportunities
3.4 Market Trends
4 Market Factor Analysis
4.1 Porter’s Five Forces
4.2 Market Entropy
4.2.1 Global Biogas Power Plants Market Companies with Area Served
4.2.2 Products Offerings Global Biogas Power Plants Market
5 COVID-19 Impact Analysis and Outlook Scenarios
5.1.1 Covid-19 Impact Analysis
5.1.2 post-COVID-19 Scenario- Low Growth Case
5.1.3 post-COVID-19 Scenario- Reference Growth Case
5.1.4 post-COVID-19 Scenario- Low Growth Case
6 Global Biogas Power Plants Market Trends
6.1 Global Biogas Power Plants Revenue (USD Million) and CAGR (%) by Type (2018-2030)
6.2 Global Biogas Power Plants Revenue (USD Million) and CAGR (%) by Applications (2018-2030)
6.3 Global Biogas Power Plants Revenue (USD Million) and CAGR (%) by regions (2018-2030)
7 Global Biogas Power Plants Market Revenue (USD Million) by Type, and Applications (2018-2022)
7.1 Global Biogas Power Plants Revenue (USD Million) by Type (2018-2022)
7.1.1 Global Biogas Power Plants Revenue (USD Million), Market Share (%) by Type (2018-2022)
7.2 Global Biogas Power Plants Revenue (USD Million) by Applications (2018-2022)
7.2.1 Global Biogas Power Plants Revenue (USD Million), Market Share (%) by Applications (2018-2022)
8 Global Biogas Power Plants Development Regional Status and Outlook
8.1 Global Biogas Power Plants Revenue (USD Million) By Regions (2018-2022)
8.2 North America Biogas Power Plants Revenue (USD Million) by Type, and Application (2018-2022)
8.2.1 North America Biogas Power Plants Revenue (USD Million) by Country (2018-2022)
8.2.2 North America Biogas Power Plants Revenue (USD Million) by Type (2018-2022)
8.2.3 North America Biogas Power Plants Revenue (USD Million) by Applications (2018-2022)
8.3 Europe Biogas Power Plants Revenue (USD Million), by Type, and Applications (USD Million) (2018-2022)
8.3.1 Europe Biogas Power Plants Revenue (USD Million), by Country (2018-2022)
8.3.2 Europe Biogas Power Plants Revenue (USD Million) by Type (2018-2022)
8.3.3 Europe Biogas Power Plants Revenue (USD Million) by Applications (2018-2022)
8.4 Asia Pacific Biogas Power Plants Revenue (USD Million), and Revenue (USD Million) by Type, and Applications (2018-2022)
8.4.1 Asia Pacific Biogas Power Plants Revenue (USD Million) by Country (2018-2022)
8.4.2 Asia Pacific Biogas Power Plants Revenue (USD Million) by Type (2018-2022)
8.4.3 Asia Pacific Biogas Power Plants Revenue (USD Million) by Applications (2018-2022)
8.5 South America Biogas Power Plants Revenue (USD Million), by Type, and Applications (2018-2022)
8.5.1 South America Biogas Power Plants Revenue (USD Million), by Country (2018-2022)
8.5.2 South America Biogas Power Plants Revenue (USD Million) by Type (2018-2022)
8.5.3 South America Biogas Power Plants Revenue (USD Million) by Applications (2018-2022)
8.6 Middle East and Africa Biogas Power Plants Revenue (USD Million), by Type, Technology, Application, Thickness (2018-2022)
8.6.1 Middle East and Africa Biogas Power Plants Revenue (USD Million) by Country (2018-2022)
8.6.2 Middle East and Africa Biogas Power Plants Revenue (USD Million) by Type (2018-2022)
8.6.3 Middle East and Africa Biogas Power Plants Revenue (USD Million) by Applications (2018-2022)
9 Company Profiles
10 Global Biogas Power Plants Market Revenue (USD Million), by Type, and Applications (2023-2030)
10.1 Global Biogas Power Plants Revenue (USD Million) and Market Share (%) by Type (2023-2030)
10.1.1 Global Biogas Power Plants Revenue (USD Million), and Market Share (%) by Type (2023-2030)
10.2 Global Biogas Power Plants Revenue (USD Million) and Market Share (%) by Applications (2023-2030)
10.2.1 Global Biogas Power Plants Revenue (USD Million), and Market Share (%) by Applications (2023-2030)
11 Global Biogas Power Plants Development Regional Status and Outlook Forecast
11.1 Global Biogas Power Plants Revenue (USD Million) By Regions (2023-2030)
11.2 North America Biogas Power Plants Revenue (USD Million) by Type, and Applications (2023-2030)
11.2.1 North America Biogas Power Plants Revenue (USD) Million by Country (2023-2030)
11.2.2 North America Biogas Power Plants Revenue (USD Million), by Type (2023-2030)
11.2.3 North America Biogas Power Plants Revenue (USD Million), Market Share (%) by Applications (2023-2030)
11.3 Europe Biogas Power Plants Revenue (USD Million), by Type, and Applications (2023-2030)
11.3.1 Europe Biogas Power Plants Revenue (USD Million), by Country (2023-2030)
11.3.2 Europe Biogas Power Plants Revenue (USD Million), by Type (2023-2030)
11.3.3 Europe Biogas Power Plants Revenue (USD Million), by Applications (2023-2030)
11.4 Asia Pacific Biogas Power Plants Revenue (USD Million) by Type, and Applications (2023-2030)
11.4.1 Asia Pacific Biogas Power Plants Revenue (USD Million), by Country (2023-2030)
11.4.2 Asia Pacific Biogas Power Plants Revenue (USD Million), by Type (2023-2030)
11.4.3 Asia Pacific Biogas Power Plants Revenue (USD Million), by Applications (2023-2030)
11.5 South America Biogas Power Plants Revenue (USD Million), by Type, and Applications (2023-2030)
11.5.1 South America Biogas Power Plants Revenue (USD Million), by Country (2023-2030)
11.5.2 South America Biogas Power Plants Revenue (USD Million), by Type (2023-2030)
11.5.3 South America Biogas Power Plants Revenue (USD Million), by Applications (2023-2030)
11.6 Middle East and Africa Biogas Power Plants Revenue (USD Million), by Type, and Applications (2023-2030)
11.6.1 Middle East and Africa Biogas Power Plants Revenue (USD Million), by region (2023-2030)
11.6.2 Middle East and Africa Biogas Power Plants Revenue (USD Million), by Type (2023-2030)
11.6.3 Middle East and Africa Biogas Power Plants Revenue (USD Million), by Applications (2023-2030)
12 Methodology and Data Sources
12.1 Methodology/Research Approach
12.1.1 Research Programs/Design
12.1.2 Market Size Estimation
12.1.3 Market Breakdown and Data Triangulation
12.2 Data Sources
12.2.1 Secondary Sources
12.2.2 Primary Sources
12.3 Disclaimer
List of Tables
Table 1 Market Segmentation Analysis
Table 2 Global Biogas Power Plants Market Companies with Areas Served
Table 3 Products Offerings Global Biogas Power Plants Market
Table 4 Low Growth Scenario Forecasts
Table 5 Reference Case Growth Scenario
Table 6 High Growth Case Scenario
Table 7 Global Biogas Power Plants Revenue (USD Million) And CAGR (%) By Type (2018-2030)
Table 8 Global Biogas Power Plants Revenue (USD Million) And CAGR (%) By Applications (2018-2030)
Table 9 Global Biogas Power Plants Revenue (USD Million) And CAGR (%) By Regions (2018-2030)
Table 10 Global Biogas Power Plants Revenue (USD Million) By Type (2018-2022)
Table 11 Global Biogas Power Plants Revenue Market Share (%) By Type (2018-2022)
Table 12 Global Biogas Power Plants Revenue (USD Million) By Applications (2018-2022)
Table 13 Global Biogas Power Plants Revenue Market Share (%) By Applications (2018-2022)
Table 14 Global Biogas Power Plants Market Revenue (USD Million) By Regions (2018-2022)
Table 15 Global Biogas Power Plants Market Share (%) By Regions (2018-2022)
Table 16 North America Biogas Power Plants Revenue (USD Million) By Country (2018-2022)
Table 17 North America Biogas Power Plants Revenue (USD Million) By Type (2018-2022)
Table 18 North America Biogas Power Plants Revenue (USD Million) By Applications (2018-2022)
Table 19 Europe Biogas Power Plants Revenue (USD Million) By Country (2018-2022)
Table 20 Europe Biogas Power Plants Revenue (USD Million) By Type (2018-2022)
Table 21 Europe Biogas Power Plants Revenue (USD Million) By Applications (2018-2022)
Table 22 Asia Pacific Biogas Power Plants Revenue (USD Million) By Country (2018-2022)
Table 23 Asia Pacific Biogas Power Plants Revenue (USD Million) By Type (2018-2022)
Table 24 Asia Pacific Biogas Power Plants Revenue (USD Million) By Applications (2018-2022)
Table 25 South America Biogas Power Plants Revenue (USD Million) By Country (2018-2022)
Table 26 South America Biogas Power Plants Revenue (USD Million) By Type (2018-2022)
Table 27 South America Biogas Power Plants Revenue (USD Million) By Applications (2018-2022)
Table 28 Middle East and Africa Biogas Power Plants Revenue (USD Million) By Region (2018-2022)
Table 29 Middle East and Africa Biogas Power Plants Revenue (USD Million) By Type (2018-2022)
Table 30 Middle East and Africa Biogas Power Plants Revenue (USD Million) By Applications (2018-2022)
Table 31 Financial Analysis
Table 32 Global Biogas Power Plants Revenue (USD Million) By Type (2023-2030)
Table 33 Global Biogas Power Plants Revenue Market Share (%) By Type (2023-2030)
Table 34 Global Biogas Power Plants Revenue (USD Million) By Applications (2023-2030)
Table 35 Global Biogas Power Plants Revenue Market Share (%) By Applications (2023-2030)
Table 36 Global Biogas Power Plants Market Revenue (USD Million), And Revenue (USD Million) By Regions (2023-2030)
Table 37 North America Biogas Power Plants Revenue (USD)By Country (2023-2030)
Table 38 North America Biogas Power Plants Revenue (USD Million) By Type (2023-2030)
Table 39 North America Biogas Power Plants Revenue (USD Million) By Applications (2023-2030)
Table 40 Europe Biogas Power Plants Revenue (USD Million) By Country (2023-2030)
Table 41 Europe Biogas Power Plants Revenue (USD Million) By Type (2023-2030)
Table 42 Europe Biogas Power Plants Revenue (USD Million) By Applications (2023-2030)
Table 43 Asia Pacific Biogas Power Plants Revenue (USD Million) By Country (2023-2030)
Table 44 Asia Pacific Biogas Power Plants Revenue (USD Million) By Type (2023-2030)
Table 45 Asia Pacific Biogas Power Plants Revenue (USD Million) By Applications (2023-2030)
Table 46 South America Biogas Power Plants Revenue (USD Million) By Country (2023-2030)
Table 47 South America Biogas Power Plants Revenue (USD Million) By Type (2023-2030)
Table 48 South America Biogas Power Plants Revenue (USD Million) By Applications (2023-2030)
Table 49 Middle East and Africa Biogas Power Plants Revenue (USD Million) By Region (2023-2030)
Table 50 Middle East and Africa Biogas Power Plants Revenue (USD Million) By Region (2023-2030)
Table 51 Middle East and Africa Biogas Power Plants Revenue (USD Million) By Type (2023-2030)
Table 52 Middle East and Africa Biogas Power Plants Revenue (USD Million) By Applications (2023-2030)
Table 53 Research Programs/Design for This Report
Table 54 Key Data Information from Secondary Sources
Table 55 Key Data Information from Primary Sources
List of Figures
Figure 1 Market Scope
Figure 2 Porter’s Five Forces
Figure 3 Global Biogas Power Plants Revenue (USD Million) By Type (2018-2022)
Figure 4 Global Biogas Power Plants Revenue Market Share (%) By Type (2022)
Figure 5 Global Biogas Power Plants Revenue (USD Million) By Applications (2018-2022)
Figure 6 Global Biogas Power Plants Revenue Market Share (%) By Applications (2022)
Figure 7 Global Biogas Power Plants Market Revenue (USD Million) By Regions (2018-2022)
Figure 8 Global Biogas Power Plants Market Share (%) By Regions (2022)
Figure 9 North America Biogas Power Plants Revenue (USD Million) By Country (2018-2022)
Figure 10 North America Biogas Power Plants Revenue (USD Million) By Type (2018-2022)
Figure 11 North America Biogas Power Plants Revenue (USD Million) By Applications (2018-2022)
Figure 12 Europe Biogas Power Plants Revenue (USD Million) By Country (2018-2022)
Figure 13 Europe Biogas Power Plants Revenue (USD Million) By Type (2018-2022)
Figure 14 Europe Biogas Power Plants Revenue (USD Million) By Applications (2018-2022)
Figure 15 Asia Pacific Biogas Power Plants Revenue (USD Million) By Country (2018-2022)
Figure 16 Asia Pacific Biogas Power Plants Revenue (USD Million) By Type (2018-2022)
Figure 17 Asia Pacific Biogas Power Plants Revenue (USD Million) By Applications (2018-2022)
Figure 18 South America Biogas Power Plants Revenue (USD Million) By Country (2018-2022)
Figure 19 South America Biogas Power Plants Revenue (USD Million) By Type (2018-2022)
Figure 20 South America Biogas Power Plants Revenue (USD Million) By Applications (2018-2022)
Figure 21 Middle East and Africa Biogas Power Plants Revenue (USD Million) By Region (2018-2022)
Figure 22 Middle East and Africa Biogas Power Plants Revenue (USD Million) By Type (2018-2022)
Figure 23 Middle East and Africa Biogas Power Plants Revenue (USD Million) By Applications (2018-2022)
Figure 24 Global Biogas Power Plants Revenue (USD Million) By Type (2023-2030)
Figure 25 Global Biogas Power Plants Revenue Market Share (%) By Type (2030)
Figure 26 Global Biogas Power Plants Revenue (USD Million) By Applications (2023-2030)
Figure 27 Global Biogas Power Plants Revenue Market Share (%) By Applications (2030)
Figure 28 Global Biogas Power Plants Market Revenue (USD Million) By Regions (2023-2030)
Figure 29 North America Biogas Power Plants Revenue (USD Million) By Country (2023-2030)
Figure 30 North America Biogas Power Plants Revenue (USD Million) By Type (2023-2030)
Figure 31 North America Biogas Power Plants Revenue (USD Million) By Applications (2023-2030)
Figure 32 Europe Biogas Power Plants Revenue (USD Million) By Country (2023-2030)
Figure 33 Europe Biogas Power Plants Revenue (USD Million) By Type (2023-2030)
Figure 34 Europe Biogas Power Plants Revenue (USD Million) By Applications (2023-2030)
Figure 35 Asia Pacific Biogas Power Plants Revenue (USD Million) By Country (2023-2030)
Figure 36 Asia Pacific Biogas Power Plants Revenue (USD Million) By Type (2023-2030)
Figure 37 Asia Pacific Biogas Power Plants Revenue (USD Million) By Applications (2023-2030)
Figure 38 South America Biogas Power Plants Revenue (USD Million) By Country (2023-2030)
Figure 39 South America Biogas Power Plants Revenue (USD Million) By Type (2023-2030)
Figure 40 South America Biogas Power Plants Revenue (USD Million) By Applications (2023-2030)
Figure 41 Middle East and Africa Biogas Power Plants Revenue (USD Million) By Region (2023-2030)
Figure 42 Middle East and Africa Biogas Power Plants Revenue (USD Million) By Region (2023-2030)
Figure 43 Middle East and Africa Biogas Power Plants Revenue (USD Million) By Type (2023-2030)
Figure 44 Middle East and Africa Biogas Power Plants Revenue (USD Million) By Applications (2023-2030)
Figure 45 Bottom-Up and Top-Down Approaches for This Report
Figure 46 Data Triangulation
