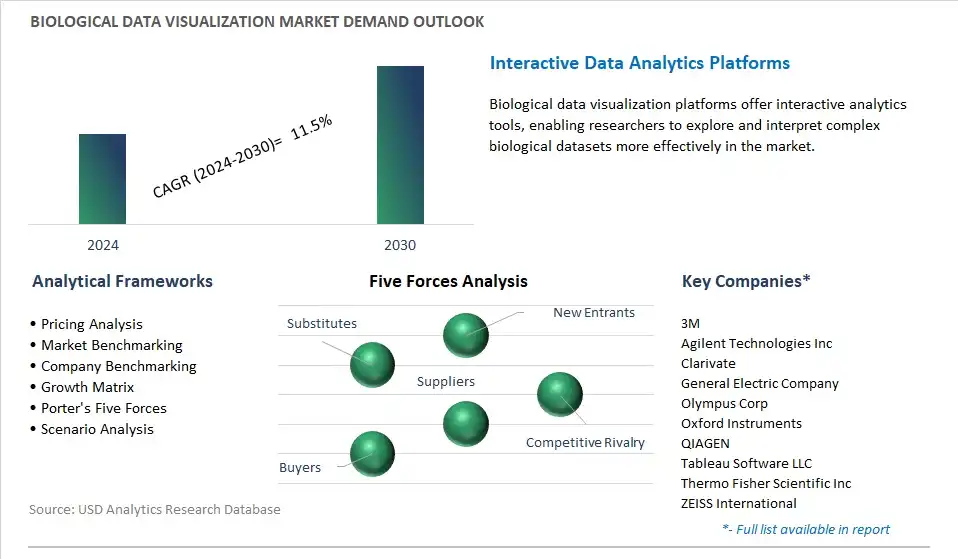
Biological Data Visualization Market is estimated to increase at a growth rate of 11.5% CAGR over the forecast period from 2024 to 2030.
The Biological Data Visualization Market study analyzes and forecasts the market size across 6 regions and 24 countries for diverse segments including By Technique (Microscopy, Magnetic resonance imaging, Sequencing, X-ray Crystallography, Others), By Application (Cell and Organism Imaging, Structural biology and Molecular Modeling, Genomic Analysis, Alignments, phylogeny, and Evolution, Systems Biology), By Platform (Windows, Mac OS, Linux, Others), By End-User (Academic Research, Pharma & Biotech Companies, Hospitals & Clinics, Others).
An Introduction to Biological Data Visualization Market in 2024
The Biological Data Visualization market in 2024 encompasses a wide array of software tools, platforms, and techniques designed to visualize complex biological data sets, enabling researchers, scientists, and clinicians to gain insights, identify patterns, and communicate findings effectively. With the proliferation of high-throughput sequencing, omics technologies, and imaging modalities generating massive amounts of biological data, there is a growing need for advanced visualization solutions that can distill complex data into intuitive and informative visual representations. Biological data visualization platforms leverage interactive graphics, 3D modeling, and data analytics to facilitate exploration and interpretation of genomic sequences, protein structures, cellular pathways, and multi-dimensional datasets. As biomedical research and personalized medicine initiatives continue to generate vast amounts of biological data, the biological data visualization market is poised for significant growth, driving innovation in data visualization techniques, software algorithms, and user interfaces to empower researchers and clinicians in their quest for scientific discovery and medical breakthroughs.
Biological Data Visualization Market Trend: Integration of Advanced Visualization Technologies
A significant trend in the Biological Data Visualization market is the integration of advanced visualization technologies, such as virtual reality (VR), augmented reality (AR), and 3D visualization techniques. As biological research generates increasingly complex datasets, there is a growing need for innovative visualization tools that can effectively represent and interpret biological information. Researchers and scientists are turning to immersive visualization platforms to explore intricate biological structures, pathways, and interactions in three-dimensional space, facilitating deeper insights and discoveries in areas such as genomics, proteomics, and drug discovery.
Biological Data Visualization Market Driver: Rising Demand for Data-driven Insights in Life Sciences
A key driver for the Biological Data Visualization market is the rising demand for data-driven insights in the life sciences industry. With the advent of high-throughput technologies and big data analytics, the volume and complexity of biological data have surged exponentially. Researchers, pharmaceutical companies, and biotechnology firms require advanced visualization solutions to analyze, interpret, and communicate vast amounts of genomic, proteomic, and metabolomic data effectively. Biological data visualization tools empower scientists to visualize patterns, trends, and correlations within datasets, accelerating the discovery of novel biomarkers, therapeutic targets, and drug candidates.
Biological Data Visualization Market Opportunity: Personalized Visualization Solutions
One potential opportunity in the Biological Data Visualization market lies in the development of personalized visualization solutions tailored to the specific needs of individual researchers and institutions. As biological research becomes increasingly specialized and diverse, there is a growing demand for customizable visualization platforms that can adapt to varying data types, experimental workflows, and scientific objectives. Companies have the opportunity to offer flexible visualization software packages that allow users to tailor visualization parameters, integrate proprietary algorithms, and create interactive dashboards optimized for their research applications. By providing personalized visualization solutions, vendors can address the unique requirements of different research domains, enhance user experience, and foster long-term customer loyalty.
Biological Data Visualization Market Segmentation
By Technique
- Microscopy
- Magnetic resonance imaging
- Sequencing
- X-ray Crystallography
- Others
By Application
- Cell and Organism Imaging
- Structural biology and Molecular Modeling
- Genomic Analysis
- Alignments, phylogeny, and Evolution
- Systems Biology
By Platform
- Windows
- Mac OS
- Linux
- Others
By End-user
- Academic Research
- Pharma & Biotech Companies
- Hospitals & Clinics
- Others
Geographical Analysis
- North America (United States, Canada, Mexico)
- Europe (Germany, France, United Kingdom, Spain, Italy, Rest of Europe)
- Asia Pacific (China, India, Japan, South Korea, Rest of Asia Pacific)
- South America (Brazil, Argentina, Rest of South America)
- Middle East and Africa (Saudi Arabia, UAE, Rest of Middle East, South Africa, Egypt, Rest of Africa)
Biological Data Visualization Market Companies
- 3M
- Agilent Technologies Inc
- Clarivate
- General Electric Company
- Olympus Corp
- Oxford Instruments
- QIAGEN
- Tableau Software LLC
- Thermo Fisher Scientific Inc
- ZEISS International
*- List Not Exhaustive
Reasons to Buy the Biological Data Visualization Market Study
• Deepen your industry insights and navigate uncertainties for strategy formulation, CAPEX, and Operational decisions
• Gain access to detailed insights on the Biological Data Visualization Market, encompassing current market size, growth trends, and forecasts till 2030.
• Access detailed competitor analysis, enabling competitive advantage through a thorough understanding of market players, strategies, and potential differentiation opportunities
• Stay ahead of the curve with insights on technological advancements, innovations, and upcoming trends
• Identify lucrative investment avenues and expansion opportunities within the Biological Data Visualization Market industry, guided by robust, data-backed analysis.
• Understand regional and global markets through country-wise analysis, regional market potential, regulatory nuances, and dynamics
• Execute strategies with confidence and speed through information, analytics, and insights on the industry value chain
• Corporate leaders, strategists, financial experts, shareholders, asset managers, and governmental representatives can make long-term planning scenarios and build an integrated and timely understanding of market dynamics
• Benefit from tailored solutions and expert consultation based on report insights, providing personalized strategies aligned with specific business needs.
TABLE OF CONTENTS
1 Introduction to 2024 Biological Data Visualization Market
1.1 Market Overview
1.2 Quick Facts
1.3 Scope/Objective of the Study
1.4 Market Definition
1.5 Countries and Regions Analyzed
1.6 Units, Currency, and Conversions
1.7 Industry Value Chain
2 Research Methodology
2.1 Market Size Estimation
2.2 Sources and Research Methodology
2.3 Data Triangulation
2.4 Assumptions and Limitations
3 Executive Summary
3.1 Global Biological Data Visualization Market Size Outlook, $ Million, 2021 to 2030
3.2 Biological Data Visualization Market Outlook by Type, $ Million, 2021 to 2030
3.3 Biological Data Visualization Market Outlook by Product, $ Million, 2021 to 2030
3.4 Biological Data Visualization Market Outlook by Application, $ Million, 2021 to 2030
3.5 Biological Data Visualization Market Outlook by Key Countries, $ Million, 2021 to 2030
4 Market Dynamics
4.1 Key Driving Forces of Biological Data Visualization Market Industry
4.2 Key Market Trends in Biological Data Visualization Market Industry
4.3 Potential Opportunities in Biological Data Visualization Market Industry
4.4 Key Challenges in Biological Data Visualization Market Industry
5 Market Factor Analysis
5.1 Competitive Landscape
5.1.1 Global Biological Data Visualization Market Share by Company (%), 2023
5.1.2 Product Offerings by Company
5.2 Porter’s Five Forces Analysis
6 Growth Outlook Across Scenarios
6.1 Growth Analysis-Case Scenario Definitions
6.2 Low Growth Scenario Forecasts
6.3 Reference Growth Scenario Forecasts
6.4 High Growth Scenario Forecasts
7 Global Biological Data Visualization Market Outlook By Segments
7.1 Biological Data Visualization Market Outlook by Segments
By Technique
Microscopy
Magnetic resonance imaging
Sequencing
X-ray Crystallography
Others
By Application
Cell and Organism Imaging
Structural biology and Molecular Modeling
Genomic Analysis
Alignments, phylogeny, and Evolution
Systems Biology
By Platform
Windows
Mac OS
Linux
Others
By End-user
Academic Research
Pharma & Biotech Companies
Hospitals & Clinics
Others
8 North America Biological Data Visualization Market Analysis And Outlook To 2030
8.1 Introduction to North America Biological Data Visualization Markets in 2024
8.2 North America Biological Data Visualization Market Size Outlook by Country, 2021-2030
8.2.1 United States
8.2.2 Canada
8.2.3 Mexico
8.3 North America Biological Data Visualization Market size Outlook by Segments, 2021-2030
By Technique
Microscopy
Magnetic resonance imaging
Sequencing
X-ray Crystallography
Others
By Application
Cell and Organism Imaging
Structural biology and Molecular Modeling
Genomic Analysis
Alignments, phylogeny, and Evolution
Systems Biology
By Platform
Windows
Mac OS
Linux
Others
By End-user
Academic Research
Pharma & Biotech Companies
Hospitals & Clinics
Others
9 Europe Biological Data Visualization Market Analysis And Outlook To 2030
9.1 Introduction to Europe Biological Data Visualization Markets in 2024
9.2 Europe Biological Data Visualization Market Size Outlook by Country, 2021-2030
9.2.1 Germany
9.2.2 France
9.2.3 Spain
9.2.4 United Kingdom
9.2.4 Italy
9.2.5 Russia
9.2.6 Norway
9.2.7 Rest of Europe
9.3 Europe Biological Data Visualization Market Size Outlook By Segments, 2021-2030
By Technique
Microscopy
Magnetic resonance imaging
Sequencing
X-ray Crystallography
Others
By Application
Cell and Organism Imaging
Structural biology and Molecular Modeling
Genomic Analysis
Alignments, phylogeny, and Evolution
Systems Biology
By Platform
Windows
Mac OS
Linux
Others
By End-user
Academic Research
Pharma & Biotech Companies
Hospitals & Clinics
Others
10 Asia Pacific Biological Data Visualization Market Analysis And Outlook To 2030
10.1 Introduction to Asia Pacific Biological Data Visualization Markets in 2024
10.2 Asia Pacific Biological Data Visualization Market Size Outlook by Country, 2021-2030
10.2.1 China
10.2.2 India
10.2.3 Japan
10.2.4 South Korea
10.2.5 Indonesia
10.2.6 Malaysia
10.2.7 Australia
10.2.8 Rest of Asia Pacific
10.3 Asia Pacific Biological Data Visualization Market size Outlook by Segments, 2021-2030
By Technique
Microscopy
Magnetic resonance imaging
Sequencing
X-ray Crystallography
Others
By Application
Cell and Organism Imaging
Structural biology and Molecular Modeling
Genomic Analysis
Alignments, phylogeny, and Evolution
Systems Biology
By Platform
Windows
Mac OS
Linux
Others
By End-user
Academic Research
Pharma & Biotech Companies
Hospitals & Clinics
Others
11 South America Biological Data Visualization Market Analysis And Outlook To 2030
11.1 Introduction to South America Biological Data Visualization Markets in 2024
11.2 South America Biological Data Visualization Market Size Outlook by Country, 2021-2030
11.2.1 Brazil
11.2.2 Argentina
11.2.3 Rest of South America
11.3 South America Biological Data Visualization Market size Outlook by Segments, 2021-2030
By Technique
Microscopy
Magnetic resonance imaging
Sequencing
X-ray Crystallography
Others
By Application
Cell and Organism Imaging
Structural biology and Molecular Modeling
Genomic Analysis
Alignments, phylogeny, and Evolution
Systems Biology
By Platform
Windows
Mac OS
Linux
Others
By End-user
Academic Research
Pharma & Biotech Companies
Hospitals & Clinics
Others
12 Middle East And Africa Biological Data Visualization Market Analysis And Outlook To 2030
12.1 Introduction to Middle East and Africa Biological Data Visualization Markets in 2024
12.2 Middle East and Africa Biological Data Visualization Market Size Outlook by Country, 2021-2030
12.2.1 Saudi Arabia
12.2.2 UAE
12.2.3 Oman
12.2.4 Rest of Middle East
12.2.5 Egypt
12.2.6 Nigeria
12.2.7 South Africa
12.2.8 Rest of Africa
12.3 Middle East and Africa Biological Data Visualization Market size Outlook by Segments, 2021-2030
By Technique
Microscopy
Magnetic resonance imaging
Sequencing
X-ray Crystallography
Others
By Application
Cell and Organism Imaging
Structural biology and Molecular Modeling
Genomic Analysis
Alignments, phylogeny, and Evolution
Systems Biology
By Platform
Windows
Mac OS
Linux
Others
By End-user
Academic Research
Pharma & Biotech Companies
Hospitals & Clinics
Others
13 Company Profiles
13.1 Company Snapshot
13.2 SWOT Profiles
13.3 Products and Services
13.4 Recent Developments
13.5 Financial Profile
List of Companies
3M
Agilent Technologies Inc
Clarivate
General Electric Company
Olympus Corp
Oxford Instruments
QIAGEN
Tableau Software LLC
Thermo Fisher Scientific Inc
ZEISS International
14 Appendix
14.1 Customization Offerings
14.2 Subscription Services
14.3 Related Reports
14.4 Publisher Expertise
