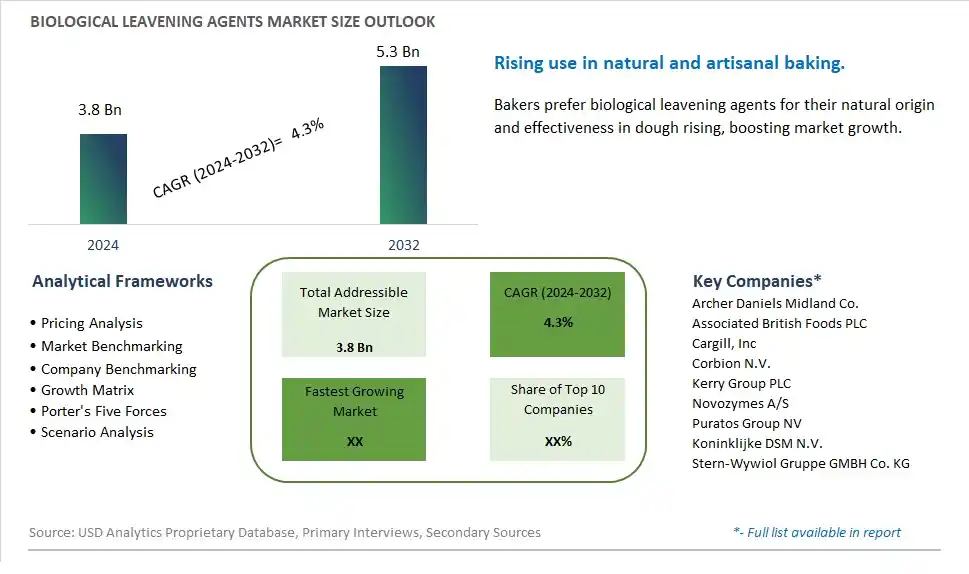
Global Biological Leavening Agents Market Size is valued at $3.8 Billion in 2024 and is forecast to register a growth rate (CAGR) of 4.3% to reach $5.3 Billion by 2032.
The global Biological Leavening Agents Market Comprehensive Study analyzes and forecasts the market size across 6 regions and 24 countries for diverse segments -By Type (Organic, Conventional), By Application (Bakery, Confectionery, Savory Biscuits & Crackers, Food Products, Others)
An Introduction to Biological Leavening Agents Market
The Biological Leavening Agents market in 2024 is expanding, driven by the increasing demand for natural and clean-label baking ingredients. Biological leavening agents, such as yeast and sourdough starters, are essential for achieving the desired rise, texture, and flavor in baked goods. The market is supported by the growing consumer preference for artisanal and home-baked products that use traditional and natural leavening methods. Advances in microbiology and fermentation technologies are enhancing the performance and consistency of biological leavening agents. The market is also benefiting from the trend towards health-conscious and minimally processed foods, as consumers seek out natural and wholesome baking solutions.
Biological Leavening Agents Competitive Landscape
The market report analyses the leading companies in the industry including Archer Daniels Midland Co., Associated British Foods PLC, Cargill, Inc, Corbion N.V., Kerry Group PLC, Novozymes A/S, Puratos Group NV, Koninklijke DSM N.V., Stern-Wywiol Gruppe GMBH Co. KG, and Others.
Biological Leavening Agents Market Dynamics
Biological Leavening Agents Market Trend: Growing Demand for Clean Label and Natural Ingredients
The most prominent market trend for Biological Leavening Agents is the growing demand for clean label and natural ingredients. Consumers are increasingly conscious of the ingredients used in food products and prefer formulations that are free from artificial additives, preservatives, and synthetic leavening agents. Biological leavening agents, such as yeast and sourdough starters, are perceived as natural, traditional, and healthier alternatives that contribute to clean label products. This trend reflects a broader shift towards clean eating, transparency in food labeling, and a preference for ingredients that align with natural and sustainable food choices.
Biological Leavening Agents Market Driver: Health and Wellness Trends in Baking Industry
A key market driver for Biological Leavening Agents is the health and wellness trends in the baking industry. As consumers become more health-conscious and seek wholesome baked goods, there is a growing demand for leavening agents that not only provide excellent rising properties but also offer potential nutritional benefits. Biological leavening agents, particularly sourdough starters, are known for their fermentation process, which enhances flavor, texture, and digestibility of baked products. The driver of health and wellness trends in the baking industry propels the adoption of biological leavening agents as essential ingredients in creating nutritious and flavorful bakery items.
Biological Leavening Agents Market Opportunity: Development of Specialty and Functional Leavening Agents
A potential opportunity within the Biological Leavening Agents market lies in the development of specialty and functional leavening agents. Collaborating with food scientists and fermentation experts can lead to the creation of specialized leavening agents that offer unique flavors, textures, and functional properties to baked goods. For example, developing pre-fermented doughs, natural enzyme-based leavening systems, or incorporating probiotic strains into leavening agents can provide added value to bakery products. Additionally, exploring opportunities to market these specialty leavening agents as premium or artisanal ingredients can cater to discerning consumers looking for high-quality and innovative baking solutions. By focusing on the development of specialty and functional leavening agents, there are opportunities to differentiate products, meet consumer preferences for unique bakery experiences, and capitalize on the growing demand for healthier and flavorful baked goods.
Biological Leavening Agents Market Share Analysis: Conventional segment generated the highest revenue share in the industry
In the Biological Leavening Agents Market, the largest segment is Conventional leavening agents. Conventional leavening agents refer to those that are traditionally used in baking and food production processes and are not certified as organic. These agents include yeast, baking powder, and baking soda, among others. The fast growth of the Conventional segment can be attributed to several factors. Firstly, conventional leavening agents have been widely adopted in the food industry for many years due to their effectiveness, reliability, and consistent performance in producing light and fluffy baked goods. Additionally, conventional leavening agents are generally more cost-effective and readily available compared to organic alternatives, making them a preferred choice for many food manufacturers, especially those operating on larger scales. Further, the familiarity and established reputation of conventional leavening agents among consumers contribute to the dominance of this segment in the Biological Leavening Agents Market.
Biological Leavening Agents Market Share Analysis: Bakery is the fastest growing segment over the forecast period to 2032
Within the Biological Leavening Agents Market, the Bakery segment is anticipated to be the fastest growing up to 2032. The rapid growth of leavening agents in bakery applications can be attributed to several key factors. Firstly, the increasing demand for baked goods, including bread, pastries, cakes, and muffins, globally drives the growth of this segment. Leavening agents play a crucial role in bakery products, helping to create the desired texture, rise, and structure. Additionally, consumer preferences for freshly baked and artisanal products contribute to the demand for high-quality leavening agents in bakeries. Furthermore, advancements in bakery technology and innovation in leavening agent formulations are enhancing the efficiency and performance of these agents, meeting the evolving needs of bakery manufacturers. The Bakery segment presents significant growth opportunities as the bakery industry continues to expand, driven by changing consumer lifestyles, dietary preferences, and the popularity of bakery products worldwide.
Biological Leavening Agents Market Segmentation
By Type
Organic
Conventional
By Application
Bakery
Confectionery
Savory Biscuits & Crackers
Food Products
Others
Countries Analyzed
North America (US, Canada, Mexico)
Europe (Germany, UK, France, Spain, Italy, Russia, Rest of Europe)
Asia Pacific (China, India, Japan, South Korea, Australia, South East Asia, Rest of Asia)
South America (Brazil, Argentina, Rest of South America)
Middle East and Africa (Saudi Arabia, UAE, Rest of Middle East, South Africa, Egypt, Rest of Africa)
Biological Leavening Agents Companies Profiled in the Study
Archer Daniels Midland Co.
Associated British Foods PLC
Cargill, Inc
Corbion N.V.
Kerry Group PLC
Novozymes A/S
Puratos Group NV
Koninklijke DSM N.V.
Stern-Wywiol Gruppe GMBH Co. KG
*- List Not Exhaustive
Chapter 1. TABLE OF CONTENTS
Chapter 2. Introduction to Biological Leavening Agents Market
2.1. Market Overview
2.2. Key Statistics and Report Highlights
2.3. Scope of the Comprehensive Study
2.3.1. Market Definition
2.3.2 Countries and Regions Covered
2.3.3 Research Objective
2.3.4 Units, Currency, and Conversions
2.3.5 Industry Value Chain
2.4. Key Market Segments
2.5. Key Companies
2.6. Study Period
Chapter 3. Strategic Analysis Review
3.1. Biological Leavening Agents Pricing Analysis and Forecast
3.2. Porter’s Five Forces
3.3. Market Ecosystem
3.4. SWOT Analysis
3.5. Regulatory Scenario
3.3. Effects of Inflation, Russia-Ukraine War, moderating economic growth, and other macroeconomic factors
Chapter 4. Competitive Landscape
4.1. Market Share Analysis
4.1.1. Global Biological Leavening Agents Market Share by Company, 2023
4.1.2. Product Offerings of Leading Biological Leavening Agents Companies
4.2. Market Entropy
4.2.1. New Product Launches in the Industry
4.2.2. Mergers, Acquisitions, Joint ventures, and Partnerships
4.3. Key Strategies and Best Practices
Chapter 5. Global Market Projections: Best, Reference, and Low Case Scenarios
5.1. Growth Analysis- Case Scenario Definitions
5.2. Low Growth Case Scenario Forecasts
5.3. Reference Growth Case Scenario Forecasts
5.4. High Growth Case Scenario Forecasts
Chapter 6. Market Dynamics
6.1. Biological Leavening Agents Market Drivers
6.2. Biological Leavening Agents Market Challenges
6.6. Biological Leavening Agents Market Opportunities
6.4. Biological Leavening Agents Market Trends
Chapter 7. Global Biological Leavening Agents Market Outlook Trends
7.1. Global Biological Leavening Agents Revenue (USD Million) and CAGR (%) by Type (2021-2032)
7.2. Global Biological Leavening Agents Revenue (USD Million) and CAGR (%) by Application (2021-2032)
7.3. Global Biological Leavening Agents Revenue (USD Million) and CAGR (%) by Product (2021-2032)
By Type
Organic
Conventional
By Application
Bakery
Confectionery
Savory Biscuits & Crackers
Food Products
Others
Chapter 8. Global Biological Leavening Agents Regional Analysis and Outlook
8.1. Global Biological Leavening Agents Revenue (USD Million) By Regions (2021- 2032)
8.2. North America Biological Leavening Agents Revenue (USD Million) by Country (2021-2032)
8.2.1. United States Biological Leavening Agents Regional Analysis and Outlook
8.2.2. Canada Biological Leavening Agents Regional Analysis and Outlook
8.2.3. Mexico Biological Leavening Agents Regional Analysis and Outlook
8.3. Europe Biological Leavening Agents Revenue (USD Million), by Country (2021-2032)
8.3.1. Germany Biological Leavening Agents Regional Analysis and Outlook
8.3.2. France Biological Leavening Agents Regional Analysis and Outlook
8.3.3. United Kingdom Biological Leavening Agents Regional Analysis and Outlook
8.3.4. Spain Biological Leavening Agents Regional Analysis and Outlook
8.3.5. Italy Biological Leavening Agents Regional Analysis and Outlook
8.3.6. Russia Biological Leavening Agents Regional Analysis and Outlook
8.3.7. Rest of Europe Biological Leavening Agents Regional Analysis and Outlook
8.4. Asia Pacific Biological Leavening Agents Revenue (USD Million) by Country (2021-2032)
8.4.1. China Biological Leavening Agents Regional Analysis and Outlook
8.4.2. Japan Biological Leavening Agents Regional Analysis and Outlook
8.4.3. India Biological Leavening Agents Regional Analysis and Outlook
8.4.4. South Korea Biological Leavening Agents Regional Analysis and Outlook
8.4.5. Australia Biological Leavening Agents Regional Analysis and Outlook
8.4.6. South East Asia Biological Leavening Agents Regional Analysis and Outlook
8.4.7. Rest of Asia Pacific Biological Leavening Agents Regional Analysis and Outlook
8.5. South America Biological Leavening Agents Revenue (USD Million), by Country (2021-2032)
8.5.1. Brazil Biological Leavening Agents Regional Analysis and Outlook
8.5.2. Argentina Biological Leavening Agents Regional Analysis and Outlook
8.5.3. Rest of South America Biological Leavening Agents Regional Analysis and Outlook
8.6. Middle East and Africa Biological Leavening Agents Revenue (USD Million) by Country (2021-2032)
8.6.1. Middle East Biological Leavening Agents Regional Analysis and Outlook
8.6.2. Africa Biological Leavening Agents Regional Analysis and Outlook
Chapter 9. North America Biological Leavening Agents Analysis and Outlook
9.1. North America Biological Leavening Agents Revenue (USD Million) by Segments (2021-2032)
9.1.1. North America Biological Leavening Agents Revenue (USD Million) by Type (2021-2032)
9.1.2. North America Biological Leavening Agents Revenue (USD Million) by Application (2021-2032)
9.1.3. North America Biological Leavening Agents Revenue (USD Million) by Product (2021-2032)
By Type
Organic
Conventional
By Application
Bakery
Confectionery
Savory Biscuits & Crackers
Food Products
Others
Chapter 10. Europe Biological Leavening Agents Analysis and Outlook
10.1. Europe Biological Leavening Agents Revenue (USD Million), by Segments (USD Million) (2021-2032)
10.1.1. Europe Biological Leavening Agents Revenue (USD Million) by Type (2021-2032)
10.1.2. Europe Biological Leavening Agents Revenue (USD Million) by Application (2021-2032)
10.1.3. Europe Biological Leavening Agents Revenue (USD Million) by Product (2021-2032)
By Type
Organic
Conventional
By Application
Bakery
Confectionery
Savory Biscuits & Crackers
Food Products
Others
Chapter 11. Asia Pacific Biological Leavening Agents Analysis and Outlook
11.1. Asia Pacific Biological Leavening Agents Revenue (USD Million), and Revenue (USD Million) by Segments (2021-2032)
11.1.1. Asia Pacific Biological Leavening Agents Revenue (USD Million) by Type (2021-2032)
11.1.2. Asia Pacific Biological Leavening Agents Revenue (USD Million) by Application (2021-2032)
11.1.3. Asia Pacific Biological Leavening Agents Revenue (USD Million) by Product (2021-2032)
By Type
Organic
Conventional
By Application
Bakery
Confectionery
Savory Biscuits & Crackers
Food Products
Others
Chapter 12. South America Biological Leavening Agents Analysis and Outlook
12.1. South America Biological Leavening Agents Revenue (USD Million), by Segments (2021-2032)
12.1.1. South America Biological Leavening Agents Revenue (USD Million) by Type (2021-2032)
12.1.2. South America Biological Leavening Agents Revenue (USD Million) by Application (2021-2032)
12.1.3. South America Biological Leavening Agents Revenue (USD Million) by Product (2021-2032)
By Type
Organic
Conventional
By Application
Bakery
Confectionery
Savory Biscuits & Crackers
Food Products
Others
Chapter 13. Middle East and Africa Biological Leavening Agents Analysis and Outlook
13.1. Middle East and Africa Biological Leavening Agents Revenue (USD Million), by Segments (2021-2032)
13.1.1. Middle East and Africa Biological Leavening Agents Revenue (USD Million) by Type (2021-2032)
13.1.2. Middle East and Africa Biological Leavening Agents Revenue (USD Million) by Application (2021-2032)
13.1.3. Middle East and Africa Biological Leavening Agents Revenue (USD Million) by Product (2021-2032)
By Type
Organic
Conventional
By Application
Bakery
Confectionery
Savory Biscuits & Crackers
Food Products
Others
Chapter 14. Biological Leavening Agents Company Profiles
14.1 Business Overview
14.2 Product Profiles
14.3 SWOT Profiles
14.5 Recent Developments
14.6 Financial Profile
List of Companies
Archer Daniels Midland Co.
Associated British Foods PLC
Cargill, Inc
Corbion N.V.
Kerry Group PLC
Novozymes A/S
Puratos Group NV
Koninklijke DSM N.V.
Stern-Wywiol Gruppe GMBH Co. KG
15. Methodology and Data Sources
15.1 Customization Offerings
15.2 Subscription Services
15.3 Related Reports
15.4 Publisher Expertise
LIST OF TABLES
Table 1 Market Segmentation Analysis
Table 2 Global Biological Leavening Agents Market Share of Leading Companies, 2023
Table 3 Product Offerings of Leading Companies
Table 4 Low Growth Scenario Forecasts
Table 5 Reference Case Growth Scenario
Table 6 High Growth Case Scenario
Table 7 Global Biological Leavening Agents Revenue (USD Million) And CAGR (%) By Type (2021-2032)
Table 8 Global Biological Leavening Agents Revenue (USD Million) And CAGR (%) By Application (2021-2032)
Table 9 Global Biological Leavening Agents Revenue (USD Million) And CAGR (%) By Product (2021-2032)
Table 10 Global Biological Leavening Agents Market Revenue (USD Million) By Regions (2021-2032)
Table 11 Global Biological Leavening Agents Market Share (%) By Regions (2021-2032)
Table 12 North America Biological Leavening Agents Revenue (USD Million) By Country (2021-2032)
Table 13 Europe Biological Leavening Agents Revenue (USD Million) By Country (2021-2032)
Table 14 Asia Pacific Biological Leavening Agents Revenue (USD Million) By Country (2021-2032)
Table 15 South America Biological Leavening Agents Revenue (USD Million) By Country (2021-2032)
Table 16 Middle East and Africa Biological Leavening Agents Revenue (USD Million) By Region (2021-2032)
Table 17 North America Biological Leavening Agents Revenue (USD Million) By Type (2021-2032)
Table 18 North America Biological Leavening Agents Revenue (USD Million) By Application (2021-2032)
Table 19 North America Biological Leavening Agents Revenue (USD Million) By Product (2021-2032)
Table 20 Europe Biological Leavening Agents Revenue (USD Million) By Type (2021-2032)
Table 21 Europe Biological Leavening Agents Revenue (USD Million) By Application (2021-2032)
Table 22 Europe Biological Leavening Agents Revenue (USD Million) By Product (2021-2032)
Table 23 Asia Pacific Biological Leavening Agents Revenue (USD Million) By Type (2021-2032)
Table 24 Asia Pacific Biological Leavening Agents Revenue (USD Million) By Application (2021-2032)
Table 25 Asia Pacific Biological Leavening Agents Revenue (USD Million) By Product (2021-2032)
Table 26 South America Biological Leavening Agents Revenue (USD Million) By Type (2021-2032)
Table 27 South America Biological Leavening Agents Revenue (USD Million) By Application (2021-2032)
Table 28 South America Biological Leavening Agents Revenue (USD Million) By Product (2021-2032)
Table 29 Middle East and Africa Biological Leavening Agents Revenue (USD Million) By Type (2021-2032)
Table 30 Middle East and Africa Biological Leavening Agents Revenue (USD Million) By Application (2021-2032)
Table 31 Middle East and Africa Biological Leavening Agents Revenue (USD Million) By Product (2021-2032)
LIST OF FIGURES
Figure 1. Market Scope
Figure 2. Pricing Forecasts Per Unit, 2023- 2032
Figure 3. Porter’s Five Forces
Figure 4. Global Biological Leavening Agents Market Revenue (USD Million) By Regions (2021-2032)
Figure 5. Global Biological Leavening Agents Market Share (%) By Regions (2023)
Figure 6. North America Biological Leavening Agents Revenue (USD Million) By Country (2021-2032)
Figure 7. United States Biological Leavening Agents Revenue (USD Million) By Country (2021-2032)
Figure 8. Canada Biological Leavening Agents Revenue (USD Million) By Country (2021-2032)
Figure 9. Mexico Biological Leavening Agents Revenue (USD Million) By Country (2021-2032)
Figure 10. Europe Biological Leavening Agents Revenue (USD Million) By Country (2021-2032)
Figure 11. Germany Biological Leavening Agents Revenue (USD Million) By Country (2021-2032)
Figure 12. France Biological Leavening Agents Revenue (USD Million) By Country (2021-2032)
Figure 13. United Kingdom Biological Leavening Agents Revenue (USD Million) By Country (2021-2032)
Figure 14. Spain Biological Leavening Agents Revenue (USD Million) By Country (2021-2032)
Figure 15. Italy Biological Leavening Agents Revenue (USD Million) By Country (2021-2032)
Figure 16. Russia Biological Leavening Agents Revenue (USD Million) By Country (2021-2032)
Figure 17. Rest of Europe Biological Leavening Agents Revenue (USD Million) By Country (2021-2032)
Figure 11. Asia Pacific Biological Leavening Agents Revenue (USD Million) By Country (2021-2032)
Figure 12. China Biological Leavening Agents Revenue (USD Million) By Country (2021-2032)
Figure 13. Japan Biological Leavening Agents Revenue (USD Million) By Country (2021-2032)
Figure 14. India Biological Leavening Agents Revenue (USD Million) By Country (2021-2032)
Figure 15. South Korea Biological Leavening Agents Revenue (USD Million) By Country (2021-2032)
Figure 16. Australia Biological Leavening Agents Revenue (USD Million) By Country (2021-2032)
Figure 17. South East Asia Biological Leavening Agents Revenue (USD Million) By Country (2021-2032)
Figure 18. South America Biological Leavening Agents Revenue (USD Million) By Country (2021-2032)
Figure 19. Brazil Biological Leavening Agents Revenue (USD Million) By Country (2021-2032)
Figure 20. Argentina Biological Leavening Agents Revenue (USD Million) By Country (2021-2032)
Figure 21. Rest of Asia Pacific Biological Leavening Agents Revenue (USD Million) By Country (2021-2032)
Figure 22. Middle East and Africa Biological Leavening Agents Revenue (USD Million) By Region (2021-2032)
Figure 23. Saudi Arabia Biological Leavening Agents Revenue (USD Million) By Region (2021-2032)
Figure 24. The UAE Biological Leavening Agents Revenue (USD Million) By Region (2021-2032)
Figure 25. Rest of Middle East Biological Leavening Agents Revenue (USD Million) By Region (2021-2032)
Figure 26. South Africa Biological Leavening Agents Revenue (USD Million) By Region (2021-2032)
Figure 27. Africa Biological Leavening Agents Revenue (USD Million) By Region (2021-2032)
Figure 28. North America Biological Leavening Agents Revenue (USD Million) By Type (2021-2032)
Figure 29. North America Biological Leavening Agents Revenue (USD Million) By Application (2021-2032)
Figure 30. North America Biological Leavening Agents Revenue (USD Million) By Product (2021-2032)
Figure 31. Europe Biological Leavening Agents Revenue (USD Million) By Type (2021-2032)
Figure 32. Europe Biological Leavening Agents Revenue (USD Million) By Application (2021-2032)
Figure 33. Europe Biological Leavening Agents Revenue (USD Million) By Product (2021-2032)
Figure 34. Asia Pacific Biological Leavening Agents Revenue (USD Million) By Type (2021-2032)
Figure 35. Asia Pacific Biological Leavening Agents Revenue (USD Million) By Application (2021-2032)
Figure 36. Asia Pacific Biological Leavening Agents Revenue (USD Million) By Product (2021-2032)
Figure 37. South America Biological Leavening Agents Revenue (USD Million) By Type (2021-2032)
Figure 38. South America Biological Leavening Agents Revenue (USD Million) By Application (2021-2032)
Figure 39. South America Biological Leavening Agents Revenue (USD Million) By Product (2021-2032)
Figure 40. Middle East and Africa Biological Leavening Agents Revenue (USD Million) By Type (2021-2032)
Figure 41. Middle East and Africa Biological Leavening Agents Revenue (USD Million) By Application (2021-2032)
Figure 42. Middle East and Africa Biological Leavening Agents Revenue (USD Million) By Product (2021-2032)
By Type
Organic
Conventional
By Application
Bakery
Confectionery
Savory Biscuits & Crackers
Food Products
Others
Countries Analyzed
North America (US, Canada, Mexico)
Europe (Germany, UK, France, Spain, Italy, Russia, Rest of Europe)
Asia Pacific (China, India, Japan, South Korea, Australia, South East Asia, Rest of Asia)
South America (Brazil, Argentina, Rest of South America)
Middle East and Africa (Saudi Arabia, UAE, Rest of Middle East, South Africa, Egypt, Rest of Africa)
