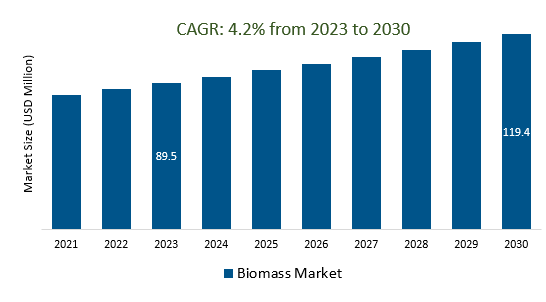
The Global Biomass Market Size is estimated to be US 89.5 Billion in 2023 and is poised to register 4.20% growth over the forecast period from 2023 to 2030 to reach US $ 119.4 billion in 2030.
The Biomass Market is driven by renewable energy policies, climate change mitigation, energy security, technological advancements, and waste reduction. Government policies promote renewable energy sources, while research into advanced biomass conversion technologies enhances efficiency and sustainability. Regional biomass initiatives aim to produce multiple products from biomass feedstocks, while supply chain optimization is crucial for efficient operation. Sustainability certifications ensure environmentally responsible sourcing of biomass feedstocks. Co-firing and cogeneration systems reduce emissions and improve energy production efficiency. International trade of biomass feedstocks, particularly wood pellets and agricultural residues is growing due to global demand. Increased investments and financing options, consumer awareness about environmental benefits, and the potential of biomass in a circular economy contribute to the growth of the biomass market.
Harnessing Carbon-Neutral Energy Sources to Reduce Greenhouse Gas Emissions is boosting the market.
The drive to combat climate change and reduce greenhouse gas emissions has led to a significant surge in the biomass market. Biomass, derived from organic materials such as wood, crop residues, and waste, offers a sustainable and carbon-neutral energy source. As countries and industries aim to transition away from fossil fuels, biomass energy has gained prominence as a viable alternative. This growth in the biomass market is not only reducing carbon footprints but also creating economic opportunities. Biomass energy production supports rural economies through the cultivation and harvesting of feedstock, while also fostering innovation in energy technology. Governments and businesses worldwide are increasingly investing in biomass projects and research to harness its potential for sustainable, low-emission energy generation. This trend underscores the crucial role that carbon-neutral energy sources play in addressing the global climate crisis.
Innovations in Conversion Technologies for Enhanced Efficiency and Sustainability is creating a demand in the market.
The rapid advancements in conversion technologies are driving a significant shift in the biomass market, as they pave the way for enhanced efficiency and sustainability. These innovations encompass a range of techniques, from cutting-edge pyrolysis and gasification processes to advanced biochemical and thermochemical conversion methods. As the world grapples with the pressing need for sustainable energy sources and reduced environmental impact, biomass is emerging as a promising solution. These innovations not only improve the efficiency of converting biomass into various valuable products, including biofuels, but also contribute to environmental sustainability by minimizing waste and emissions. Furthermore, they open up new possibilities for harnessing a wide array of biomass feedstocks, from agricultural residues to dedicated energy crops. The growing demand for cleaner and greener energy sources is fueling investment and interest in the biomass sector, making it a pivotal player in the transition towards a more sustainable energy landscape.
Biomass Utilization as A Key Solution for Waste Reduction and Landfill Relief is attracting a wide range of customers.
Biomass utilization is emerging as a pivotal solution in addressing the pressing issues of waste reduction and relieving overflowing landfills. This sustainable approach has garnered significant attention across a diverse spectrum of customers within the biomass market. By harnessing organic materials like agricultural residues, wood chips, and food waste, biomass utilization not only diverts these materials from landfills but also transforms them into valuable resources. The appeal of this eco-friendly practice extends to industries seeking alternative energy sources, environmentally conscious consumers, and policymakers aiming to meet sustainability targets. As the world increasingly prioritizes eco-conscious practices, biomass utilization stands as a promising avenue for waste management and landfill alleviation.
Market Share Analysis:
Agricultural waste is the most dominant biomass type in the biomass market.
Agricultural waste holds a paramount position in the biomass market, primarily due to its widespread availability and versatility. This category encompasses various organic materials such as crop residues, animal manure, and plant matter left over after harvests. These abundant resources play a pivotal role in sustainable energy production and environmental conservation. Agricultural waste can be converted into valuable biofuels like biogas and bioethanol through processes like anaerobic digestion and fermentation. Furthermore, these organic residues can be used for composting, enriching soil fertility, and reducing the need for synthetic fertilizers. Their potential extends beyond energy and agriculture as they serve as essential inputs to produce biodegradable plastics and various biochemicals. The dominance of agricultural waste in the biomass market not only addresses energy demands but also aligns with the global agenda of mitigating climate change and promoting a circular economy by efficiently utilizing abundant organic resources.
Solid fuel holds a prominent position within the biomass market, emerging as the most prevalent source of renewable energy.
The dominance is primarily attributed to its accessibility, efficiency, and eco-friendly characteristics. Solid biomass fuels encompass a diverse range of materials, including wood, agricultural residues, and dedicated energy crops, all of which can be converted into compact, easily transportable pellets or briquettes. One of the key advantages of solid biomass fuel is its versatility, as it can be used for various applications, including heating, electricity generation, and even as a substitute for fossil fuels in industrial processes. Furthermore, solid biomass fuels are carbon-neutral, as the carbon dioxide released during combustion is offset by the carbon absorbed during the growth of the biomass feedstock. This makes them a sustainable and environmentally friendly choice, contributing to efforts to reduce greenhouse gas emissions and combat climate change. As renewable energy demand continues to rise, solid biomass fuels are likely to play an increasingly vital role in meeting these energy needs while promoting sustainability.
The most dominant technology in the biomass market is combustion.
Combustion Technology stands as the predominant force, with a focus on solid biomass fuels such as wood, wood pellets, agricultural residues, and municipal solid waste, along with liquid biofuels like ethanol and biodiesel, and biogas derived from organic matter through anaerobic digestion. The dominance of solid biomass fuels can be attributed to their widespread availability and cost-effectiveness. Moreover, their versatility allows for applications ranging from cooking and heating to power generation. Additionally, these fuels offer the advantage of being a renewable energy source, ensuring their sustainability through natural replenishment.
Biomass Market Segmentation
By Source
Industrial
Agricultural
Municipal
- Poultry
- Swine Farm
- Dairy
- Agricultural Residue
Fuel
- Solid-Fuel
- Liquid Fuel
- Biogas
Technology
- Combustion
- Gasification
- Pyrolisis
- Anaerobic Digestion
By Region
- North America (United States, Canada, Mexico)
- Europe (Germany, France, United Kingdom, Spain, Italy, Others)
- Asia Pacific (China, India, Japan, South Korea, Australia, Others)
- Latin America (Brazil, Argentina, Others)
- Middle East and Africa (Saudi Arabia, UAE, Kuwait, Other Middle East, South Africa, Nigeria, Other Africa)
Companies Profiled in the Report
- Mitsubishi Heavy Industries, Ltd.
- Suez
- Xcel Energy Inc.
- Ramboll Group A/S
- Babcock & Wilcox Enterprises, Inc.
- Orsted A/S
- Ameresco
- General Electric
- Veolia
- Vattenfall
*lIST NOT EXHAUSTIVE
Biomass Market Outlook 2023
1 Market Overview
1.1 Introduction to the Biomass Market
1.2 Scope of the Study
1.3 Research Objective
1.3.1 Key Market Scope and Segments
1.3.2 Players Covered
1.3.3 Years Considered
2 Executive Summary
2.1 2023 Biomass Industry- Market Statistics
3 Market Dynamics
3.1 Market Drivers
3.2 Market Challenges
3.3 Market Opportunities
3.4 Market Trends
4 Market Factor Analysis
4.1 Porter’s Five Forces
4.2 Market Entropy
4.2.1 Global Biomass Market Companies with Area Served
4.2.2 Products Offerings Global Biomass Market
5 COVID-19 Impact Analysis and Outlook Scenarios
5.1.1 Covid-19 Impact Analysis
5.1.2 Post-COVID-19 Scenario- Low Growth Case
5.1.3 Post-COVID-19 Scenario- Reference Growth Case
5.1.4 Post-COVID-19 Scenario- Low Growth Case
6 Global Biomass Market Trends
6.1 Global Biomass Revenue (USD Million) and CAGR (%) by Type (2018-2030)
6.2 Global Biomass Revenue (USD Million) and CAGR (%) by Applications (2018-2030)
6.3 Global Biomass Revenue (USD Million) and CAGR (%) by Regions (2018-2030)
7 Global Biomass Market Revenue (USD Million) by Type, and Applications (2018-2022)
7.1 Global Biomass Revenue (USD Million) by Type (2018-2022)
7.1.1 Global Biomass Revenue (USD Million), Market Share (%) by Type (2018-2022)
7.2 Global Biomass Revenue (USD Million) by Applications (2018-2022)
7.2.1 Global Biomass Revenue (USD Million), Market Share (%) by Applications (2018-2022)
8 Global Biomass Development Regional Status and Outlook
8.1 Global Biomass Revenue (USD Million) By Regions (2018-2022)
8.2 North America Biomass Revenue (USD Million) by Type, and Application (2018-2022)
8.2.1 North America Biomass Revenue (USD Million) by Country (2018-2022)
8.2.2 North America Biomass Revenue (USD Million) by Type (2018-2022)
8.2.3 North America Biomass Revenue (USD Million) by Applications (2018-2022)
8.3 Europe Biomass Revenue (USD Million), by Type, and Applications (USD Million) (2018-2022)
8.3.1 Europe Biomass Revenue (USD Million), by Country (2018-2022)
8.3.2 Europe Biomass Revenue (USD Million) by Type (2018-2022)
8.3.3 Europe Biomass Revenue (USD Million) by Applications (2018-2022)
8.4 Asia Pacific Biomass Revenue (USD Million), and Revenue (USD Million) by Type, and Applications (2018-2022)
8.4.1 Asia Pacific Biomass Revenue (USD Million) by Country (2018-2022)
8.4.2 Asia Pacific Biomass Revenue (USD Million) by Type (2018-2022)
8.4.3 Asia Pacific Biomass Revenue (USD Million) by Applications (2018-2022)
8.5 South America Biomass Revenue (USD Million), by Type, and Applications (2018-2022)
8.5.1 South America Biomass Revenue (USD Million), by Country (2018-2022)
8.5.2 South America Biomass Revenue (USD Million) by Type (2018-2022)
8.5.3 South America Biomass Revenue (USD Million) by Applications (2018-2022)
8.6 Middle East and Africa Biomass Revenue (USD Million), by Type, Technology, Application, Thickness (2018-2022)
8.6.1 Middle East and Africa Biomass Revenue (USD Million) by Country (2018-2022)
8.6.2 Middle East and Africa Biomass Revenue (USD Million) by Type (2018-2022)
8.6.3 Middle East and Africa Biomass Revenue (USD Million) by Applications (2018-2022)
9 Company Profiles
10 Global Biomass Market Revenue (USD Million), by Type, and Applications (2023-2030)
10.1 Global Biomass Revenue (USD Million) and Market Share (%) by Type (2023-2030)
10.1.1 Global Biomass Revenue (USD Million), and Market Share (%) by Type (2023-2030)
10.2 Global Biomass Revenue (USD Million) and Market Share (%) by Applications (2023-2030)
10.2.1 Global Biomass Revenue (USD Million), and Market Share (%) by Applications (2023-2030)
11 Global Biomass Development Regional Status and Outlook Forecast
11.1 Global Biomass Revenue (USD Million) By Regions (2023-2030)
11.2 North America Biomass Revenue (USD Million) by Type, and Applications (2023-2030)
11.2.1 North America Biomass Revenue (USD) Million by Country (2023-2030)
11.2.2 North America Biomass Revenue (USD Million), by Type (2023-2030)
11.2.3 North America Biomass Revenue (USD Million), Market Share (%) by Applications (2023-2030)
11.3 Europe Biomass Revenue (USD Million), by Type, and Applications (2023-2030)
11.3.1 Europe Biomass Revenue (USD Million), by Country (2023-2030)
11.3.2 Europe Biomass Revenue (USD Million), by Type (2023-2030)
11.3.3 Europe Biomass Revenue (USD Million), by Applications (2023-2030)
11.4 Asia Pacific Biomass Revenue (USD Million) by Type, and Applications (2023-2030)
11.4.1 Asia Pacific Biomass Revenue (USD Million), by Country (2023-2030)
11.4.2 Asia Pacific Biomass Revenue (USD Million), by Type (2023-2030)
11.4.3 Asia Pacific Biomass Revenue (USD Million), by Applications (2023-2030)
11.5 South America Biomass Revenue (USD Million), by Type, and Applications (2023-2030)
11.5.1 South America Biomass Revenue (USD Million), by Country (2023-2030)
11.5.2 South America Biomass Revenue (USD Million), by Type (2023-2030)
11.5.3 South America Biomass Revenue (USD Million), by Applications (2023-2030)
11.6 Middle East and Africa Biomass Revenue (USD Million), by Type, and Applications (2023-2030)
11.6.1 Middle East and Africa Biomass Revenue (USD Million), by Region (2023-2030)
11.6.2 Middle East and Africa Biomass Revenue (USD Million), by Type (2023-2030)
11.6.3 Middle East and Africa Biomass Revenue (USD Million), by Applications (2023-2030)
12 Methodology and Data Sources
12.1 Methodology/Research Approach
12.1.1 Research Programs/Design
12.1.2 Market Size Estimation
12.1.3 Market Breakdown and Data Triangulation
12.2 Data Sources
12.2.1 Secondary Sources
12.2.2 Primary Sources
12.3 Disclaimer
List of Tables
Table 1 Market Segmentation Analysis
Table 2 Global Biomass Market Companies with Areas Served
Table 3 Products Offerings Global Biomass Market
Table 4 Low Growth Scenario Forecasts
Table 5 Reference Case Growth Scenario
Table 6 High Growth Case Scenario
Table 7 Global Biomass Revenue (USD Million) And CAGR (%) By Type (2018-2030)
Table 8 Global Biomass Revenue (USD Million) And CAGR (%) By Applications (2018-2030)
Table 9 Global Biomass Revenue (USD Million) And CAGR (%) By Regions (2018-2030)
Table 10 Global Biomass Revenue (USD Million) By Type (2018-2022)
Table 11 Global Biomass Revenue Market Share (%) By Type (2018-2022)
Table 12 Global Biomass Revenue (USD Million) By Applications (2018-2022)
Table 13 Global Biomass Revenue Market Share (%) By Applications (2018-2022)
Table 14 Global Biomass Market Revenue (USD Million) By Regions (2018-2022)
Table 15 Global Biomass Market Share (%) By Regions (2018-2022)
Table 16 North America Biomass Revenue (USD Million) By Country (2018-2022)
Table 17 North America Biomass Revenue (USD Million) By Type (2018-2022)
Table 18 North America Biomass Revenue (USD Million) By Applications (2018-2022)
Table 19 Europe Biomass Revenue (USD Million) By Country (2018-2022)
Table 20 Europe Biomass Revenue (USD Million) By Type (2018-2022)
Table 21 Europe Biomass Revenue (USD Million) By Applications (2018-2022)
Table 22 Asia Pacific Biomass Revenue (USD Million) By Country (2018-2022)
Table 23 Asia Pacific Biomass Revenue (USD Million) By Type (2018-2022)
Table 24 Asia Pacific Biomass Revenue (USD Million) By Applications (2018-2022)
Table 25 South America Biomass Revenue (USD Million) By Country (2018-2022)
Table 26 South America Biomass Revenue (USD Million) By Type (2018-2022)
Table 27 South America Biomass Revenue (USD Million) By Applications (2018-2022)
Table 28 Middle East and Africa Biomass Revenue (USD Million) By Region (2018-2022)
Table 29 Middle East and Africa Biomass Revenue (USD Million) By Type (2018-2022)
Table 30 Middle East and Africa Biomass Revenue (USD Million) By Applications (2018-2022)
Table 31 Financial Analysis
Table 32 Global Biomass Revenue (USD Million) By Type (2023-2030)
Table 33 Global Biomass Revenue Market Share (%) By Type (2023-2030)
Table 34 Global Biomass Revenue (USD Million) By Applications (2023-2030)
Table 35 Global Biomass Revenue Market Share (%) By Applications (2023-2030)
Table 36 Global Biomass Market Revenue (USD Million), And Revenue (USD Million) By Regions (2023-2030)
Table 37 North America Biomass Revenue (USD)By Country (2023-2030)
Table 38 North America Biomass Revenue (USD Million) By Type (2023-2030)
Table 39 North America Biomass Revenue (USD Million) By Applications (2023-2030)
Table 40 Europe Biomass Revenue (USD Million) By Country (2023-2030)
Table 41 Europe Biomass Revenue (USD Million) By Type (2023-2030)
Table 42 Europe Biomass Revenue (USD Million) By Applications (2023-2030)
Table 43 Asia Pacific Biomass Revenue (USD Million) By Country (2023-2030)
Table 44 Asia Pacific Biomass Revenue (USD Million) By Type (2023-2030)
Table 45 Asia Pacific Biomass Revenue (USD Million) By Applications (2023-2030)
Table 46 South America Biomass Revenue (USD Million) By Country (2023-2030)
Table 47 South America Biomass Revenue (USD Million) By Type (2023-2030)
Table 48 South America Biomass Revenue (USD Million) By Applications (2023-2030)
Table 49 Middle East and Africa Biomass Revenue (USD Million) By Region (2023-2030)
Table 50 Middle East and Africa Biomass Revenue (USD Million) By Region (2023-2030)
Table 51 Middle East and Africa Biomass Revenue (USD Million) By Type (2023-2030)
Table 52 Middle East and Africa Biomass Revenue (USD Million) By Applications (2023-2030)
Table 53 Research Programs/Design for This Report
Table 54 Key Data Information from Secondary Sources
Table 55 Key Data Information from Primary Sources
List of Figures
Figure 1 Market Scope
Figure 2 Porter’s Five Forces
Figure 3 Global Biomass Revenue (USD Million) By Type (2018-2022)
Figure 4 Global Biomass Revenue Market Share (%) By Type (2022)
Figure 5 Global Biomass Revenue (USD Million) By Applications (2018-2022)
Figure 6 Global Biomass Revenue Market Share (%) By Applications (2022)
Figure 7 Global Biomass Market Revenue (USD Million) By Regions (2018-2022)
Figure 8 Global Biomass Market Share (%) By Regions (2022)
Figure 9 North America Biomass Revenue (USD Million) By Country (2018-2022)
Figure 10 North America Biomass Revenue (USD Million) By Type (2018-2022)
Figure 11 North America Biomass Revenue (USD Million) By Applications (2018-2022)
Figure 12 Europe Biomass Revenue (USD Million) By Country (2018-2022)
Figure 13 Europe Biomass Revenue (USD Million) By Type (2018-2022)
Figure 14 Europe Biomass Revenue (USD Million) By Applications (2018-2022)
Figure 15 Asia Pacific Biomass Revenue (USD Million) By Country (2018-2022)
Figure 16 Asia Pacific Biomass Revenue (USD Million) By Type (2018-2022)
Figure 17 Asia Pacific Biomass Revenue (USD Million) By Applications (2018-2022)
Figure 18 South America Biomass Revenue (USD Million) By Country (2018-2022)
Figure 19 South America Biomass Revenue (USD Million) By Type (2018-2022)
Figure 20 South America Biomass Revenue (USD Million) By Applications (2018-2022)
Figure 21 Middle East and Africa Biomass Revenue (USD Million) By Region (2018-2022)
Figure 22 Middle East and Africa Biomass Revenue (USD Million) By Type (2018-2022)
Figure 23 Middle East and Africa Biomass Revenue (USD Million) By Applications (2018-2022)
Figure 24 Global Biomass Revenue (USD Million) By Type (2023-2030)
Figure 25 Global Biomass Revenue Market Share (%) By Type (2030)
Figure 26 Global Biomass Revenue (USD Million) By Applications (2023-2030)
Figure 27 Global Biomass Revenue Market Share (%) By Applications (2030)
Figure 28 Global Biomass Market Revenue (USD Million) By Regions (2023-2030)
Figure 29 North America Biomass Revenue (USD Million) By Country (2023-2030)
Figure 30 North America Biomass Revenue (USD Million) By Type (2023-2030)
Figure 31 North America Biomass Revenue (USD Million) By Applications (2023-2030)
Figure 32 Europe Biomass Revenue (USD Million) By Country (2023-2030)
Figure 33 Europe Biomass Revenue (USD Million) By Type (2023-2030)
Figure 34 Europe Biomass Revenue (USD Million) By Applications (2023-2030)
Figure 35 Asia Pacific Biomass Revenue (USD Million) By Country (2023-2030)
Figure 36 Asia Pacific Biomass Revenue (USD Million) By Type (2023-2030)
Figure 37 Asia Pacific Biomass Revenue (USD Million) By Applications (2023-2030)
Figure 38 South America Biomass Revenue (USD Million) By Country (2023-2030)
Figure 39 South America Biomass Revenue (USD Million) By Type (2023-2030)
Figure 40 South America Biomass Revenue (USD Million) By Applications (2023-2030)
Figure 41 Middle East and Africa Biomass Revenue (USD Million) By Region (2023-2030)
Figure 42 Middle East and Africa Biomass Revenue (USD Million) By Region (2023-2030)
Figure 43 Middle East and Africa Biomass Revenue (USD Million) By Type (2023-2030)
Figure 44 Middle East and Africa Biomass Revenue (USD Million) By Applications (2023-2030)
Figure 45 Bottom-Up and Top-Down Approaches For This Report
Figure 46 Data Triangulation
