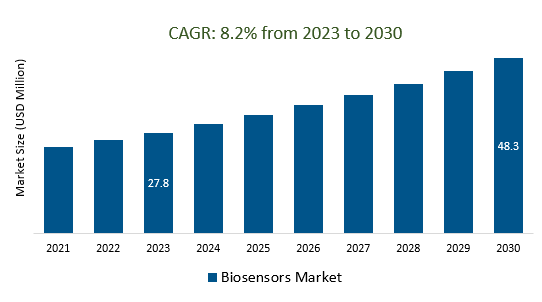
The Global Biosensors Market Size is estimated to be US 27.8 Billion in 2023 and is poised to register 8.2% growth over the forecast period from 2023 to 2030 to reach US $ 48.3 billion in 2030.
The Biosensors Market is experiencing significant growth due to various drivers and trends in healthcare, biotechnology, and related industries. Key drivers include increasing demand for point-of-care testing, rising healthcare expenditure, and the growing prevalence of chronic diseases. Advancements in nanotechnology and materials science are improving the performance and reliability of biosensor devices. Miniaturization and wearable biosensors are enabling continuous health monitoring and real-time data. Biosensors are increasingly used for environmental monitoring, food safety, and quality control. Trends include multiplexed biosensors, integration with AI, 3D printing, flexible electronics, personalized medicine, blockchain, sustainability, and eco-friendly biosensors. The market is expanding globally, with a focus on emerging economies with growing healthcare infrastructure and increasing demand for affordable diagnostics. These trends are driving the market's evolution and growth.
Rising Demand for Point-of-Care Testing (POCT) Fuelled by Biosensors is boosting the market.
The Biosensors market is experiencing a significant surge in demand due to the growing popularity of Point-of-Care Testing (POCT). This upward trend can be attributed to the pivotal role that biosensors play in revolutionizing healthcare by providing quick and accurate diagnostic information at the patient's bedside or in remote settings. Biosensors, with their ability to detect specific biological markers and analyse various health parameters, are becoming indispensable tools for rapid disease diagnosis and monitoring. The convenience, portability, and real-time results offered by biosensors have garnered attention not only from healthcare professionals but also from consumers looking for self-monitoring options. As technology continues to advance, the biosensors market is poised for further expansion, driving innovation in medical diagnostics and personalized healthcare.
The Vital Role of Biosensors in Continuous Monitoring and Early Detection of Chronic Diseases is creating a demand in the market.
Biosensors play an indispensable role in the contemporary healthcare landscape, particularly in the continuous monitoring and early detection of chronic diseases. These miniature devices have revolutionized healthcare by providing real-time data on various physiological parameters. They enable patients and healthcare professionals to monitor vital indicators like glucose levels, heart rate, and even specific biomarkers associated with chronic conditions such as diabetes, cardiovascular diseases, and cancer. The Biosensors Market is experiencing significant growth owing to the increasing prevalence of chronic diseases globally and the rising awareness about proactive healthcare management. Biosensors not only empower individuals to take charge of their health but also offer clinicians valuable insights for timely intervention and personalized treatment plans. With advancements in sensor technology and data analytics, biosensors are set to continue their pivotal role in shaping the future of healthcare, ultimately leading to improved patient outcomes and reduced healthcare costs.
Revolutionizing Clinical Diagnostics and Research with Multiplexed Biosensors is attracting a wide range of customers.
The revolution in clinical diagnostics and research through the implementation of multiplexed biosensors is creating a significant stir in the biosensors market. These advanced biosensors have the capacity to simultaneously detect multiple biomolecules, making them incredibly valuable in fields like healthcare and life sciences. Researchers, clinicians, and pharmaceutical companies are increasingly drawn to these innovative technologies due to their potential to streamline diagnostic processes, reduce costs, and enhance the accuracy of results. With the ability to provide real-time, comprehensive data on various biomarkers, multiplexed biosensors are poised to reshape the landscape of clinical diagnostics and research, leading to improved patient care and groundbreaking scientific discoveries. This trend is expected to continue driving the growth of the biosensors market in the coming years.
Market Share Analysis:
Non-wearable biosensors currently dominate the biosensor market due to several driving factors.
The driving factors include the rising incidence of chronic diseases, such as diabetes and cardiovascular issues, the growing need for point-of-care testing, and the expanding application of biosensors in food safety and environmental monitoring. Common examples of non-wearable biosensors encompass blood glucose meters, cholesterol meters, pregnancy tests, infectious disease diagnostics, as well as food safety and environmental monitoring devices. In contrast, wearable biosensors, while gaining popularity, hold a relatively modest share of the market due to factors like higher costs, limited battery life, and regulatory approval challenges. Nevertheless, the wearable biosensors market is poised for substantial growth as the demand for health and fitness monitoring through wearable devices continues to rise.
Electrochemical biosensors are the most dominant technology in the biosensors market.
Electrochemical biosensors dominate the biosensors market due to their ability to detect various target analytes through electrochemical reactions with high sensitivity and selectivity. These biosensors find extensive applications, including point-of-care testing, environmental monitoring, and food safety assessments, owing to their affordability and ease of manufacturing. Their advantages include portability, ease of use, and a wide range of applications. Key types of electrochemical biosensors include amperometry, which measure current from electrochemical reactions; potentiometric, measuring electrical potential at electrode interfaces; and conductometric, assessing changes in solution conductivity due to analyte presence.
The bioreceptor module stands as the central element within the biosensors market, responsible for identifying and binding to the target analyte.
Comprised of biological materials like enzymes, antibodies, or nucleic acid sequences, these modules are vital for ensuring the precision and sensitivity of biosensors. They must exhibit specificity in binding to the target analyte while enduring the demanding conditions typical in biosensor applications. A diverse array of bioreceptor modules is available, each with its unique strengths and weaknesses. Enzymes catalyze chemical reactions, making them suitable for biosensors detecting various analytes like glucose, cholesterol, and drugs. Antibodies, on the other hand, bind to specific antigens, enabling biosensors to detect bacteria, viruses, and proteins. Nucleic acid sequences, including DNA and RNA, are employed to create biosensors for diagnosing diseases and identifying genetic abnormalities.
The most dominant industry in the biosensors market is POC (point-of-care) diagnostics.
The biosensors market is currently led by the point-of-care (POC) diagnostics industry, which plays a pivotal role in testing and monitoring various medical conditions, encompassing diabetes, heart ailments, infectious diseases, and cancer. POC diagnostics stand out for their ability to provide rapid and convenient tests, frequently conducted outside the traditional clinical settings, such as doctor's offices, hospitals, and labs. This trend is fueled by the increasing demand for swift and accessible diagnostic solutions, coupled with the rising incidence of chronic diseases. Common POC biosensors encompass glucometers for measuring blood glucose levels, pregnancy tests for detecting pregnancy, cholesterol tests for assessing cholesterol levels in the blood, infectious disease tests for identifying conditions like HIV, hepatitis, and influenza, and cardiac marker tests for diagnosing and tracking heart-related conditions such as heart attacks and heart failure.
Biosensors Marke Segmentation
Type
Technology Component
Electrochemical
- Amperometric
- Potentiometric
- Conductometric
- Piezoelectric
- Acoustic
- Microcantilever
Optical
- SPR
- Colorimetric
- Fluoroscence
Nanomechanical Component
- Bioreceptor Modules
- Biological Element
- Transducer
Industry
- POC Diagnostics
- Cardiac Marker
- Infectious Disease Detection
- Coagulation monitoring
- Pregnancy Testing
- Blood Gas and Electrolyte Detection
- Tumor Detection
- Urinalysis
- Cholesterol Testing
- Others
Home Diagnostics
- Glucose Monitoring
- Pregnancy Testing
- Cholesterol Testing
Research Labs
- Environmental Monitoring
- Food and Beverages
- Security & Bio-Defense
By Region
- North America (United States, Canada, Mexico)
- Europe (Germany, France, United Kingdom, Spain, Italy, Others)
- Asia Pacific (China, India, Japan, South Korea, Australia, Others)
- Latin America (Brazil, Argentina, Others)
- Middle East and Africa (Saudi Arabia, UAE, Kuwait, Other Middle East, South Africa, Nigeria, Other Africa)
Companies Profiled in the Report
- Abbott Laboratories
- Roche Diagnostics
- Medtronic plc
- Bio-Rad Laboratories, Inc.
- DuPont de Nemours, Inc.
- Biosensors International, Ltd.
- Cytia Therapeutics, Inc.
- Dexcom, Inc.
- LifeScan, Inc.
- Masimo Corporation
- Nova Biomedical, Inc.
- Universal Biosensors, Inc.
- Acon Laboratories, Inc.
- Cardea Bio, Inc.
- Conductive Technologies, Inc.
- EarlySense, Inc.
- Eastprint Inc.
- IST AG
- Lifesignals, Inc.
- NeuroSky, Inc.
- Pinnacle Technology, Inc.
- SD Biosensor, Inc.
- VitalConnect, Inc.
- Xsensio, Inc.
- Zimmer Biomet Holdings, Inc.
*List not exhaustive
Biosensors Market Outlook 2023
1 Market Overview
1.1 Introduction to the Biosensors Market
1.2 Scope of the Study
1.3 Research Objective
1.3.1 Key Market Scope and Segments
1.3.2 Players Covered
1.3.3 Years Considered
2 Executive Summary
2.1 2023 Biosensors Industry- Market Statistics
3 Market Dynamics
3.1 Market Drivers
3.2 Market Challenges
3.3 Market Opportunities
3.4 Market Trends
4 Market Factor Analysis
4.1 Porter’s Five Forces
4.2 Market Entropy
4.2.1 Global Biosensors Market Companies with Area Served
4.2.2 Products Offerings Global Biosensors Market
5 COVID-19 Impact Analysis and Outlook Scenarios
5.1.1 Covid-19 Impact Analysis
5.1.2 Post-COVID-19 Scenario- Low Growth Case
5.1.3 Post-COVID-19 Scenario- Reference Growth Case
5.1.4 Post-COVID-19 Scenario- Low Growth Case
6 Global Biosensors Market Trends
6.1 Global Biosensors Revenue (USD Million) and CAGR (%) by Type (2018-2030)
6.2 Global Biosensors Revenue (USD Million) and CAGR (%) by Applications (2018-2030)
6.3 Global Biosensors Revenue (USD Million) and CAGR (%) by Regions (2018-2030)
7 Global Biosensors Market Revenue (USD Million) by Type, and Applications (2018-2022)
7.1 Global Biosensors Revenue (USD Million) by Type (2018-2022)
7.1.1 Global Biosensors Revenue (USD Million), Market Share (%) by Type (2018-2022)
7.2 Global Biosensors Revenue (USD Million) by Applications (2018-2022)
7.2.1 Global Biosensors Revenue (USD Million), Market Share (%) by Applications (2018-2022)
8 Global Biosensors Development Regional Status and Outlook
8.1 Global Biosensors Revenue (USD Million) By Regions (2018-2022)
8.2 North America Biosensors Revenue (USD Million) by Type, and Application (2018-2022)
8.2.1 North America Biosensors Revenue (USD Million) by Country (2018-2022)
8.2.2 North America Biosensors Revenue (USD Million) by Type (2018-2022)
8.2.3 North America Biosensors Revenue (USD Million) by Applications (2018-2022)
8.3 Europe Biosensors Revenue (USD Million), by Type, and Applications (USD Million) (2018-2022)
8.3.1 Europe Biosensors Revenue (USD Million), by Country (2018-2022)
8.3.2 Europe Biosensors Revenue (USD Million) by Type (2018-2022)
8.3.3 Europe Biosensors Revenue (USD Million) by Applications (2018-2022)
8.4 Asia Pacific Biosensors Revenue (USD Million), and Revenue (USD Million) by Type, and Applications (2018-2022)
8.4.1 Asia Pacific Biosensors Revenue (USD Million) by Country (2018-2022)
8.4.2 Asia Pacific Biosensors Revenue (USD Million) by Type (2018-2022)
8.4.3 Asia Pacific Biosensors Revenue (USD Million) by Applications (2018-2022)
8.5 South America Biosensors Revenue (USD Million), by Type, and Applications (2018-2022)
8.5.1 South America Biosensors Revenue (USD Million), by Country (2018-2022)
8.5.2 South America Biosensors Revenue (USD Million) by Type (2018-2022)
8.5.3 South America Biosensors Revenue (USD Million) by Applications (2018-2022)
8.6 Middle East and Africa Biosensors Revenue (USD Million), by Type, Technology, Application, Thickness (2018-2022)
8.6.1 Middle East and Africa Biosensors Revenue (USD Million) by Country (2018-2022)
8.6.2 Middle East and Africa Biosensors Revenue (USD Million) by Type (2018-2022)
8.6.3 Middle East and Africa Biosensors Revenue (USD Million) by Applications (2018-2022)
9 Company Profiles
10 Global Biosensors Market Revenue (USD Million), by Type, and Applications (2023-2030)
10.1 Global Biosensors Revenue (USD Million) and Market Share (%) by Type (2023-2030)
10.1.1 Global Biosensors Revenue (USD Million), and Market Share (%) by Type (2023-2030)
10.2 Global Biosensors Revenue (USD Million) and Market Share (%) by Applications (2023-2030)
10.2.1 Global Biosensors Revenue (USD Million), and Market Share (%) by Applications (2023-2030)
11 Global Biosensors Development Regional Status and Outlook Forecast
11.1 Global Biosensors Revenue (USD Million) By Regions (2023-2030)
11.2 North America Biosensors Revenue (USD Million) by Type, and Applications (2023-2030)
11.2.1 North America Biosensors Revenue (USD) Million by Country (2023-2030)
11.2.2 North America Biosensors Revenue (USD Million), by Type (2023-2030)
11.2.3 North America Biosensors Revenue (USD Million), Market Share (%) by Applications (2023-2030)
11.3 Europe Biosensors Revenue (USD Million), by Type, and Applications (2023-2030)
11.3.1 Europe Biosensors Revenue (USD Million), by Country (2023-2030)
11.3.2 Europe Biosensors Revenue (USD Million), by Type (2023-2030)
11.3.3 Europe Biosensors Revenue (USD Million), by Applications (2023-2030)
11.4 Asia Pacific Biosensors Revenue (USD Million) by Type, and Applications (2023-2030)
11.4.1 Asia Pacific Biosensors Revenue (USD Million), by Country (2023-2030)
11.4.2 Asia Pacific Biosensors Revenue (USD Million), by Type (2023-2030)
11.4.3 Asia Pacific Biosensors Revenue (USD Million), by Applications (2023-2030)
11.5 South America Biosensors Revenue (USD Million), by Type, and Applications (2023-2030)
11.5.1 South America Biosensors Revenue (USD Million), by Country (2023-2030)
11.5.2 South America Biosensors Revenue (USD Million), by Type (2023-2030)
11.5.3 South America Biosensors Revenue (USD Million), by Applications (2023-2030)
11.6 Middle East and Africa Biosensors Revenue (USD Million), by Type, and Applications (2023-2030)
11.6.1 Middle East and Africa Biosensors Revenue (USD Million), by Region (2023-2030)
11.6.2 Middle East and Africa Biosensors Revenue (USD Million), by Type (2023-2030)
11.6.3 Middle East and Africa Biosensors Revenue (USD Million), by Applications (2023-2030)
12 Methodology and Data Sources
12.1 Methodology/Research Approach
12.1.1 Research Programs/Design
12.1.2 Market Size Estimation
12.1.3 Market Breakdown and Data Triangulation
12.2 Data Sources
12.2.1 Secondary Sources
12.2.2 Primary Sources
12.3 Disclaimer
List of Tables
Table 1 Market Segmentation Analysis
Table 2 Global Biosensors Market Companies with Areas Served
Table 3 Products Offerings Global Biosensors Market
Table 4 Low Growth Scenario Forecasts
Table 5 Reference Case Growth Scenario
Table 6 High Growth Case Scenario
Table 7 Global Biosensors Revenue (USD Million) And CAGR (%) By Type (2018-2030)
Table 8 Global Biosensors Revenue (USD Million) And CAGR (%) By Applications (2018-2030)
Table 9 Global Biosensors Revenue (USD Million) And CAGR (%) By Regions (2018-2030)
Table 10 Global Biosensors Revenue (USD Million) By Type (2018-2022)
Table 11 Global Biosensors Revenue Market Share (%) By Type (2018-2022)
Table 12 Global Biosensors Revenue (USD Million) By Applications (2018-2022)
Table 13 Global Biosensors Revenue Market Share (%) By Applications (2018-2022)
Table 14 Global Biosensors Market Revenue (USD Million) By Regions (2018-2022)
Table 15 Global Biosensors Market Share (%) By Regions (2018-2022)
Table 16 North America Biosensors Revenue (USD Million) By Country (2018-2022)
Table 17 North America Biosensors Revenue (USD Million) By Type (2018-2022)
Table 18 North America Biosensors Revenue (USD Million) By Applications (2018-2022)
Table 19 Europe Biosensors Revenue (USD Million) By Country (2018-2022)
Table 20 Europe Biosensors Revenue (USD Million) By Type (2018-2022)
Table 21 Europe Biosensors Revenue (USD Million) By Applications (2018-2022)
Table 22 Asia Pacific Biosensors Revenue (USD Million) By Country (2018-2022)
Table 23 Asia Pacific Biosensors Revenue (USD Million) By Type (2018-2022)
Table 24 Asia Pacific Biosensors Revenue (USD Million) By Applications (2018-2022)
Table 25 South America Biosensors Revenue (USD Million) By Country (2018-2022)
Table 26 South America Biosensors Revenue (USD Million) By Type (2018-2022)
Table 27 South America Biosensors Revenue (USD Million) By Applications (2018-2022)
Table 28 Middle East and Africa Biosensors Revenue (USD Million) By Region (2018-2022)
Table 29 Middle East and Africa Biosensors Revenue (USD Million) By Type (2018-2022)
Table 30 Middle East and Africa Biosensors Revenue (USD Million) By Applications (2018-2022)
Table 31 Financial Analysis
Table 32 Global Biosensors Revenue (USD Million) By Type (2023-2030)
Table 33 Global Biosensors Revenue Market Share (%) By Type (2023-2030)
Table 34 Global Biosensors Revenue (USD Million) By Applications (2023-2030)
Table 35 Global Biosensors Revenue Market Share (%) By Applications (2023-2030)
Table 36 Global Biosensors Market Revenue (USD Million), And Revenue (USD Million) By Regions (2023-2030)
Table 37 North America Biosensors Revenue (USD)By Country (2023-2030)
Table 38 North America Biosensors Revenue (USD Million) By Type (2023-2030)
Table 39 North America Biosensors Revenue (USD Million) By Applications (2023-2030)
Table 40 Europe Biosensors Revenue (USD Million) By Country (2023-2030)
Table 41 Europe Biosensors Revenue (USD Million) By Type (2023-2030)
Table 42 Europe Biosensors Revenue (USD Million) By Applications (2023-2030)
Table 43 Asia Pacific Biosensors Revenue (USD Million) By Country (2023-2030)
Table 44 Asia Pacific Biosensors Revenue (USD Million) By Type (2023-2030)
Table 45 Asia Pacific Biosensors Revenue (USD Million) By Applications (2023-2030)
Table 46 South America Biosensors Revenue (USD Million) By Country (2023-2030)
Table 47 South America Biosensors Revenue (USD Million) By Type (2023-2030)
Table 48 South America Biosensors Revenue (USD Million) By Applications (2023-2030)
Table 49 Middle East and Africa Biosensors Revenue (USD Million) By Region (2023-2030)
Table 50 Middle East and Africa Biosensors Revenue (USD Million) By Region (2023-2030)
Table 51 Middle East and Africa Biosensors Revenue (USD Million) By Type (2023-2030)
Table 52 Middle East and Africa Biosensors Revenue (USD Million) By Applications (2023-2030)
Table 53 Research Programs/Design for This Report
Table 54 Key Data Information from Secondary Sources
Table 55 Key Data Information from Primary Sources
List of Figures
Figure 1 Market Scope
Figure 2 Porter’s Five Forces
Figure 3 Global Biosensors Revenue (USD Million) By Type (2018-2022)
Figure 4 Global Biosensors Revenue Market Share (%) By Type (2022)
Figure 5 Global Biosensors Revenue (USD Million) By Applications (2018-2022)
Figure 6 Global Biosensors Revenue Market Share (%) By Applications (2022)
Figure 7 Global Biosensors Market Revenue (USD Million) By Regions (2018-2022)
Figure 8 Global Biosensors Market Share (%) By Regions (2022)
Figure 9 North America Biosensors Revenue (USD Million) By Country (2018-2022)
Figure 10 North America Biosensors Revenue (USD Million) By Type (2018-2022)
Figure 11 North America Biosensors Revenue (USD Million) By Applications (2018-2022)
Figure 12 Europe Biosensors Revenue (USD Million) By Country (2018-2022)
Figure 13 Europe Biosensors Revenue (USD Million) By Type (2018-2022)
Figure 14 Europe Biosensors Revenue (USD Million) By Applications (2018-2022)
Figure 15 Asia Pacific Biosensors Revenue (USD Million) By Country (2018-2022)
Figure 16 Asia Pacific Biosensors Revenue (USD Million) By Type (2018-2022)
Figure 17 Asia Pacific Biosensors Revenue (USD Million) By Applications (2018-2022)
Figure 18 South America Biosensors Revenue (USD Million) By Country (2018-2022)
Figure 19 South America Biosensors Revenue (USD Million) By Type (2018-2022)
Figure 20 South America Biosensors Revenue (USD Million) By Applications (2018-2022)
Figure 21 Middle East and Africa Biosensors Revenue (USD Million) By Region (2018-2022)
Figure 22 Middle East and Africa Biosensors Revenue (USD Million) By Type (2018-2022)
Figure 23 Middle East and Africa Biosensors Revenue (USD Million) By Applications (2018-2022)
Figure 24 Global Biosensors Revenue (USD Million) By Type (2023-2030)
Figure 25 Global Biosensors Revenue Market Share (%) By Type (2030)
Figure 26 Global Biosensors Revenue (USD Million) By Applications (2023-2030)
Figure 27 Global Biosensors Revenue Market Share (%) By Applications (2030)
Figure 28 Global Biosensors Market Revenue (USD Million) By Regions (2023-2030)
Figure 29 North America Biosensors Revenue (USD Million) By Country (2023-2030)
Figure 30 North America Biosensors Revenue (USD Million) By Type (2023-2030)
Figure 31 North America Biosensors Revenue (USD Million) By Applications (2023-2030)
Figure 32 Europe Biosensors Revenue (USD Million) By Country (2023-2030)
Figure 33 Europe Biosensors Revenue (USD Million) By Type (2023-2030)
Figure 34 Europe Biosensors Revenue (USD Million) By Applications (2023-2030)
Figure 35 Asia Pacific Biosensors Revenue (USD Million) By Country (2023-2030)
Figure 36 Asia Pacific Biosensors Revenue (USD Million) By Type (2023-2030)
Figure 37 Asia Pacific Biosensors Revenue (USD Million) By Applications (2023-2030)
Figure 38 South America Biosensors Revenue (USD Million) By Country (2023-2030)
Figure 39 South America Biosensors Revenue (USD Million) By Type (2023-2030)
Figure 40 South America Biosensors Revenue (USD Million) By Applications (2023-2030)
Figure 41 Middle East and Africa Biosensors Revenue (USD Million) By Region (2023-2030)
Figure 42 Middle East and Africa Biosensors Revenue (USD Million) By Region (2023-2030)
Figure 43 Middle East and Africa Biosensors Revenue (USD Million) By Type (2023-2030)
Figure 44 Middle East and Africa Biosensors Revenue (USD Million) By Applications (2023-2030)
Figure 45 Bottom-Up and Top-Down Approaches For This Report
Figure 46 Data Triangulation
