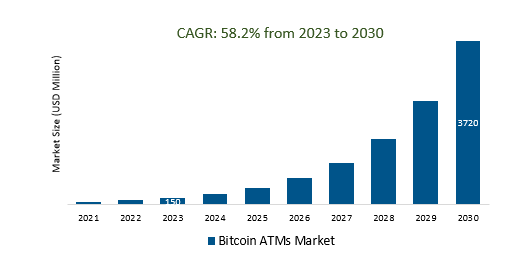
The Global Bitcoin ATMs Market Size is estimated to be US 150 million in 2023 and is poised to register 58.2% growth over the forecast period from 2023 to 2030 to reach US $ 3720 million in 2030.
The market growth is driven by the increasing acceptance and adoption of cryptocurrencies, particularly Bitcoin, by individuals and businesses, which has been a significant driver. As more people become interested in using cryptocurrencies, the demand for Bitcoin ATMs rises. Leading companies that are focused on Increased Adoption, Integration with Traditional Banking, Wider Range of Supported Cryptocurrencies, Cross-Border Transactions, Partnerships and Alliances, and others to boost market shares in the industry.
Market Overview
The Bitcoin ATM market comprises physical machines allowing users to buy or sell cryptocurrencies, primarily Bitcoin, often found in urban areas globally. It offers convenient access to digital assets, varying between two-way and one-way machines, with fees higher than online exchanges. Operators navigate diverse regulatory environments, promoting user verification and emphasizing security measures. The market has grown steadily, featuring competition that drives innovation, integration with mobile apps, and potential trends, such as additional cryptocurrency support, DeFi services, and partnerships with traditional financial institutions, while environmental concerns prompt discussions of eco-friendly solutions.
Market Dynamics
Market Trends - Popular mobile apps that are integrated with Bitcoin ATMs
Popular mobile apps integrated with Bitcoin ATMs include CoinATMRadar for locating nearby machines and transactions, MyEtherWallet (MEW) for Ethereum users, Edge Wallet for multi-currency storage, BRD Wallet for Bitcoin purchases, privacy-focused Samourai Wallet, CoinFlip's app for its own ATM network, LibertyX for Bitcoin purchases at retail locations, and Bitstop's app for finding Bit stop ATMs. These integrations cater to the growing demand for cryptocurrency accessibility, allowing users to buy, sell, and manage digital assets conveniently through their mobile devices.
Market Driver- The demand for Bitcoin ATMs is increasing due to the integration of DeFi
The demand for Bitcoin ATMs is increasing due to the integration of DeFi (Decentralized Finance) services and the broader adoption of cryptocurrencies. As DeFi continues to gain popularity, more individuals seek convenient ways to access and use decentralized financial products and services. Bitcoin ATMs, which traditionally provided a means to buy and sell cryptocurrencies, are now expanding their capabilities. Some Bitcoin ATM operators are integrating DeFi functionalities, allowing users to not only purchase Bitcoin but also participate in various DeFi activities directly from the ATMs. This integration provides users with a seamless way to access DeFi services, potentially boosting the demand for Bitcoin ATMs as they become more versatile financial tools.
Market Opportunity-Introduction of Lower Transaction Fees
In the Bitcoin ATM market, there is a discernible trend towards lower transaction fees, driven by competition among operators. This reduction in fees aims to attract users and enhance the cost-effectiveness of using Bitcoin ATMs for buying and selling cryptocurrencies when compared to traditional exchanges. However, the exact fee structure may still vary between operators and locations, necessitating users to check the fees of specific Bitcoin ATMs for accurate information.
Market Share Analysis- Two-way Bitcoin ATMs Market will register the fastest growth
The Global Bitcoin ATM market is analyzed across Onaway, Two-way, and others. Two way is poised to register the fastest growth. Two-way Bitcoin ATMs, also known as bi-directional Bitcoin ATMs, are a significant segment of the market, enabling users to both buy and sell cryptocurrencies directly. Unlike one-way ATMs that offer only buying or selling options, two-way ATMs enhance user convenience by facilitating both transactions, allowing individuals to purchase Bitcoin with cash and sell their holdings for cash at the same machine.
Market Share Analysis- Commercial held a significant market share in 2023
The Global Bitcoin ATMs Market is analyzed across various applications including Commercial, Personal, and others. Of these, Commercial held a significant market share in 2023. Discover the convenience of Bitcoin ATMs for all your cryptocurrency needs! Our cutting-edge machines provide a hassle-free way to buy and sell Bitcoin and other cryptocurrencies with cash or cards. With our expanding network, including two-way ATMs, you can easily access and manage your digital assets
Bitcoin ATMs Market Segmentation
By Type
By Application
By Region
- North America (United States, Canada, Mexico)
- Europe (Germany, France, United Kingdom, Spain, Italy, Others)
- Asia Pacific (China, India, Japan, South Korea, Australia, Others)
- Latin America (Brazil, Argentina, Others)
- Middle East and Africa (Saudi Arabia, UAE, Kuwait, Other Middle East, South Africa, Nigeria, Other Africa)
Bitcoin ATMs Market Companies
- Lamassu (United Kingdom)
- Genesis Coin (United States)
- COVAULT (United States)
- GENERAL BYTES (Czech Republic)
- Bitaccess (Canada)
- Coinme (United States)
- Coinsource (United States)
- RUSbit (Russia)
- Bitxatm (German)
- Orderbob (Austria)
*List not exhaustive
Bitcoin ATMs Market Outlook 2023
1 Market Overview
1.1 Introduction to the Bitcoin ATMs Market
1.2 Scope of the Study
1.3 Research Objective
1.3.1 Key Market Scope and Segments
1.3.2 Players Covered
1.3.3 Years Considered
2 Executive Summary
2.1 2023 Bitcoin ATMs Industry- Market Statistics
3 Market Dynamics
3.1 Market Drivers
3.2 Market Challenges
3.3 Market Opportunities
3.4 Market Trends
4 Market Factor Analysis
4.1 Porter’s Five Forces
4.2 Market Entropy
4.2.1 Global Bitcoin ATMs Market Companies with Area Served
4.2.2 Products Offerings Global Bitcoin ATMs Market
5 COVID-19 Impact Analysis and Outlook Scenarios
5.1.1 Covid-19 Impact Analysis
5.1.2 Post-COVID-19 Scenario- Low Growth Case
5.1.3 Post-COVID-19 Scenario- Reference Growth Case
5.1.4 Post-COVID-19 Scenario- Low Growth Case
6 Global Bitcoin ATMs Market Trends
6.1 Global Bitcoin ATMs Revenue (USD Million) and CAGR (%) by Type (2018-2030)
6.2 Global Bitcoin ATMs Revenue (USD Million) and CAGR (%) by Applications (2018-2030)
6.3 Global Bitcoin ATMs Revenue (USD Million) and CAGR (%) by Regions (2018-2030)
7 Global Bitcoin ATMs Market Revenue (USD Million) by Type, and Applications (2018-2022)
7.1 Global Bitcoin ATMs Revenue (USD Million) by Type (2018-2022)
7.1.1 Global Bitcoin ATMs Revenue (USD Million), Market Share (%) by Type (2018-2022)
7.2 Global Bitcoin ATMs Revenue (USD Million) by Applications (2018-2022)
7.2.1 Global Bitcoin ATMs Revenue (USD Million), Market Share (%) by Applications (2018-2022)
8 Global Bitcoin ATMs Development Regional Status and Outlook
8.1 Global Bitcoin ATMs Revenue (USD Million) By Regions (2018-2022)
8.2 North America Bitcoin ATMs Revenue (USD Million) by Type, and Application (2018-2022)
8.2.1 North America Bitcoin ATMs Revenue (USD Million) by Country (2018-2022)
8.2.2 North America Bitcoin ATMs Revenue (USD Million) by Type (2018-2022)
8.2.3 North America Bitcoin ATMs Revenue (USD Million) by Applications (2018-2022)
8.3 Europe Bitcoin ATMs Revenue (USD Million), by Type, and Applications (USD Million) (2018-2022)
8.3.1 Europe Bitcoin ATMs Revenue (USD Million), by Country (2018-2022)
8.3.2 Europe Bitcoin ATMs Revenue (USD Million) by Type (2018-2022)
8.3.3 Europe Bitcoin ATMs Revenue (USD Million) by Applications (2018-2022)
8.4 Asia Pacific Bitcoin ATMs Revenue (USD Million), and Revenue (USD Million) by Type, and Applications (2018-2022)
8.4.1 Asia Pacific Bitcoin ATMs Revenue (USD Million) by Country (2018-2022)
8.4.2 Asia Pacific Bitcoin ATMs Revenue (USD Million) by Type (2018-2022)
8.4.3 Asia Pacific Bitcoin ATMs Revenue (USD Million) by Applications (2018-2022)
8.5 South America Bitcoin ATMs Revenue (USD Million), by Type, and Applications (2018-2022)
8.5.1 South America Bitcoin ATMs Revenue (USD Million), by Country (2018-2022)
8.5.2 South America Bitcoin ATMs Revenue (USD Million) by Type (2018-2022)
8.5.3 South America Bitcoin ATMs Revenue (USD Million) by Applications (2018-2022)
8.6 Middle East and Africa Bitcoin ATMs Revenue (USD Million), by Type, Technology, Application, Thickness (2018-2022)
8.6.1 Middle East and Africa Bitcoin ATMs Revenue (USD Million) by Country (2018-2022)
8.6.2 Middle East and Africa Bitcoin ATMs Revenue (USD Million) by Type (2018-2022)
8.6.3 Middle East and Africa Bitcoin ATMs Revenue (USD Million) by Applications (2018-2022)
9 Company Profiles
10 Global Bitcoin ATMs Market Revenue (USD Million), by Type, and Applications (2023-2030)
10.1 Global Bitcoin ATMs Revenue (USD Million) and Market Share (%) by Type (2023-2030)
10.1.1 Global Bitcoin ATMs Revenue (USD Million), and Market Share (%) by Type (2023-2030)
10.2 Global Bitcoin ATMs Revenue (USD Million) and Market Share (%) by Applications (2023-2030)
10.2.1 Global Bitcoin ATMs Revenue (USD Million), and Market Share (%) by Applications (2023-2030)
11 Global Bitcoin ATMs Development Regional Status and Outlook Forecast
11.1 Global Bitcoin ATMs Revenue (USD Million) By Regions (2023-2030)
11.2 North America Bitcoin ATMs Revenue (USD Million) by Type, and Applications (2023-2030)
11.2.1 North America Bitcoin ATMs Revenue (USD) Million by Country (2023-2030)
11.2.2 North America Bitcoin ATMs Revenue (USD Million), by Type (2023-2030)
11.2.3 North America Bitcoin ATMs Revenue (USD Million), Market Share (%) by Applications (2023-2030)
11.3 Europe Bitcoin ATMs Revenue (USD Million), by Type, and Applications (2023-2030)
11.3.1 Europe Bitcoin ATMs Revenue (USD Million), by Country (2023-2030)
11.3.2 Europe Bitcoin ATMs Revenue (USD Million), by Type (2023-2030)
11.3.3 Europe Bitcoin ATMs Revenue (USD Million), by Applications (2023-2030)
11.4 Asia Pacific Bitcoin ATMs Revenue (USD Million) by Type, and Applications (2023-2030)
11.4.1 Asia Pacific Bitcoin ATMs Revenue (USD Million), by Country (2023-2030)
11.4.2 Asia Pacific Bitcoin ATMs Revenue (USD Million), by Type (2023-2030)
11.4.3 Asia Pacific Bitcoin ATMs Revenue (USD Million), by Applications (2023-2030)
11.5 South America Bitcoin ATMs Revenue (USD Million), by Type, and Applications (2023-2030)
11.5.1 South America Bitcoin ATMs Revenue (USD Million), by Country (2023-2030)
11.5.2 South America Bitcoin ATMs Revenue (USD Million), by Type (2023-2030)
11.5.3 South America Bitcoin ATMs Revenue (USD Million), by Applications (2023-2030)
11.6 Middle East and Africa Bitcoin ATMs Revenue (USD Million), by Type, and Applications (2023-2030)
11.6.1 Middle East and Africa Bitcoin ATMs Revenue (USD Million), by Region (2023-2030)
11.6.2 Middle East and Africa Bitcoin ATMs Revenue (USD Million), by Type (2023-2030)
11.6.3 Middle East and Africa Bitcoin ATMs Revenue (USD Million), by Applications (2023-2030)
12 Methodology and Data Sources
12.1 Methodology/Research Approach
12.1.1 Research Programs/Design
12.1.2 Market Size Estimation
12.1.3 Market Breakdown and Data Triangulation
12.2 Data Sources
12.2.1 Secondary Sources
12.2.2 Primary Sources
12.3 Disclaimer
List of Tables
Table 1 Market Segmentation Analysis
Table 2 Global Bitcoin ATMs Market Companies with Areas Served
Table 3 Products Offerings Global Bitcoin ATMs Market
Table 4 Low Growth Scenario Forecasts
Table 5 Reference Case Growth Scenario
Table 6 High Growth Case Scenario
Table 7 Global Bitcoin ATMs Revenue (USD Million) And CAGR (%) By Type (2018-2030)
Table 8 Global Bitcoin ATMs Revenue (USD Million) And CAGR (%) By Applications (2018-2030)
Table 9 Global Bitcoin ATMs Revenue (USD Million) And CAGR (%) By Regions (2018-2030)
Table 10 Global Bitcoin ATMs Revenue (USD Million) By Type (2018-2022)
Table 11 Global Bitcoin ATMs Revenue Market Share (%) By Type (2018-2022)
Table 12 Global Bitcoin ATMs Revenue (USD Million) By Applications (2018-2022)
Table 13 Global Bitcoin ATMs Revenue Market Share (%) By Applications (2018-2022)
Table 14 Global Bitcoin ATMs Market Revenue (USD Million) By Regions (2018-2022)
Table 15 Global Bitcoin ATMs Market Share (%) By Regions (2018-2022)
Table 16 North America Bitcoin ATMs Revenue (USD Million) By Country (2018-2022)
Table 17 North America Bitcoin ATMs Revenue (USD Million) By Type (2018-2022)
Table 18 North America Bitcoin ATMs Revenue (USD Million) By Applications (2018-2022)
Table 19 Europe Bitcoin ATMs Revenue (USD Million) By Country (2018-2022)
Table 20 Europe Bitcoin ATMs Revenue (USD Million) By Type (2018-2022)
Table 21 Europe Bitcoin ATMs Revenue (USD Million) By Applications (2018-2022)
Table 22 Asia Pacific Bitcoin ATMs Revenue (USD Million) By Country (2018-2022)
Table 23 Asia Pacific Bitcoin ATMs Revenue (USD Million) By Type (2018-2022)
Table 24 Asia Pacific Bitcoin ATMs Revenue (USD Million) By Applications (2018-2022)
Table 25 South America Bitcoin ATMs Revenue (USD Million) By Country (2018-2022)
Table 26 South America Bitcoin ATMs Revenue (USD Million) By Type (2018-2022)
Table 27 South America Bitcoin ATMs Revenue (USD Million) By Applications (2018-2022)
Table 28 Middle East and Africa Bitcoin ATMs Revenue (USD Million) By Region (2018-2022)
Table 29 Middle East and Africa Bitcoin ATMs Revenue (USD Million) By Type (2018-2022)
Table 30 Middle East and Africa Bitcoin ATMs Revenue (USD Million) By Applications (2018-2022)
Table 31 Financial Analysis
Table 32 Global Bitcoin ATMs Revenue (USD Million) By Type (2023-2030)
Table 33 Global Bitcoin ATMs Revenue Market Share (%) By Type (2023-2030)
Table 34 Global Bitcoin ATMs Revenue (USD Million) By Applications (2023-2030)
Table 35 Global Bitcoin ATMs Revenue Market Share (%) By Applications (2023-2030)
Table 36 Global Bitcoin ATMs Market Revenue (USD Million), And Revenue (USD Million) By Regions (2023-2030)
Table 37 North America Bitcoin ATMs Revenue (USD)By Country (2023-2030)
Table 38 North America Bitcoin ATMs Revenue (USD Million) By Type (2023-2030)
Table 39 North America Bitcoin ATMs Revenue (USD Million) By Applications (2023-2030)
Table 40 Europe Bitcoin ATMs Revenue (USD Million) By Country (2023-2030)
Table 41 Europe Bitcoin ATMs Revenue (USD Million) By Type (2023-2030)
Table 42 Europe Bitcoin ATMs Revenue (USD Million) By Applications (2023-2030)
Table 43 Asia Pacific Bitcoin ATMs Revenue (USD Million) By Country (2023-2030)
Table 44 Asia Pacific Bitcoin ATMs Revenue (USD Million) By Type (2023-2030)
Table 45 Asia Pacific Bitcoin ATMs Revenue (USD Million) By Applications (2023-2030)
Table 46 South America Bitcoin ATMs Revenue (USD Million) By Country (2023-2030)
Table 47 South America Bitcoin ATMs Revenue (USD Million) By Type (2023-2030)
Table 48 South America Bitcoin ATMs Revenue (USD Million) By Applications (2023-2030)
Table 49 Middle East and Africa Bitcoin ATMs Revenue (USD Million) By Region (2023-2030)
Table 50 Middle East and Africa Bitcoin ATMs Revenue (USD Million) By Region (2023-2030)
Table 51 Middle East and Africa Bitcoin ATMs Revenue (USD Million) By Type (2023-2030)
Table 52 Middle East and Africa Bitcoin ATMs Revenue (USD Million) By Applications (2023-2030)
Table 53 Research Programs/Design for This Report
Table 54 Key Data Information from Secondary Sources
Table 55 Key Data Information from Primary Sources
List of Figures
Figure 1 Market Scope
Figure 2 Porter’s Five Forces
Figure 3 Global Bitcoin ATMs Revenue (USD Million) By Type (2018-2022)
Figure 4 Global Bitcoin ATMs Revenue Market Share (%) By Type (2022)
Figure 5 Global Bitcoin ATMs Revenue (USD Million) By Applications (2018-2022)
Figure 6 Global Bitcoin ATMs Revenue Market Share (%) By Applications (2022)
Figure 7 Global Bitcoin ATMs Market Revenue (USD Million) By Regions (2018-2022)
Figure 8 Global Bitcoin ATMs Market Share (%) By Regions (2022)
Figure 9 North America Bitcoin ATMs Revenue (USD Million) By Country (2018-2022)
Figure 10 North America Bitcoin ATMs Revenue (USD Million) By Type (2018-2022)
Figure 11 North America Bitcoin ATMs Revenue (USD Million) By Applications (2018-2022)
Figure 12 Europe Bitcoin ATMs Revenue (USD Million) By Country (2018-2022)
Figure 13 Europe Bitcoin ATMs Revenue (USD Million) By Type (2018-2022)
Figure 14 Europe Bitcoin ATMs Revenue (USD Million) By Applications (2018-2022)
Figure 15 Asia Pacific Bitcoin ATMs Revenue (USD Million) By Country (2018-2022)
Figure 16 Asia Pacific Bitcoin ATMs Revenue (USD Million) By Type (2018-2022)
Figure 17 Asia Pacific Bitcoin ATMs Revenue (USD Million) By Applications (2018-2022)
Figure 18 South America Bitcoin ATMs Revenue (USD Million) By Country (2018-2022)
Figure 19 South America Bitcoin ATMs Revenue (USD Million) By Type (2018-2022)
Figure 20 South America Bitcoin ATMs Revenue (USD Million) By Applications (2018-2022)
Figure 21 Middle East and Africa Bitcoin ATMs Revenue (USD Million) By Region (2018-2022)
Figure 22 Middle East and Africa Bitcoin ATMs Revenue (USD Million) By Type (2018-2022)
Figure 23 Middle East and Africa Bitcoin ATMs Revenue (USD Million) By Applications (2018-2022)
Figure 24 Global Bitcoin ATMs Revenue (USD Million) By Type (2023-2030)
Figure 25 Global Bitcoin ATMs Revenue Market Share (%) By Type (2030)
Figure 26 Global Bitcoin ATMs Revenue (USD Million) By Applications (2023-2030)
Figure 27 Global Bitcoin ATMs Revenue Market Share (%) By Applications (2030)
Figure 28 Global Bitcoin ATMs Market Revenue (USD Million) By Regions (2023-2030)
Figure 29 North America Bitcoin ATMs Revenue (USD Million) By Country (2023-2030)
Figure 30 North America Bitcoin ATMs Revenue (USD Million) By Type (2023-2030)
Figure 31 North America Bitcoin ATMs Revenue (USD Million) By Applications (2023-2030)
Figure 32 Europe Bitcoin ATMs Revenue (USD Million) By Country (2023-2030)
Figure 33 Europe Bitcoin ATMs Revenue (USD Million) By Type (2023-2030)
Figure 34 Europe Bitcoin ATMs Revenue (USD Million) By Applications (2023-2030)
Figure 35 Asia Pacific Bitcoin ATMs Revenue (USD Million) By Country (2023-2030)
Figure 36 Asia Pacific Bitcoin ATMs Revenue (USD Million) By Type (2023-2030)
Figure 37 Asia Pacific Bitcoin ATMs Revenue (USD Million) By Applications (2023-2030)
Figure 38 South America Bitcoin ATMs Revenue (USD Million) By Country (2023-2030)
Figure 39 South America Bitcoin ATMs Revenue (USD Million) By Type (2023-2030)
Figure 40 South America Bitcoin ATMs Revenue (USD Million) By Applications (2023-2030)
Figure 41 Middle East and Africa Bitcoin ATMs Revenue (USD Million) By Region (2023-2030)
Figure 42 Middle East and Africa Bitcoin ATMs Revenue (USD Million) By Region (2023-2030)
Figure 43 Middle East and Africa Bitcoin ATMs Revenue (USD Million) By Type (2023-2030)
Figure 44 Middle East and Africa Bitcoin ATMs Revenue (USD Million) By Applications (2023-2030)
Figure 45 Bottom-Up and Top-Down Approaches For This Report
Figure 46 Data Triangulation
