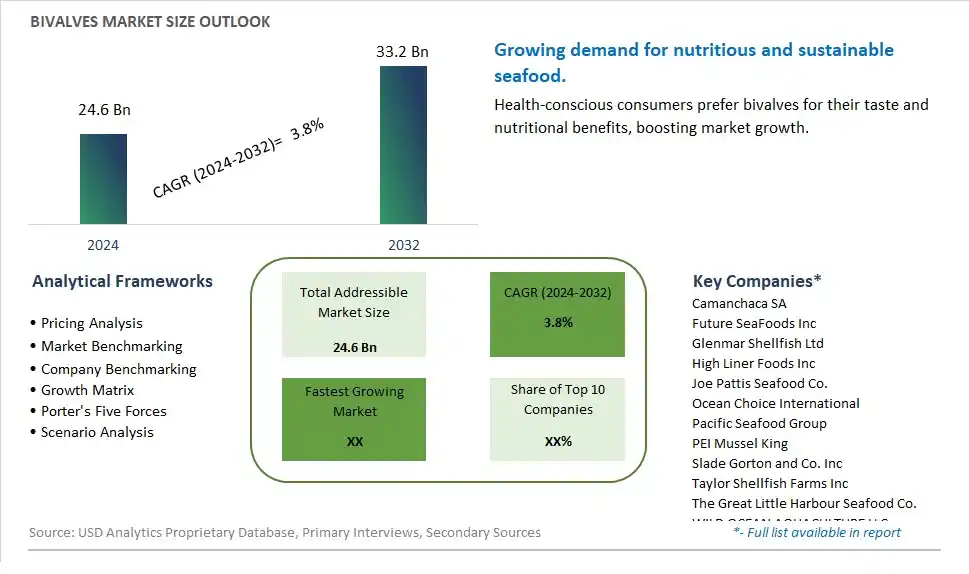
Global Bivalves Market Size is valued at $24.6 Billion in 2024 and is forecast to register a growth rate (CAGR) of 3.8% to reach $33.2 Billion by 2032.
The global Bivalves Market Comprehensive Study analyzes and forecasts the market size across 6 regions and 24 countries for diverse segments -By Type (Clams, Oyster, Mussels, Scallops, Others), By Source (Wild harvest, Aquaculture farming)
An Introduction to Bivalves Market
The Bivalves market in 2024 is expanding robustly, driven by the increasing demand for sustainable and nutritious seafood options. Bivalves, including clams, oysters, mussels, and scallops, are valued for their rich nutritional profile, including high protein, omega-3 fatty acids, and essential minerals. The market is supported by the growing consumer interest in healthy and environmentally friendly food choices. Advances in aquaculture and sustainable harvesting practices are enhancing the quality, availability, and safety of bivalves. The market is also benefiting from the rising popularity of seafood cuisine and the demand for premium and fresh seafood products, appealing to both home cooks and the foodservice industry.
Bivalves Competitive Landscape
The market report analyses the leading companies in the industry including Camanchaca SA, Future SeaFoods Inc, Glenmar Shellfish Ltd, High Liner Foods Inc, Joe Pattis Seafood Co., Ocean Choice International, Pacific Seafood Group, PEI Mussel King, Slade Gorton and Co. Inc, Taylor Shellfish Farms Inc, The Great Little Harbour Seafood Co., WILD OCEAN AQUACULTURE LLC, and Others.
Bivalves Market Dynamics
Bivalves Market Trend: Increasing Demand for Sustainable Seafood
The most prominent market trend for Bivalves is the increasing demand for sustainable seafood. Consumers are becoming more environmentally conscious and are seeking seafood products that are sourced responsibly and harvested in ways that minimize impact on marine ecosystems. Bivalves, such as mussels, clams, and oysters, are recognized as sustainable seafood options due to their filter-feeding nature, low environmental footprint, and ability to improve water quality. This trend aligns with consumer preferences for ethical and eco-friendly food choices, driving the demand for bivalve products in the seafood market.
Bivalves Market Driver: Health Benefits and Nutritional Value
A key market driver for Bivalves is their health benefits and nutritional value. Bivalves are nutrient-rich, low in fat, and high in protein, vitamins, minerals, and omega-3 fatty acids, making them a healthy choice for consumers. They are also known for their unique flavors, versatility in culinary applications, and perceived culinary delicacy, further driving their popularity. The driver of health benefits and nutritional value positions bivalves as desirable seafood options for health-conscious consumers seeking nutritious and flavorful seafood alternatives.
Bivalves Market Opportunity: Diversification of Product Offerings and Culinary Innovation
A potential opportunity within the Bivalves market lies in the diversification of product offerings and culinary innovation. Collaborating with chefs, seafood processors, and food scientists can lead to the development of value-added bivalve products, such as ready-to-cook meals, marinated bivalve varieties, flavored sauces, and gourmet preparations that cater to different consumer preferences and dining occasions. Additionally, exploring culinary innovations, such as fusion cuisine, bivalve-based snacks, and creative presentations, can attract new customer segments, enhance product appeal, and expand market reach. By focusing on diversification and culinary innovation, there are opportunities to capitalize on the growing demand for bivalves, create unique value propositions, and differentiate offerings in the seafood market.
Bivalves Market Share Analysis: Clams segment generated the highest revenue share in the industry
In the Bivalves Market, the largest segment is Clams. Clams are a type of bivalve mollusk that are widely consumed and appreciated for their culinary versatility and nutritional value. The fast growth of the Clams segment can be attributed to several factors. Firstly, clams are highly sought after in seafood markets due to their delicious flavor, tender texture, and ability to complement a variety of dishes such as pasta, soups, stews, and seafood platters. Additionally, clams are rich in protein, vitamins, minerals, and omega-3 fatty acids, making them a healthy and nutritious choice for consumers seeking balanced diets. Furthermore, advancements in aquaculture and sustainable harvesting practices have increased the availability and accessibility of clams, meeting the growing demand from both domestic and international markets. Further, clams are popular among seafood enthusiasts, chefs, and culinary professionals for their culinary versatility and culinary appeal, contributing to their dominance in the Bivalves Market.
Bivalves Market Share Analysis: Aquaculture Farming is the fastest growing segment over the forecast period to 2032
Within the Bivalves Market, the Aquaculture Farming segment is anticipated to be the fastest growing up to 2032. The rapid growth of aquaculture farming can be attributed to several key factors. Firstly, aquaculture farming of bivalves such as clams, oysters, mussels, and scallops offers numerous advantages over wild harvest, including controlled breeding, efficient production cycles, and higher yields. Aquaculture practices also promote sustainability by reducing pressure on wild populations and minimizing environmental impact. Additionally, advancements in aquaculture technologies, such as improved hatchery techniques, selective breeding, and water quality management, have enhanced the productivity and quality of farmed bivalves. Further, the increasing demand for bivalves in global seafood markets, coupled with consumer preferences for sustainably sourced and responsibly farmed seafood, further drives the growth of the Aquaculture Farming segment. As a result, aquaculture farming is poised to play a significant role in meeting the growing demand for bivalves while ensuring environmental sustainability and resource conservation in the Bivalves Market.
Bivalves Market Segmentation
By Type
Clams
Oyster
Mussels
Scallops
Others
By Source
Wild harvest
Aquaculture farming
Countries Analyzed
North America (US, Canada, Mexico)
Europe (Germany, UK, France, Spain, Italy, Russia, Rest of Europe)
Asia Pacific (China, India, Japan, South Korea, Australia, South East Asia, Rest of Asia)
South America (Brazil, Argentina, Rest of South America)
Middle East and Africa (Saudi Arabia, UAE, Rest of Middle East, South Africa, Egypt, Rest of Africa)
Bivalves Companies Profiled in the Study
Camanchaca SA
Future SeaFoods Inc
Glenmar Shellfish Ltd
High Liner Foods Inc
Joe Pattis Seafood Co.
Ocean Choice International
Pacific Seafood Group
PEI Mussel King
Slade Gorton and Co. Inc
Taylor Shellfish Farms Inc
The Great Little Harbour Seafood Co.
WILD OCEAN AQUACULTURE LLC
*- List Not Exhaustive
Chapter 1. TABLE OF CONTENTS
Chapter 2. Introduction to Bivalves Market
2.1. Market Overview
2.2. Key Statistics and Report Highlights
2.3. Scope of the Comprehensive Study
2.3.1. Market Definition
2.3.2 Countries and Regions Covered
2.3.3 Research Objective
2.3.4 Units, Currency, and Conversions
2.3.5 Industry Value Chain
2.4. Key Market Segments
2.5. Key Companies
2.6. Study Period
Chapter 3. Strategic Analysis Review
3.1. Bivalves Pricing Analysis and Forecast
3.2. Porter’s Five Forces
3.3. Market Ecosystem
3.4. SWOT Analysis
3.5. Regulatory Scenario
3.3. Effects of Inflation, Russia-Ukraine War, moderating economic growth, and other macroeconomic factors
Chapter 4. Competitive Landscape
4.1. Market Share Analysis
4.1.1. Global Bivalves Market Share by Company, 2023
4.1.2. Product Offerings of Leading Bivalves Companies
4.2. Market Entropy
4.2.1. New Product Launches in the Industry
4.2.2. Mergers, Acquisitions, Joint ventures, and Partnerships
4.3. Key Strategies and Best Practices
Chapter 5. Global Market Projections: Best, Reference, and Low Case Scenarios
5.1. Growth Analysis- Case Scenario Definitions
5.2. Low Growth Case Scenario Forecasts
5.3. Reference Growth Case Scenario Forecasts
5.4. High Growth Case Scenario Forecasts
Chapter 6. Market Dynamics
6.1. Bivalves Market Drivers
6.2. Bivalves Market Challenges
6.6. Bivalves Market Opportunities
6.4. Bivalves Market Trends
Chapter 7. Global Bivalves Market Outlook Trends
7.1. Global Bivalves Revenue (USD Million) and CAGR (%) by Type (2021-2032)
7.2. Global Bivalves Revenue (USD Million) and CAGR (%) by Application (2021-2032)
7.3. Global Bivalves Revenue (USD Million) and CAGR (%) by Product (2021-2032)
By Type
Clams
Oyster
Mussels
Scallops
Others
By Source
Wild harvest
Aquaculture farming
Chapter 8. Global Bivalves Regional Analysis and Outlook
8.1. Global Bivalves Revenue (USD Million) By Regions (2021- 2032)
8.2. North America Bivalves Revenue (USD Million) by Country (2021-2032)
8.2.1. United States Bivalves Regional Analysis and Outlook
8.2.2. Canada Bivalves Regional Analysis and Outlook
8.2.3. Mexico Bivalves Regional Analysis and Outlook
8.3. Europe Bivalves Revenue (USD Million), by Country (2021-2032)
8.3.1. Germany Bivalves Regional Analysis and Outlook
8.3.2. France Bivalves Regional Analysis and Outlook
8.3.3. United Kingdom Bivalves Regional Analysis and Outlook
8.3.4. Spain Bivalves Regional Analysis and Outlook
8.3.5. Italy Bivalves Regional Analysis and Outlook
8.3.6. Russia Bivalves Regional Analysis and Outlook
8.3.7. Rest of Europe Bivalves Regional Analysis and Outlook
8.4. Asia Pacific Bivalves Revenue (USD Million) by Country (2021-2032)
8.4.1. China Bivalves Regional Analysis and Outlook
8.4.2. Japan Bivalves Regional Analysis and Outlook
8.4.3. India Bivalves Regional Analysis and Outlook
8.4.4. South Korea Bivalves Regional Analysis and Outlook
8.4.5. Australia Bivalves Regional Analysis and Outlook
8.4.6. South East Asia Bivalves Regional Analysis and Outlook
8.4.7. Rest of Asia Pacific Bivalves Regional Analysis and Outlook
8.5. South America Bivalves Revenue (USD Million), by Country (2021-2032)
8.5.1. Brazil Bivalves Regional Analysis and Outlook
8.5.2. Argentina Bivalves Regional Analysis and Outlook
8.5.3. Rest of South America Bivalves Regional Analysis and Outlook
8.6. Middle East and Africa Bivalves Revenue (USD Million) by Country (2021-2032)
8.6.1. Middle East Bivalves Regional Analysis and Outlook
8.6.2. Africa Bivalves Regional Analysis and Outlook
Chapter 9. North America Bivalves Analysis and Outlook
9.1. North America Bivalves Revenue (USD Million) by Segments (2021-2032)
9.1.1. North America Bivalves Revenue (USD Million) by Type (2021-2032)
9.1.2. North America Bivalves Revenue (USD Million) by Application (2021-2032)
9.1.3. North America Bivalves Revenue (USD Million) by Product (2021-2032)
By Type
Clams
Oyster
Mussels
Scallops
Others
By Source
Wild harvest
Aquaculture farming
Chapter 10. Europe Bivalves Analysis and Outlook
10.1. Europe Bivalves Revenue (USD Million), by Segments (USD Million) (2021-2032)
10.1.1. Europe Bivalves Revenue (USD Million) by Type (2021-2032)
10.1.2. Europe Bivalves Revenue (USD Million) by Application (2021-2032)
10.1.3. Europe Bivalves Revenue (USD Million) by Product (2021-2032)
By Type
Clams
Oyster
Mussels
Scallops
Others
By Source
Wild harvest
Aquaculture farming
Chapter 11. Asia Pacific Bivalves Analysis and Outlook
11.1. Asia Pacific Bivalves Revenue (USD Million), and Revenue (USD Million) by Segments (2021-2032)
11.1.1. Asia Pacific Bivalves Revenue (USD Million) by Type (2021-2032)
11.1.2. Asia Pacific Bivalves Revenue (USD Million) by Application (2021-2032)
11.1.3. Asia Pacific Bivalves Revenue (USD Million) by Product (2021-2032)
By Type
Clams
Oyster
Mussels
Scallops
Others
By Source
Wild harvest
Aquaculture farming
Chapter 12. South America Bivalves Analysis and Outlook
12.1. South America Bivalves Revenue (USD Million), by Segments (2021-2032)
12.1.1. South America Bivalves Revenue (USD Million) by Type (2021-2032)
12.1.2. South America Bivalves Revenue (USD Million) by Application (2021-2032)
12.1.3. South America Bivalves Revenue (USD Million) by Product (2021-2032)
By Type
Clams
Oyster
Mussels
Scallops
Others
By Source
Wild harvest
Aquaculture farming
Chapter 13. Middle East and Africa Bivalves Analysis and Outlook
13.1. Middle East and Africa Bivalves Revenue (USD Million), by Segments (2021-2032)
13.1.1. Middle East and Africa Bivalves Revenue (USD Million) by Type (2021-2032)
13.1.2. Middle East and Africa Bivalves Revenue (USD Million) by Application (2021-2032)
13.1.3. Middle East and Africa Bivalves Revenue (USD Million) by Product (2021-2032)
By Type
Clams
Oyster
Mussels
Scallops
Others
By Source
Wild harvest
Aquaculture farming
Chapter 14. Bivalves Company Profiles
14.1 Business Overview
14.2 Product Profiles
14.3 SWOT Profiles
14.5 Recent Developments
14.6 Financial Profile
List of Companies
Camanchaca SA
Future SeaFoods Inc
Glenmar Shellfish Ltd
High Liner Foods Inc
Joe Pattis Seafood Co.
Ocean Choice International
Pacific Seafood Group
PEI Mussel King
Slade Gorton and Co. Inc
Taylor Shellfish Farms Inc
The Great Little Harbour Seafood Co.
WILD OCEAN AQUACULTURE LLC
15. Methodology and Data Sources
15.1 Customization Offerings
15.2 Subscription Services
15.3 Related Reports
15.4 Publisher Expertise
LIST OF TABLES
Table 1 Market Segmentation Analysis
Table 2 Global Bivalves Market Share of Leading Companies, 2023
Table 3 Product Offerings of Leading Companies
Table 4 Low Growth Scenario Forecasts
Table 5 Reference Case Growth Scenario
Table 6 High Growth Case Scenario
Table 7 Global Bivalves Revenue (USD Million) And CAGR (%) By Type (2021-2032)
Table 8 Global Bivalves Revenue (USD Million) And CAGR (%) By Application (2021-2032)
Table 9 Global Bivalves Revenue (USD Million) And CAGR (%) By Product (2021-2032)
Table 10 Global Bivalves Market Revenue (USD Million) By Regions (2021-2032)
Table 11 Global Bivalves Market Share (%) By Regions (2021-2032)
Table 12 North America Bivalves Revenue (USD Million) By Country (2021-2032)
Table 13 Europe Bivalves Revenue (USD Million) By Country (2021-2032)
Table 14 Asia Pacific Bivalves Revenue (USD Million) By Country (2021-2032)
Table 15 South America Bivalves Revenue (USD Million) By Country (2021-2032)
Table 16 Middle East and Africa Bivalves Revenue (USD Million) By Region (2021-2032)
Table 17 North America Bivalves Revenue (USD Million) By Type (2021-2032)
Table 18 North America Bivalves Revenue (USD Million) By Application (2021-2032)
Table 19 North America Bivalves Revenue (USD Million) By Product (2021-2032)
Table 20 Europe Bivalves Revenue (USD Million) By Type (2021-2032)
Table 21 Europe Bivalves Revenue (USD Million) By Application (2021-2032)
Table 22 Europe Bivalves Revenue (USD Million) By Product (2021-2032)
Table 23 Asia Pacific Bivalves Revenue (USD Million) By Type (2021-2032)
Table 24 Asia Pacific Bivalves Revenue (USD Million) By Application (2021-2032)
Table 25 Asia Pacific Bivalves Revenue (USD Million) By Product (2021-2032)
Table 26 South America Bivalves Revenue (USD Million) By Type (2021-2032)
Table 27 South America Bivalves Revenue (USD Million) By Application (2021-2032)
Table 28 South America Bivalves Revenue (USD Million) By Product (2021-2032)
Table 29 Middle East and Africa Bivalves Revenue (USD Million) By Type (2021-2032)
Table 30 Middle East and Africa Bivalves Revenue (USD Million) By Application (2021-2032)
Table 31 Middle East and Africa Bivalves Revenue (USD Million) By Product (2021-2032)
LIST OF FIGURES
Figure 1. Market Scope
Figure 2. Pricing Forecasts Per Unit, 2023- 2032
Figure 3. Porter’s Five Forces
Figure 4. Global Bivalves Market Revenue (USD Million) By Regions (2021-2032)
Figure 5. Global Bivalves Market Share (%) By Regions (2023)
Figure 6. North America Bivalves Revenue (USD Million) By Country (2021-2032)
Figure 7. United States Bivalves Revenue (USD Million) By Country (2021-2032)
Figure 8. Canada Bivalves Revenue (USD Million) By Country (2021-2032)
Figure 9. Mexico Bivalves Revenue (USD Million) By Country (2021-2032)
Figure 10. Europe Bivalves Revenue (USD Million) By Country (2021-2032)
Figure 11. Germany Bivalves Revenue (USD Million) By Country (2021-2032)
Figure 12. France Bivalves Revenue (USD Million) By Country (2021-2032)
Figure 13. United Kingdom Bivalves Revenue (USD Million) By Country (2021-2032)
Figure 14. Spain Bivalves Revenue (USD Million) By Country (2021-2032)
Figure 15. Italy Bivalves Revenue (USD Million) By Country (2021-2032)
Figure 16. Russia Bivalves Revenue (USD Million) By Country (2021-2032)
Figure 17. Rest of Europe Bivalves Revenue (USD Million) By Country (2021-2032)
Figure 11. Asia Pacific Bivalves Revenue (USD Million) By Country (2021-2032)
Figure 12. China Bivalves Revenue (USD Million) By Country (2021-2032)
Figure 13. Japan Bivalves Revenue (USD Million) By Country (2021-2032)
Figure 14. India Bivalves Revenue (USD Million) By Country (2021-2032)
Figure 15. South Korea Bivalves Revenue (USD Million) By Country (2021-2032)
Figure 16. Australia Bivalves Revenue (USD Million) By Country (2021-2032)
Figure 17. South East Asia Bivalves Revenue (USD Million) By Country (2021-2032)
Figure 18. South America Bivalves Revenue (USD Million) By Country (2021-2032)
Figure 19. Brazil Bivalves Revenue (USD Million) By Country (2021-2032)
Figure 20. Argentina Bivalves Revenue (USD Million) By Country (2021-2032)
Figure 21. Rest of Asia Pacific Bivalves Revenue (USD Million) By Country (2021-2032)
Figure 22. Middle East and Africa Bivalves Revenue (USD Million) By Region (2021-2032)
Figure 23. Saudi Arabia Bivalves Revenue (USD Million) By Region (2021-2032)
Figure 24. The UAE Bivalves Revenue (USD Million) By Region (2021-2032)
Figure 25. Rest of Middle East Bivalves Revenue (USD Million) By Region (2021-2032)
Figure 26. South Africa Bivalves Revenue (USD Million) By Region (2021-2032)
Figure 27. Africa Bivalves Revenue (USD Million) By Region (2021-2032)
Figure 28. North America Bivalves Revenue (USD Million) By Type (2021-2032)
Figure 29. North America Bivalves Revenue (USD Million) By Application (2021-2032)
Figure 30. North America Bivalves Revenue (USD Million) By Product (2021-2032)
Figure 31. Europe Bivalves Revenue (USD Million) By Type (2021-2032)
Figure 32. Europe Bivalves Revenue (USD Million) By Application (2021-2032)
Figure 33. Europe Bivalves Revenue (USD Million) By Product (2021-2032)
Figure 34. Asia Pacific Bivalves Revenue (USD Million) By Type (2021-2032)
Figure 35. Asia Pacific Bivalves Revenue (USD Million) By Application (2021-2032)
Figure 36. Asia Pacific Bivalves Revenue (USD Million) By Product (2021-2032)
Figure 37. South America Bivalves Revenue (USD Million) By Type (2021-2032)
Figure 38. South America Bivalves Revenue (USD Million) By Application (2021-2032)
Figure 39. South America Bivalves Revenue (USD Million) By Product (2021-2032)
Figure 40. Middle East and Africa Bivalves Revenue (USD Million) By Type (2021-2032)
Figure 41. Middle East and Africa Bivalves Revenue (USD Million) By Application (2021-2032)
Figure 42. Middle East and Africa Bivalves Revenue (USD Million) By Product (2021-2032)
By Type
Clams
Oyster
Mussels
Scallops
Others
By Source
Wild harvest
Aquaculture farming
Countries Analyzed
North America (US, Canada, Mexico)
Europe (Germany, UK, France, Spain, Italy, Russia, Rest of Europe)
Asia Pacific (China, India, Japan, South Korea, Australia, South East Asia, Rest of Asia)
South America (Brazil, Argentina, Rest of South America)
Middle East and Africa (Saudi Arabia, UAE, Rest of Middle East, South Africa, Egypt, Rest of Africa)
