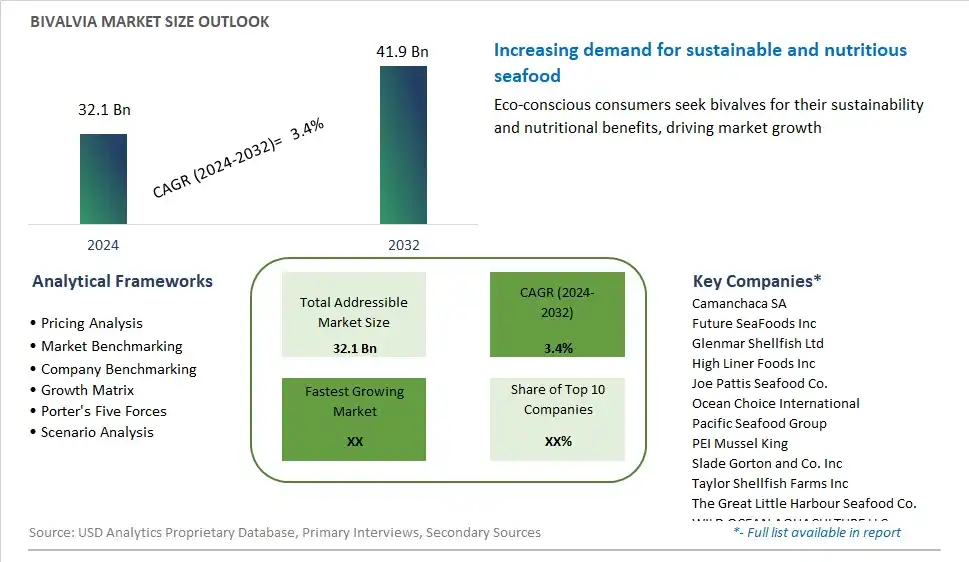
Global Bivalvia Market Size is valued at $32.1 Billion in 2024 and is forecast to register a growth rate (CAGR) of 3.4% to reach $41.9 Billion by 2032.
The global Bivalvia Market Comprehensive Study analyzes and forecasts the market size across 6 regions and 24 countries for diverse segments -By Type (Clams, Oyster, Mussels, Scallops, Others), By Source (Wild harvest, Aquaculture farming)
An Introduction to Bivalvia Market
In 2024, the term "Bivalvia" refers to a class of mollusks characterized by their hinged, two-part shells, encompassing a diverse array of aquatic species such as clams, oysters, mussels, and scallops. These bivalve mollusks play significant ecological roles in marine and freshwater ecosystems, serving as filter feeders that help maintain water quality and balance aquatic food webs. Beyond their ecological importance, bivalves hold cultural and economic significance as well, serving as a valuable source of sustenance and livelihood for coastal communities around the world. In addition to being harvested for food, bivalves are also cultivated for pearls, pearls, and serve as indicators of environmental health due to their sensitivity to pollution and habitat degradation. As concerns about sustainable seafood production and marine conservation grow, the management and conservation of bivalve populations become increasingly important, ensuring the continued health of aquatic ecosystems and the well-being of human communities reliant on these invaluable resources.
Bivalvia Competitive Landscape
The market report analyses the leading companies in the industry including Camanchaca SA, Future SeaFoods Inc, Glenmar Shellfish Ltd, High Liner Foods Inc, Joe Pattis Seafood Co., Ocean Choice International, Pacific Seafood Group, PEI Mussel King, Slade Gorton and Co. Inc, Taylor Shellfish Farms Inc, The Great Little Harbour Seafood Co. , WILD OCEAN AQUACULTURE LLC, and Others.
Bivalvia Market Dynamics
Bivalvia Market Trend: Growing Consumer Demand for Sustainable and Ethical Seafood
The market trend for Bivalvia reflects the growing consumer demand for sustainable and ethical seafood choices. Bivalvia, which includes mussels, oysters, and clams, is recognized for its environmental sustainability due to its filter-feeding nature, which helps improve water quality and ecosystem health. As consumers become more environmentally conscious and concerned about the impact of their food choices, there's a shift towards seafood options that are harvested or farmed using sustainable practices. Bivalves are increasingly viewed as an eco-friendly protein source that aligns with principles of responsible consumption and environmental stewardship. This trend is driving demand for bivalve products in both retail and foodservice sectors, as consumers seek out seafood options that offer both nutritional value and sustainability credentials.
Market Driver: Health Benefits and Nutritional Value of Bivalves
A significant driver of the Bivalvia market is the health benefits and nutritional value associated with bivalve consumption. Bivalves are a rich source of essential nutrients such as protein, omega-3 fatty acids, vitamins, and minerals, making them a valuable addition to a balanced diet. Moreover, bivalves are low in fat and calories, making them a nutritious option for health-conscious consumers looking to maintain or improve their dietary habits. The presence of bioactive compounds such as taurine and glycogen further enhances the nutritional profile of bivalves, offering potential health benefits such as cardiovascular support and immune system modulation. This driver highlights the importance of promoting the nutritional attributes of bivalves to attract health-conscious consumers and drive market growth.
Market Opportunity: Expansion of Bivalve Product Offerings and Culinary Applications
An opportunity in the Bivalvia market lies in the expansion of product offerings and culinary applications to meet evolving consumer preferences and market demands. While bivalves are commonly consumed in their whole form, there's potential to diversify product formats and preparations to appeal to a broader audience. For example, value-added bivalve products such as smoked mussels, marinated oysters, and clam-based soups or sauces can cater to consumers seeking convenient and flavorful seafood options. Additionally, exploring innovative culinary applications of bivalves in restaurant menus and gourmet food products can elevate their perceived value and enhance consumer interest. By leveraging culinary creativity and culinary trends such as seafood fusion cuisine and sustainable seafood dining, companies can unlock new opportunities for growth and differentiation in the bivalve market.
Bivalvia Market Share Analysis: Oyster held the dominant market share in 2024
In the Bivalvia market, oysters emerge as the largest segment, primarily due to their widespread popularity, culinary versatility, and extensive commercial cultivation. Oysters are prized for their unique flavor profile, delicate texture, and nutritional value, making them a favorite among seafood enthusiasts worldwide. Their versatility allows for various culinary preparations, including raw consumption, grilling, frying, and incorporation into soups, stews, and pasta dishes. Additionally, oysters are cultivated in both wild and farmed settings, ensuring consistent availability year-round and meeting the demand of consumers and restaurant establishments. Further, oysters are associated with cultural traditions and culinary heritage in many coastal regions, further enhancing their appeal and consumption. With their rich flavor, nutritional benefits, and cultural significance, oysters maintain their dominance as the largest segment in the Bivalvia market, catering to the diverse tastes and preferences of seafood lovers globally.
Bivalvia Market Share Analysis: Aquaculture Farming market is poised to register the fastest growth rae over the forecast period to 2032
Among the sources in the Bivalvia market, aquaculture farming is the fastest-growing segment, driven by several key factors. Firstly, aquaculture farming offers a sustainable and controlled environment for bivalve production, ensuring consistent supply and meeting the increasing demand for seafood. By cultivating bivalves in managed aquatic systems, aquaculture farming mitigates the pressure on wild populations and helps alleviate concerns about overfishing and habitat degradation. Secondly, advancements in aquaculture technology and practices have improved the efficiency and productivity of bivalve farming operations, resulting in higher yields and better-quality products. Innovations such as selective breeding, improved feed formulations, and disease management strategies enhance the resilience and growth rates of farmed bivalves, contributing to the segment's growth. Thirdly, the growing consumer awareness of food sustainability and traceability drives the preference for aquaculture-farmed bivalves, which are often perceived as environmentally friendly and ethically sourced. Further, aquaculture farming allows for the production of bivalves in controlled environments, reducing the risk of contamination and ensuring food safety standards. With its potential to meet the rising demand for bivalves while promoting environmental stewardship and food security, aquaculture farming is poised to continue its rapid expansion in the Bivalvia market.
Bivalvia Market Segmentation
By Type
Clams
Oyster
Mussels
Scallops
Others
By Source
Wild harvest
Aquaculture farming
Countries Analyzed
North America (US, Canada, Mexico)
Europe (Germany, UK, France, Spain, Italy, Russia, Rest of Europe)
Asia Pacific (China, India, Japan, South Korea, Australia, South East Asia, Rest of Asia)
South America (Brazil, Argentina, Rest of South America)
Middle East and Africa (Saudi Arabia, UAE, Rest of Middle East, South Africa, Egypt, Rest of Africa)
Bivalvia Companies Profiled in the Study
Camanchaca SA
Future SeaFoods Inc
Glenmar Shellfish Ltd
High Liner Foods Inc
Joe Pattis Seafood Co.
Ocean Choice International
Pacific Seafood Group
PEI Mussel King
Slade Gorton and Co. Inc
Taylor Shellfish Farms Inc
The Great Little Harbour Seafood Co.
WILD OCEAN AQUACULTURE LLC
*- List Not Exhaustive
Chapter 1. TABLE OF CONTENTS
Chapter 2. Introduction to Bivalvia Market
2.1. Market Overview
2.2. Key Statistics and Report Highlights
2.3. Scope of the Comprehensive Study
2.3.1. Market Definition
2.3.2 Countries and Regions Covered
2.3.3 Research Objective
2.3.4 Units, Currency, and Conversions
2.3.5 Industry Value Chain
2.4. Key Market Segments
2.5. Key Companies
2.6. Study Period
Chapter 3. Strategic Analysis Review
3.1. Bivalvia Pricing Analysis and Forecast
3.2. Porter’s Five Forces
3.3. Market Ecosystem
3.4. SWOT Analysis
3.5. Regulatory Scenario
3.3. Effects of Inflation, Russia-Ukraine War, moderating economic growth, and other macroeconomic factors
Chapter 4. Competitive Landscape
4.1. Market Share Analysis
4.1.1. Global Bivalvia Market Share by Company, 2023
4.1.2. Product Offerings of Leading Bivalvia Companies
4.2. Market Entropy
4.2.1. New Product Launches in the Industry
4.2.2. Mergers, Acquisitions, Joint ventures, and Partnerships
4.3. Key Strategies and Best Practices
Chapter 5. Global Market Projections: Best, Reference, and Low Case Scenarios
5.1. Growth Analysis- Case Scenario Definitions
5.2. Low Growth Case Scenario Forecasts
5.3. Reference Growth Case Scenario Forecasts
5.4. High Growth Case Scenario Forecasts
Chapter 6. Market Dynamics
6.1. Bivalvia Market Drivers
6.2. Bivalvia Market Challenges
6.6. Bivalvia Market Opportunities
6.4. Bivalvia Market Trends
Chapter 7. Global Bivalvia Market Outlook Trends
7.1. Global Bivalvia Revenue (USD Million) and CAGR (%) by Type (2021-2032)
7.2. Global Bivalvia Revenue (USD Million) and CAGR (%) by Application (2021-2032)
7.3. Global Bivalvia Revenue (USD Million) and CAGR (%) by Product (2021-2032)
By Type
Clams
Oyster
Mussels
Scallops
Others
By Source
Wild harvest
Aquaculture farming
Chapter 8. Global Bivalvia Regional Analysis and Outlook
8.1. Global Bivalvia Revenue (USD Million) By Regions (2021- 2032)
8.2. North America Bivalvia Revenue (USD Million) by Country (2021-2032)
8.2.1. United States Bivalvia Regional Analysis and Outlook
8.2.2. Canada Bivalvia Regional Analysis and Outlook
8.2.3. Mexico Bivalvia Regional Analysis and Outlook
8.3. Europe Bivalvia Revenue (USD Million), by Country (2021-2032)
8.3.1. Germany Bivalvia Regional Analysis and Outlook
8.3.2. France Bivalvia Regional Analysis and Outlook
8.3.3. United Kingdom Bivalvia Regional Analysis and Outlook
8.3.4. Spain Bivalvia Regional Analysis and Outlook
8.3.5. Italy Bivalvia Regional Analysis and Outlook
8.3.6. Russia Bivalvia Regional Analysis and Outlook
8.3.7. Rest of Europe Bivalvia Regional Analysis and Outlook
8.4. Asia Pacific Bivalvia Revenue (USD Million) by Country (2021-2032)
8.4.1. China Bivalvia Regional Analysis and Outlook
8.4.2. Japan Bivalvia Regional Analysis and Outlook
8.4.3. India Bivalvia Regional Analysis and Outlook
8.4.4. South Korea Bivalvia Regional Analysis and Outlook
8.4.5. Australia Bivalvia Regional Analysis and Outlook
8.4.6. South East Asia Bivalvia Regional Analysis and Outlook
8.4.7. Rest of Asia Pacific Bivalvia Regional Analysis and Outlook
8.5. South America Bivalvia Revenue (USD Million), by Country (2021-2032)
8.5.1. Brazil Bivalvia Regional Analysis and Outlook
8.5.2. Argentina Bivalvia Regional Analysis and Outlook
8.5.3. Rest of South America Bivalvia Regional Analysis and Outlook
8.6. Middle East and Africa Bivalvia Revenue (USD Million) by Country (2021-2032)
8.6.1. Middle East Bivalvia Regional Analysis and Outlook
8.6.2. Africa Bivalvia Regional Analysis and Outlook
Chapter 9. North America Bivalvia Analysis and Outlook
9.1. North America Bivalvia Revenue (USD Million) by Segments (2021-2032)
9.1.1. North America Bivalvia Revenue (USD Million) by Type (2021-2032)
9.1.2. North America Bivalvia Revenue (USD Million) by Application (2021-2032)
9.1.3. North America Bivalvia Revenue (USD Million) by Product (2021-2032)
By Type
Clams
Oyster
Mussels
Scallops
Others
By Source
Wild harvest
Aquaculture farming
Chapter 10. Europe Bivalvia Analysis and Outlook
10.1. Europe Bivalvia Revenue (USD Million), by Segments (USD Million) (2021-2032)
10.1.1. Europe Bivalvia Revenue (USD Million) by Type (2021-2032)
10.1.2. Europe Bivalvia Revenue (USD Million) by Application (2021-2032)
10.1.3. Europe Bivalvia Revenue (USD Million) by Product (2021-2032)
By Type
Clams
Oyster
Mussels
Scallops
Others
By Source
Wild harvest
Aquaculture farming
Chapter 11. Asia Pacific Bivalvia Analysis and Outlook
11.1. Asia Pacific Bivalvia Revenue (USD Million), and Revenue (USD Million) by Segments (2021-2032)
11.1.1. Asia Pacific Bivalvia Revenue (USD Million) by Type (2021-2032)
11.1.2. Asia Pacific Bivalvia Revenue (USD Million) by Application (2021-2032)
11.1.3. Asia Pacific Bivalvia Revenue (USD Million) by Product (2021-2032)
By Type
Clams
Oyster
Mussels
Scallops
Others
By Source
Wild harvest
Aquaculture farming
Chapter 12. South America Bivalvia Analysis and Outlook
12.1. South America Bivalvia Revenue (USD Million), by Segments (2021-2032)
12.1.1. South America Bivalvia Revenue (USD Million) by Type (2021-2032)
12.1.2. South America Bivalvia Revenue (USD Million) by Application (2021-2032)
12.1.3. South America Bivalvia Revenue (USD Million) by Product (2021-2032)
By Type
Clams
Oyster
Mussels
Scallops
Others
By Source
Wild harvest
Aquaculture farming
Chapter 13. Middle East and Africa Bivalvia Analysis and Outlook
13.1. Middle East and Africa Bivalvia Revenue (USD Million), by Segments (2021-2032)
13.1.1. Middle East and Africa Bivalvia Revenue (USD Million) by Type (2021-2032)
13.1.2. Middle East and Africa Bivalvia Revenue (USD Million) by Application (2021-2032)
13.1.3. Middle East and Africa Bivalvia Revenue (USD Million) by Product (2021-2032)
By Type
Clams
Oyster
Mussels
Scallops
Others
By Source
Wild harvest
Aquaculture farming
Chapter 14. Bivalvia Company Profiles
14.1 Business Overview
14.2 Product Profiles
14.3 SWOT Profiles
14.5 Recent Developments
14.6 Financial Profile
List of Companies
Camanchaca SA
Future SeaFoods Inc
Glenmar Shellfish Ltd
High Liner Foods Inc
Joe Pattis Seafood Co.
Ocean Choice International
Pacific Seafood Group
PEI Mussel King
Slade Gorton and Co. Inc
Taylor Shellfish Farms Inc
The Great Little Harbour Seafood Co.
WILD OCEAN AQUACULTURE LLC
15. Methodology and Data Sources
15.1 Customization Offerings
15.2 Subscription Services
15.3 Related Reports
15.4 Publisher Expertise
LIST OF TABLES
Table 1 Market Segmentation Analysis
Table 2 Global Bivalvia Market Share of Leading Companies, 2023
Table 3 Product Offerings of Leading Companies
Table 4 Low Growth Scenario Forecasts
Table 5 Reference Case Growth Scenario
Table 6 High Growth Case Scenario
Table 7 Global Bivalvia Revenue (USD Million) And CAGR (%) By Type (2021-2032)
Table 8 Global Bivalvia Revenue (USD Million) And CAGR (%) By Application (2021-2032)
Table 9 Global Bivalvia Revenue (USD Million) And CAGR (%) By Product (2021-2032)
Table 10 Global Bivalvia Market Revenue (USD Million) By Regions (2021-2032)
Table 11 Global Bivalvia Market Share (%) By Regions (2021-2032)
Table 12 North America Bivalvia Revenue (USD Million) By Country (2021-2032)
Table 13 Europe Bivalvia Revenue (USD Million) By Country (2021-2032)
Table 14 Asia Pacific Bivalvia Revenue (USD Million) By Country (2021-2032)
Table 15 South America Bivalvia Revenue (USD Million) By Country (2021-2032)
Table 16 Middle East and Africa Bivalvia Revenue (USD Million) By Region (2021-2032)
Table 17 North America Bivalvia Revenue (USD Million) By Type (2021-2032)
Table 18 North America Bivalvia Revenue (USD Million) By Application (2021-2032)
Table 19 North America Bivalvia Revenue (USD Million) By Product (2021-2032)
Table 20 Europe Bivalvia Revenue (USD Million) By Type (2021-2032)
Table 21 Europe Bivalvia Revenue (USD Million) By Application (2021-2032)
Table 22 Europe Bivalvia Revenue (USD Million) By Product (2021-2032)
Table 23 Asia Pacific Bivalvia Revenue (USD Million) By Type (2021-2032)
Table 24 Asia Pacific Bivalvia Revenue (USD Million) By Application (2021-2032)
Table 25 Asia Pacific Bivalvia Revenue (USD Million) By Product (2021-2032)
Table 26 South America Bivalvia Revenue (USD Million) By Type (2021-2032)
Table 27 South America Bivalvia Revenue (USD Million) By Application (2021-2032)
Table 28 South America Bivalvia Revenue (USD Million) By Product (2021-2032)
Table 29 Middle East and Africa Bivalvia Revenue (USD Million) By Type (2021-2032)
Table 30 Middle East and Africa Bivalvia Revenue (USD Million) By Application (2021-2032)
Table 31 Middle East and Africa Bivalvia Revenue (USD Million) By Product (2021-2032)
LIST OF FIGURES
Figure 1. Market Scope
Figure 2. Pricing Forecasts Per Unit, 2023- 2032
Figure 3. Porter’s Five Forces
Figure 4. Global Bivalvia Market Revenue (USD Million) By Regions (2021-2032)
Figure 5. Global Bivalvia Market Share (%) By Regions (2023)
Figure 6. North America Bivalvia Revenue (USD Million) By Country (2021-2032)
Figure 7. United States Bivalvia Revenue (USD Million) By Country (2021-2032)
Figure 8. Canada Bivalvia Revenue (USD Million) By Country (2021-2032)
Figure 9. Mexico Bivalvia Revenue (USD Million) By Country (2021-2032)
Figure 10. Europe Bivalvia Revenue (USD Million) By Country (2021-2032)
Figure 11. Germany Bivalvia Revenue (USD Million) By Country (2021-2032)
Figure 12. France Bivalvia Revenue (USD Million) By Country (2021-2032)
Figure 13. United Kingdom Bivalvia Revenue (USD Million) By Country (2021-2032)
Figure 14. Spain Bivalvia Revenue (USD Million) By Country (2021-2032)
Figure 15. Italy Bivalvia Revenue (USD Million) By Country (2021-2032)
Figure 16. Russia Bivalvia Revenue (USD Million) By Country (2021-2032)
Figure 17. Rest of Europe Bivalvia Revenue (USD Million) By Country (2021-2032)
Figure 11. Asia Pacific Bivalvia Revenue (USD Million) By Country (2021-2032)
Figure 12. China Bivalvia Revenue (USD Million) By Country (2021-2032)
Figure 13. Japan Bivalvia Revenue (USD Million) By Country (2021-2032)
Figure 14. India Bivalvia Revenue (USD Million) By Country (2021-2032)
Figure 15. South Korea Bivalvia Revenue (USD Million) By Country (2021-2032)
Figure 16. Australia Bivalvia Revenue (USD Million) By Country (2021-2032)
Figure 17. South East Asia Bivalvia Revenue (USD Million) By Country (2021-2032)
Figure 18. South America Bivalvia Revenue (USD Million) By Country (2021-2032)
Figure 19. Brazil Bivalvia Revenue (USD Million) By Country (2021-2032)
Figure 20. Argentina Bivalvia Revenue (USD Million) By Country (2021-2032)
Figure 21. Rest of Asia Pacific Bivalvia Revenue (USD Million) By Country (2021-2032)
Figure 22. Middle East and Africa Bivalvia Revenue (USD Million) By Region (2021-2032)
Figure 23. Saudi Arabia Bivalvia Revenue (USD Million) By Region (2021-2032)
Figure 24. The UAE Bivalvia Revenue (USD Million) By Region (2021-2032)
Figure 25. Rest of Middle East Bivalvia Revenue (USD Million) By Region (2021-2032)
Figure 26. South Africa Bivalvia Revenue (USD Million) By Region (2021-2032)
Figure 27. Africa Bivalvia Revenue (USD Million) By Region (2021-2032)
Figure 28. North America Bivalvia Revenue (USD Million) By Type (2021-2032)
Figure 29. North America Bivalvia Revenue (USD Million) By Application (2021-2032)
Figure 30. North America Bivalvia Revenue (USD Million) By Product (2021-2032)
Figure 31. Europe Bivalvia Revenue (USD Million) By Type (2021-2032)
Figure 32. Europe Bivalvia Revenue (USD Million) By Application (2021-2032)
Figure 33. Europe Bivalvia Revenue (USD Million) By Product (2021-2032)
Figure 34. Asia Pacific Bivalvia Revenue (USD Million) By Type (2021-2032)
Figure 35. Asia Pacific Bivalvia Revenue (USD Million) By Application (2021-2032)
Figure 36. Asia Pacific Bivalvia Revenue (USD Million) By Product (2021-2032)
Figure 37. South America Bivalvia Revenue (USD Million) By Type (2021-2032)
Figure 38. South America Bivalvia Revenue (USD Million) By Application (2021-2032)
Figure 39. South America Bivalvia Revenue (USD Million) By Product (2021-2032)
Figure 40. Middle East and Africa Bivalvia Revenue (USD Million) By Type (2021-2032)
Figure 41. Middle East and Africa Bivalvia Revenue (USD Million) By Application (2021-2032)
Figure 42. Middle East and Africa Bivalvia Revenue (USD Million) By Product (2021-2032)
By Type
Clams
Oyster
Mussels
Scallops
Others
By Source
Wild harvest
Aquaculture farming
Countries Analyzed
North America (US, Canada, Mexico)
Europe (Germany, UK, France, Spain, Italy, Russia, Rest of Europe)
Asia Pacific (China, India, Japan, South Korea, Australia, South East Asia, Rest of Asia)
South America (Brazil, Argentina, Rest of South America)
Middle East and Africa (Saudi Arabia, UAE, Rest of Middle East, South Africa, Egypt, Rest of Africa)
