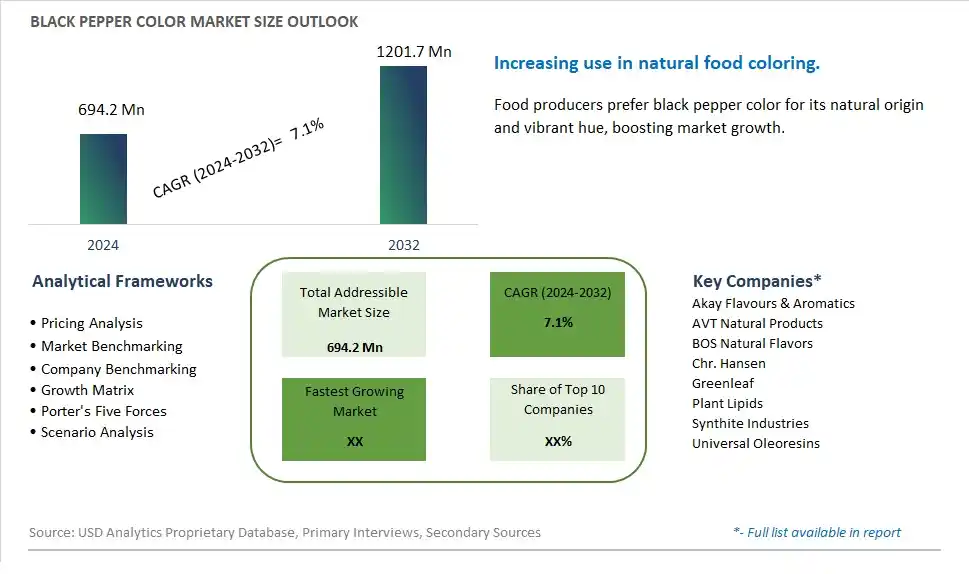
Global Black Pepper Color Market Size is valued at $694.2 Million in 2024 and is forecast to register a growth rate (CAGR) of 7.1% to reach $1201.7 Million by 2032.
The global Black Pepper Color Market Comprehensive Study analyzes and forecasts the market size across 6 regions and 24 countries for diverse segments -By Type (Black Pepper Essential Oil, Black Pepper Oleoresin, Others), By Application (Food & Beverage, Skin Care Products, Others)
An Introduction to Black Pepper Color Market
The Black Pepper Color market in 2024 is expanding steadily, driven by the demand for natural colorants in the food and beverage industry. Black pepper color, derived from black pepper, is used to impart a rich, dark hue to a variety of products, including sauces, seasonings, and processed foods. The market is supported by the growing trend towards clean-label and natural ingredients. Advances in extraction and stabilization technologies are improving the quality and application versatility of black pepper color. The market is also benefiting from the rising consumer interest in visually appealing and health-conscious food products that avoid synthetic additives.
Black Pepper Color Competitive Landscape
The market report analyses the leading companies in the industry including Akay Flavours & Aromatics, AVT Natural Products, BOS Natural Flavors, Chr. Hansen, Greenleaf, Plant Lipids, Synthite Industries, Universal Oleoresins, and Others.
Black Pepper Color Market Dynamics
Black Pepper Color Market Trend: Demand for Natural Food Colorants
The most prominent market trend for Black Pepper Color is the increasing demand for natural food colorants. With growing awareness of health and wellness, consumers are seeking food products made with natural ingredients, including colors derived from plants and spices. Black Pepper Color, extracted from black pepper, is a natural colorant that provides a deep, reddish-brown hue to food and beverage products. This trend reflects a shift towards clean label products and the avoidance of synthetic additives, driving the demand for natural color solutions like black pepper color.
Black Pepper Color Market Driver: Clean Label Movement and Ingredient Transparency
A key market driver for Black Pepper Color is the clean label movement and the emphasis on ingredient transparency. Consumers are scrutinizing product labels and prefer food and beverage products with simple, recognizable ingredients. Black pepper color aligns with this preference as a natural colorant that adds visual appeal to products without the need for artificial dyes or additives. The driver of the clean label movement and ingredient transparency motivates manufacturers to use natural colorants like black pepper color to meet consumer demands for cleaner, more natural product formulations.
Black Pepper Color Market Opportunity: Expansion into Natural Food and Beverage Segments
A potential opportunity within the Black Pepper Color market lies in expansion into natural food and beverage segments. Collaborating with food and beverage manufacturers can lead to the development of a range of products using black pepper color, such as sauces, marinades, beverages, and baked goods. Additionally, exploring applications in plant-based foods, organic products, and functional beverages can further diversify the market reach and cater to health-conscious consumers seeking natural and visually appealing options. By focusing on expansion into natural food and beverage segments, there are opportunities to capitalize on the clean label trend, differentiate offerings, and meet the demand for natural color solutions in the food industry.
Black Pepper Color Market Share Analysis: Black Pepper Oleoresin segment generated the highest revenue share in the industry
In the Black Pepper Color Market, the largest segment is Black Pepper Oleoresin. Black pepper oleoresin is a concentrated extract derived from black pepper (Piper nigrum) and is widely used in various industries for its color, flavor, and aroma properties. The fast growth of the Black Pepper Oleoresin segment can be attributed to several key factors. Firstly, black pepper oleoresin is extensively utilized in the food and beverage industry as a natural colorant and flavoring agent, particularly in sauces, marinades, seasonings, snacks, and processed foods. Its rich color and peppery taste contribute to the visual appeal and taste enhancement of food products, driving its demand among food manufacturers. Additionally, the cosmetic and personal care industry also utilizes black pepper oleoresin in products such as soaps, lotions, and perfumes for its aromatic qualities and potential skin benefits. Further, the pharmaceutical sector incorporates black pepper oleoresin in medicinal formulations and dietary supplements due to its bioactive compounds and potential health-promoting properties. As a result, the versatility, functionality, and wide-ranging applications of black pepper oleoresin contribute to its dominance as the largest segment in the Black Pepper Color Market, with continued growth expected in the coming years.
Black Pepper Color Market Share Analysis: Skin Care Products is the fastest growing segment over the forecast period to 2032
Within the Black Pepper Color Market, the Skin Care Products segment is anticipated to be the fastest growing up to 2032. The rapid growth of black pepper color in skin care products can be attributed to several key factors. Firstly, black pepper color, particularly derived from black pepper oleoresin, is known for its antioxidant properties, which help protect the skin from free radicals and environmental damage. This makes it a valuable ingredient in anti-aging creams, serums, and moisturizers, catering to the growing demand for natural and effective skincare solutions. Additionally, the antimicrobial and anti-inflammatory properties of black pepper color make it beneficial for addressing various skin concerns such as acne, inflammation, and blemishes. The increasing consumer preference for botanical and plant-based ingredients in skincare products further drives the demand for black pepper color in the cosmetics industry. Further, cosmetic manufacturers are innovating with black pepper color to create unique formulations that promote skin health, radiance, and youthfulness, contributing to the growth of the Skin Care Products segment in the Black Pepper Color Market. As a result, the Skin Care Products segment presents significant growth opportunities as skincare trends evolve towards natural, sustainable, and functional ingredients.
Black Pepper Color Market Segmentation
By Type
Black Pepper Essential Oil
Black Pepper Oleoresin
Others
By Application
Food & Beverage
Skin Care Products
Others
Countries Analyzed
North America (US, Canada, Mexico)
Europe (Germany, UK, France, Spain, Italy, Russia, Rest of Europe)
Asia Pacific (China, India, Japan, South Korea, Australia, South East Asia, Rest of Asia)
South America (Brazil, Argentina, Rest of South America)
Middle East and Africa (Saudi Arabia, UAE, Rest of Middle East, South Africa, Egypt, Rest of Africa)
Black Pepper Color Companies Profiled in the Study
Akay Flavours & Aromatics
AVT Natural Products
BOS Natural Flavors
Chr. Hansen
Greenleaf
Plant Lipids
Synthite Industries
Universal Oleoresins
*- List Not Exhaustive
Chapter 1. TABLE OF CONTENTS
Chapter 2. Introduction to Black Pepper Color Market
2.1. Market Overview
2.2. Key Statistics and Report Highlights
2.3. Scope of the Comprehensive Study
2.3.1. Market Definition
2.3.2 Countries and Regions Covered
2.3.3 Research Objective
2.3.4 Units, Currency, and Conversions
2.3.5 Industry Value Chain
2.4. Key Market Segments
2.5. Key Companies
2.6. Study Period
Chapter 3. Strategic Analysis Review
3.1. Black Pepper Color Pricing Analysis and Forecast
3.2. Porter’s Five Forces
3.3. Market Ecosystem
3.4. SWOT Analysis
3.5. Regulatory Scenario
3.3. Effects of Inflation, Russia-Ukraine War, moderating economic growth, and other macroeconomic factors
Chapter 4. Competitive Landscape
4.1. Market Share Analysis
4.1.1. Global Black Pepper Color Market Share by Company, 2023
4.1.2. Product Offerings of Leading Black Pepper Color Companies
4.2. Market Entropy
4.2.1. New Product Launches in the Industry
4.2.2. Mergers, Acquisitions, Joint ventures, and Partnerships
4.3. Key Strategies and Best Practices
Chapter 5. Global Market Projections: Best, Reference, and Low Case Scenarios
5.1. Growth Analysis- Case Scenario Definitions
5.2. Low Growth Case Scenario Forecasts
5.3. Reference Growth Case Scenario Forecasts
5.4. High Growth Case Scenario Forecasts
Chapter 6. Market Dynamics
6.1. Black Pepper Color Market Drivers
6.2. Black Pepper Color Market Challenges
6.6. Black Pepper Color Market Opportunities
6.4. Black Pepper Color Market Trends
Chapter 7. Global Black Pepper Color Market Outlook Trends
7.1. Global Black Pepper Color Revenue (USD Million) and CAGR (%) by Type (2021-2032)
7.2. Global Black Pepper Color Revenue (USD Million) and CAGR (%) by Application (2021-2032)
7.3. Global Black Pepper Color Revenue (USD Million) and CAGR (%) by Product (2021-2032)
By Type
Black Pepper Essential Oil
Black Pepper Oleoresin
Others
By Application
Food & Beverage
Skin Care Products
Others
Chapter 8. Global Black Pepper Color Regional Analysis and Outlook
8.1. Global Black Pepper Color Revenue (USD Million) By Regions (2021- 2032)
8.2. North America Black Pepper Color Revenue (USD Million) by Country (2021-2032)
8.2.1. United States Black Pepper Color Regional Analysis and Outlook
8.2.2. Canada Black Pepper Color Regional Analysis and Outlook
8.2.3. Mexico Black Pepper Color Regional Analysis and Outlook
8.3. Europe Black Pepper Color Revenue (USD Million), by Country (2021-2032)
8.3.1. Germany Black Pepper Color Regional Analysis and Outlook
8.3.2. France Black Pepper Color Regional Analysis and Outlook
8.3.3. United Kingdom Black Pepper Color Regional Analysis and Outlook
8.3.4. Spain Black Pepper Color Regional Analysis and Outlook
8.3.5. Italy Black Pepper Color Regional Analysis and Outlook
8.3.6. Russia Black Pepper Color Regional Analysis and Outlook
8.3.7. Rest of Europe Black Pepper Color Regional Analysis and Outlook
8.4. Asia Pacific Black Pepper Color Revenue (USD Million) by Country (2021-2032)
8.4.1. China Black Pepper Color Regional Analysis and Outlook
8.4.2. Japan Black Pepper Color Regional Analysis and Outlook
8.4.3. India Black Pepper Color Regional Analysis and Outlook
8.4.4. South Korea Black Pepper Color Regional Analysis and Outlook
8.4.5. Australia Black Pepper Color Regional Analysis and Outlook
8.4.6. South East Asia Black Pepper Color Regional Analysis and Outlook
8.4.7. Rest of Asia Pacific Black Pepper Color Regional Analysis and Outlook
8.5. South America Black Pepper Color Revenue (USD Million), by Country (2021-2032)
8.5.1. Brazil Black Pepper Color Regional Analysis and Outlook
8.5.2. Argentina Black Pepper Color Regional Analysis and Outlook
8.5.3. Rest of South America Black Pepper Color Regional Analysis and Outlook
8.6. Middle East and Africa Black Pepper Color Revenue (USD Million) by Country (2021-2032)
8.6.1. Middle East Black Pepper Color Regional Analysis and Outlook
8.6.2. Africa Black Pepper Color Regional Analysis and Outlook
Chapter 9. North America Black Pepper Color Analysis and Outlook
9.1. North America Black Pepper Color Revenue (USD Million) by Segments (2021-2032)
9.1.1. North America Black Pepper Color Revenue (USD Million) by Type (2021-2032)
9.1.2. North America Black Pepper Color Revenue (USD Million) by Application (2021-2032)
9.1.3. North America Black Pepper Color Revenue (USD Million) by Product (2021-2032)
By Type
Black Pepper Essential Oil
Black Pepper Oleoresin
Others
By Application
Food & Beverage
Skin Care Products
Others
Chapter 10. Europe Black Pepper Color Analysis and Outlook
10.1. Europe Black Pepper Color Revenue (USD Million), by Segments (USD Million) (2021-2032)
10.1.1. Europe Black Pepper Color Revenue (USD Million) by Type (2021-2032)
10.1.2. Europe Black Pepper Color Revenue (USD Million) by Application (2021-2032)
10.1.3. Europe Black Pepper Color Revenue (USD Million) by Product (2021-2032)
By Type
Black Pepper Essential Oil
Black Pepper Oleoresin
Others
By Application
Food & Beverage
Skin Care Products
Others
Chapter 11. Asia Pacific Black Pepper Color Analysis and Outlook
11.1. Asia Pacific Black Pepper Color Revenue (USD Million), and Revenue (USD Million) by Segments (2021-2032)
11.1.1. Asia Pacific Black Pepper Color Revenue (USD Million) by Type (2021-2032)
11.1.2. Asia Pacific Black Pepper Color Revenue (USD Million) by Application (2021-2032)
11.1.3. Asia Pacific Black Pepper Color Revenue (USD Million) by Product (2021-2032)
By Type
Black Pepper Essential Oil
Black Pepper Oleoresin
Others
By Application
Food & Beverage
Skin Care Products
Others
Chapter 12. South America Black Pepper Color Analysis and Outlook
12.1. South America Black Pepper Color Revenue (USD Million), by Segments (2021-2032)
12.1.1. South America Black Pepper Color Revenue (USD Million) by Type (2021-2032)
12.1.2. South America Black Pepper Color Revenue (USD Million) by Application (2021-2032)
12.1.3. South America Black Pepper Color Revenue (USD Million) by Product (2021-2032)
By Type
Black Pepper Essential Oil
Black Pepper Oleoresin
Others
By Application
Food & Beverage
Skin Care Products
Others
Chapter 13. Middle East and Africa Black Pepper Color Analysis and Outlook
13.1. Middle East and Africa Black Pepper Color Revenue (USD Million), by Segments (2021-2032)
13.1.1. Middle East and Africa Black Pepper Color Revenue (USD Million) by Type (2021-2032)
13.1.2. Middle East and Africa Black Pepper Color Revenue (USD Million) by Application (2021-2032)
13.1.3. Middle East and Africa Black Pepper Color Revenue (USD Million) by Product (2021-2032)
By Type
Black Pepper Essential Oil
Black Pepper Oleoresin
Others
By Application
Food & Beverage
Skin Care Products
Others
Chapter 14. Black Pepper Color Company Profiles
14.1 Business Overview
14.2 Product Profiles
14.3 SWOT Profiles
14.5 Recent Developments
14.6 Financial Profile
List of Companies
Akay Flavours & Aromatics
AVT Natural Products
BOS Natural Flavors
Chr. Hansen
Greenleaf
Plant Lipids
Synthite Industries
Universal Oleoresins
15. Methodology and Data Sources
15.1 Customization Offerings
15.2 Subscription Services
15.3 Related Reports
15.4 Publisher Expertise
LIST OF TABLES
Table 1 Market Segmentation Analysis
Table 2 Global Black Pepper Color Market Share of Leading Companies, 2023
Table 3 Product Offerings of Leading Companies
Table 4 Low Growth Scenario Forecasts
Table 5 Reference Case Growth Scenario
Table 6 High Growth Case Scenario
Table 7 Global Black Pepper Color Revenue (USD Million) And CAGR (%) By Type (2021-2032)
Table 8 Global Black Pepper Color Revenue (USD Million) And CAGR (%) By Application (2021-2032)
Table 9 Global Black Pepper Color Revenue (USD Million) And CAGR (%) By Product (2021-2032)
Table 10 Global Black Pepper Color Market Revenue (USD Million) By Regions (2021-2032)
Table 11 Global Black Pepper Color Market Share (%) By Regions (2021-2032)
Table 12 North America Black Pepper Color Revenue (USD Million) By Country (2021-2032)
Table 13 Europe Black Pepper Color Revenue (USD Million) By Country (2021-2032)
Table 14 Asia Pacific Black Pepper Color Revenue (USD Million) By Country (2021-2032)
Table 15 South America Black Pepper Color Revenue (USD Million) By Country (2021-2032)
Table 16 Middle East and Africa Black Pepper Color Revenue (USD Million) By Region (2021-2032)
Table 17 North America Black Pepper Color Revenue (USD Million) By Type (2021-2032)
Table 18 North America Black Pepper Color Revenue (USD Million) By Application (2021-2032)
Table 19 North America Black Pepper Color Revenue (USD Million) By Product (2021-2032)
Table 20 Europe Black Pepper Color Revenue (USD Million) By Type (2021-2032)
Table 21 Europe Black Pepper Color Revenue (USD Million) By Application (2021-2032)
Table 22 Europe Black Pepper Color Revenue (USD Million) By Product (2021-2032)
Table 23 Asia Pacific Black Pepper Color Revenue (USD Million) By Type (2021-2032)
Table 24 Asia Pacific Black Pepper Color Revenue (USD Million) By Application (2021-2032)
Table 25 Asia Pacific Black Pepper Color Revenue (USD Million) By Product (2021-2032)
Table 26 South America Black Pepper Color Revenue (USD Million) By Type (2021-2032)
Table 27 South America Black Pepper Color Revenue (USD Million) By Application (2021-2032)
Table 28 South America Black Pepper Color Revenue (USD Million) By Product (2021-2032)
Table 29 Middle East and Africa Black Pepper Color Revenue (USD Million) By Type (2021-2032)
Table 30 Middle East and Africa Black Pepper Color Revenue (USD Million) By Application (2021-2032)
Table 31 Middle East and Africa Black Pepper Color Revenue (USD Million) By Product (2021-2032)
LIST OF FIGURES
Figure 1. Market Scope
Figure 2. Pricing Forecasts Per Unit, 2023- 2032
Figure 3. Porter’s Five Forces
Figure 4. Global Black Pepper Color Market Revenue (USD Million) By Regions (2021-2032)
Figure 5. Global Black Pepper Color Market Share (%) By Regions (2023)
Figure 6. North America Black Pepper Color Revenue (USD Million) By Country (2021-2032)
Figure 7. United States Black Pepper Color Revenue (USD Million) By Country (2021-2032)
Figure 8. Canada Black Pepper Color Revenue (USD Million) By Country (2021-2032)
Figure 9. Mexico Black Pepper Color Revenue (USD Million) By Country (2021-2032)
Figure 10. Europe Black Pepper Color Revenue (USD Million) By Country (2021-2032)
Figure 11. Germany Black Pepper Color Revenue (USD Million) By Country (2021-2032)
Figure 12. France Black Pepper Color Revenue (USD Million) By Country (2021-2032)
Figure 13. United Kingdom Black Pepper Color Revenue (USD Million) By Country (2021-2032)
Figure 14. Spain Black Pepper Color Revenue (USD Million) By Country (2021-2032)
Figure 15. Italy Black Pepper Color Revenue (USD Million) By Country (2021-2032)
Figure 16. Russia Black Pepper Color Revenue (USD Million) By Country (2021-2032)
Figure 17. Rest of Europe Black Pepper Color Revenue (USD Million) By Country (2021-2032)
Figure 11. Asia Pacific Black Pepper Color Revenue (USD Million) By Country (2021-2032)
Figure 12. China Black Pepper Color Revenue (USD Million) By Country (2021-2032)
Figure 13. Japan Black Pepper Color Revenue (USD Million) By Country (2021-2032)
Figure 14. India Black Pepper Color Revenue (USD Million) By Country (2021-2032)
Figure 15. South Korea Black Pepper Color Revenue (USD Million) By Country (2021-2032)
Figure 16. Australia Black Pepper Color Revenue (USD Million) By Country (2021-2032)
Figure 17. South East Asia Black Pepper Color Revenue (USD Million) By Country (2021-2032)
Figure 18. South America Black Pepper Color Revenue (USD Million) By Country (2021-2032)
Figure 19. Brazil Black Pepper Color Revenue (USD Million) By Country (2021-2032)
Figure 20. Argentina Black Pepper Color Revenue (USD Million) By Country (2021-2032)
Figure 21. Rest of Asia Pacific Black Pepper Color Revenue (USD Million) By Country (2021-2032)
Figure 22. Middle East and Africa Black Pepper Color Revenue (USD Million) By Region (2021-2032)
Figure 23. Saudi Arabia Black Pepper Color Revenue (USD Million) By Region (2021-2032)
Figure 24. The UAE Black Pepper Color Revenue (USD Million) By Region (2021-2032)
Figure 25. Rest of Middle East Black Pepper Color Revenue (USD Million) By Region (2021-2032)
Figure 26. South Africa Black Pepper Color Revenue (USD Million) By Region (2021-2032)
Figure 27. Africa Black Pepper Color Revenue (USD Million) By Region (2021-2032)
Figure 28. North America Black Pepper Color Revenue (USD Million) By Type (2021-2032)
Figure 29. North America Black Pepper Color Revenue (USD Million) By Application (2021-2032)
Figure 30. North America Black Pepper Color Revenue (USD Million) By Product (2021-2032)
Figure 31. Europe Black Pepper Color Revenue (USD Million) By Type (2021-2032)
Figure 32. Europe Black Pepper Color Revenue (USD Million) By Application (2021-2032)
Figure 33. Europe Black Pepper Color Revenue (USD Million) By Product (2021-2032)
Figure 34. Asia Pacific Black Pepper Color Revenue (USD Million) By Type (2021-2032)
Figure 35. Asia Pacific Black Pepper Color Revenue (USD Million) By Application (2021-2032)
Figure 36. Asia Pacific Black Pepper Color Revenue (USD Million) By Product (2021-2032)
Figure 37. South America Black Pepper Color Revenue (USD Million) By Type (2021-2032)
Figure 38. South America Black Pepper Color Revenue (USD Million) By Application (2021-2032)
Figure 39. South America Black Pepper Color Revenue (USD Million) By Product (2021-2032)
Figure 40. Middle East and Africa Black Pepper Color Revenue (USD Million) By Type (2021-2032)
Figure 41. Middle East and Africa Black Pepper Color Revenue (USD Million) By Application (2021-2032)
Figure 42. Middle East and Africa Black Pepper Color Revenue (USD Million) By Product (2021-2032)
By Type
Black Pepper Essential Oil
Black Pepper Oleoresin
Others
By Application
Food & Beverage
Skin Care Products
Others
Countries Analyzed
North America (US, Canada, Mexico)
Europe (Germany, UK, France, Spain, Italy, Russia, Rest of Europe)
Asia Pacific (China, India, Japan, South Korea, Australia, South East Asia, Rest of Asia)
South America (Brazil, Argentina, Rest of South America)
Middle East and Africa (Saudi Arabia, UAE, Rest of Middle East, South Africa, Egypt, Rest of Africa)
