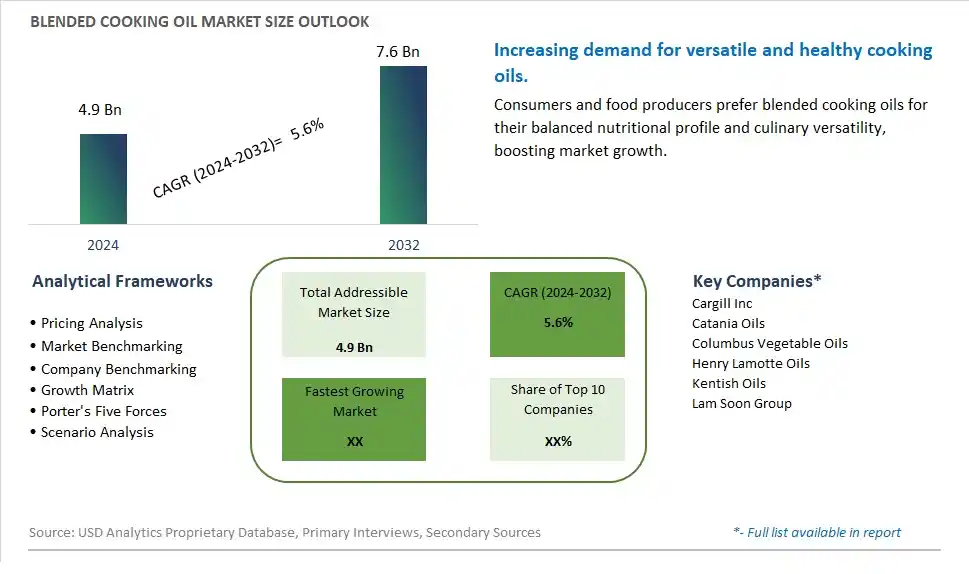
Global Blended Cooking Oil Market Size is valued at $4.9 Billion in 2024 and is forecast to register a growth rate (CAGR) of 5.6% to reach $7.6 Billion by 2032.
The global Blended Cooking Oil Market Comprehensive Study analyzes and forecasts the market size across 6 regions and 24 countries for diverse segments -By Type (GMO, Non-GMO), By Application (Household, Commercial)
An Introduction to Blended Cooking Oil Market
The Blended Cooking Oil market in 2024 is expanding rapidly, driven by the increasing consumer demand for versatile and health-conscious cooking oils. Blended cooking oils, which combine various oils such as olive, sunflower, and canola, are designed to offer a balanced nutritional profile, improved cooking performance, and enhanced flavor. The market is supported by the growing awareness of the health benefits of polyunsaturated and monounsaturated fats. Advances in oil blending and refining technologies are improving the quality and stability of these products. The market is also benefiting from the trend towards clean-label, non-GMO, and fortified oils that cater to diverse dietary preferences and health needs.
Blended Cooking Oil Competitive Landscape
The market report analyses the leading companies in the industry including Cargill Inc, Catania Oils, Columbus Vegetable Oils, Henry Lamotte Oils, Kentish Oils, Lam Soon Group, and Others.
Blended Cooking Oil Market Dynamics
Blended Cooking Oil Market Trend: Shift Towards Healthier and Versatile Cooking Oils
The most prominent market trend for Blended Cooking Oil is the shift towards healthier and versatile cooking oils. Consumers are increasingly conscious of their dietary choices and are looking for cooking oils that offer health benefits while also being suitable for various cooking methods. Blended Cooking Oil, which combines different types of oils such as olive oil, sunflower oil, and canola oil, caters to this trend by providing a balance of flavor, nutrition, and cooking versatility.
Blended Cooking Oil Market Driver: Consumer Demand for Cooking Convenience and Flavor Diversity
A key market driver for Blended Cooking Oil is the consumer demand for cooking convenience and flavor diversity. With busy lifestyles, consumers seek cooking oils that are easy to use, offer consistent performance across different cooking techniques, and enhance the flavor of their dishes. Blended Cooking Oil addresses these needs by providing a ready-to-use option that combines the desirable characteristics of multiple oils, such as high smoke point, neutral flavor, and nutritional benefits, driving its popularity among home cooks and professional chefs alike.
Blended Cooking Oil Market Opportunity: Innovation in Healthier Oil Blends and Packaging
A potential opportunity within the Blended Cooking Oil market lies in innovation in healthier oil blends and packaging. Manufacturers can explore creating blends that incorporate oils known for specific health benefits, such as omega-3-rich oils or oils with high antioxidant content. Additionally, innovative packaging solutions such as easy-to-pour bottles, resealable packs, and portion-controlled options can enhance convenience and appeal to consumers looking for practical and sustainable packaging choices. By focusing on healthier blends and innovative packaging, there are opportunities to capture market share, meet consumer preferences, and drive growth in the Blended Cooking Oil segment.
Blended Cooking Oil Market Share Analysis: Non-GMO segment generated the highest revenue share in the industry
In the Blended Cooking Oil Market, the largest segment is Non-GMO blended cooking oil. Non-GMO blended cooking oil refers to cooking oil blends that are made from ingredients that have not been genetically modified. The fast growth of the Non-GMO segment can be attributed to several factors. Firstly, there is a growing consumer preference for non-genetically modified organisms (GMOs) in food products due to concerns about health, environmental sustainability, and transparency in food labeling. Non-GMO cooking oils are perceived as more natural and wholesome, appealing to health-conscious consumers who prioritize clean and transparent food choices. Additionally, non-GMO cooking oils are often marketed as being free from artificial additives, chemicals, and pesticides, further enhancing their appeal among consumers seeking healthier cooking options. Further, the demand for non-GMO cooking oils is driven by increased awareness and education about GMOs and their potential impacts on health and the environment. As a result, the Non-GMO segment dominates the Blended Cooking Oil Market, reflecting consumer preferences for natural, transparent, and sustainable food products.
Blended Cooking Oil Market Share Analysis: Commercial is the fastest growing segment over the forecast period to 2032
In the Blended Cooking Oil Market, the Commercial segment is anticipated to be the fastest growing to 2032. The rapid growth of the Commercial segment can be attributed to several key factors. Firstly, the increasing demand for convenience and ready-to-use cooking solutions in commercial food establishments such as restaurants, hotels, catering services, and foodservice outlets drives the adoption of blended cooking oils. Commercial kitchens and foodservice operators prefer blended cooking oils due to their versatility, consistent quality, and cost-effectiveness compared to single-source oils. Blended cooking oils are often formulated to have desirable cooking properties such as high smoke points, neutral flavors, and balanced fatty acid profiles, making them suitable for a wide range of culinary applications including frying, sautéing, baking, and salad dressings. Additionally, the growth of the foodservice industry, evolving consumer tastes, and the expansion of dining-out culture contribute to the increasing use of blended cooking oils in commercial settings. Further, the trend towards healthier cooking practices, sustainability, and reduced food waste drives the demand for blended cooking oils with attributes such as lower saturated fats, trans-fat-free formulations, and recyclable packaging options in commercial kitchens. As a result, the Commercial segment presents significant growth opportunities in the Blended Cooking Oil Market as foodservice providers seek efficient and high-quality cooking oil solutions to meet the demands of their customers and enhance culinary experiences.
Blended Cooking Oil Market Segmentation
By Type
GMO
Non-GMO
By Application
Household
Commercial
Countries Analyzed
North America (US, Canada, Mexico)
Europe (Germany, UK, France, Spain, Italy, Russia, Rest of Europe)
Asia Pacific (China, India, Japan, South Korea, Australia, South East Asia, Rest of Asia)
South America (Brazil, Argentina, Rest of South America)
Middle East and Africa (Saudi Arabia, UAE, Rest of Middle East, South Africa, Egypt, Rest of Africa)
Blended Cooking Oil Companies Profiled in the Study
Cargill Inc
Catania Oils
Columbus Vegetable Oils
Henry Lamotte Oils
Kentish Oils
Lam Soon Group
*- List Not Exhaustive
Chapter 1. TABLE OF CONTENTS
Chapter 2. Introduction to Blended Cooking Oil Market
2.1. Market Overview
2.2. Key Statistics and Report Highlights
2.3. Scope of the Comprehensive Study
2.3.1. Market Definition
2.3.2 Countries and Regions Covered
2.3.3 Research Objective
2.3.4 Units, Currency, and Conversions
2.3.5 Industry Value Chain
2.4. Key Market Segments
2.5. Key Companies
2.6. Study Period
Chapter 3. Strategic Analysis Review
3.1. Blended Cooking Oil Pricing Analysis and Forecast
3.2. Porter’s Five Forces
3.3. Market Ecosystem
3.4. SWOT Analysis
3.5. Regulatory Scenario
3.3. Effects of Inflation, Russia-Ukraine War, moderating economic growth, and other macroeconomic factors
Chapter 4. Competitive Landscape
4.1. Market Share Analysis
4.1.1. Global Blended Cooking Oil Market Share by Company, 2023
4.1.2. Product Offerings of Leading Blended Cooking Oil Companies
4.2. Market Entropy
4.2.1. New Product Launches in the Industry
4.2.2. Mergers, Acquisitions, Joint ventures, and Partnerships
4.3. Key Strategies and Best Practices
Chapter 5. Global Market Projections: Best, Reference, and Low Case Scenarios
5.1. Growth Analysis- Case Scenario Definitions
5.2. Low Growth Case Scenario Forecasts
5.3. Reference Growth Case Scenario Forecasts
5.4. High Growth Case Scenario Forecasts
Chapter 6. Market Dynamics
6.1. Blended Cooking Oil Market Drivers
6.2. Blended Cooking Oil Market Challenges
6.6. Blended Cooking Oil Market Opportunities
6.4. Blended Cooking Oil Market Trends
Chapter 7. Global Blended Cooking Oil Market Outlook Trends
7.1. Global Blended Cooking Oil Revenue (USD Million) and CAGR (%) by Type (2021-2032)
7.2. Global Blended Cooking Oil Revenue (USD Million) and CAGR (%) by Application (2021-2032)
7.3. Global Blended Cooking Oil Revenue (USD Million) and CAGR (%) by Product (2021-2032)
By Type
GMO
Non-GMO
By Application
Household
Commercial
Chapter 8. Global Blended Cooking Oil Regional Analysis and Outlook
8.1. Global Blended Cooking Oil Revenue (USD Million) By Regions (2021- 2032)
8.2. North America Blended Cooking Oil Revenue (USD Million) by Country (2021-2032)
8.2.1. United States Blended Cooking Oil Regional Analysis and Outlook
8.2.2. Canada Blended Cooking Oil Regional Analysis and Outlook
8.2.3. Mexico Blended Cooking Oil Regional Analysis and Outlook
8.3. Europe Blended Cooking Oil Revenue (USD Million), by Country (2021-2032)
8.3.1. Germany Blended Cooking Oil Regional Analysis and Outlook
8.3.2. France Blended Cooking Oil Regional Analysis and Outlook
8.3.3. United Kingdom Blended Cooking Oil Regional Analysis and Outlook
8.3.4. Spain Blended Cooking Oil Regional Analysis and Outlook
8.3.5. Italy Blended Cooking Oil Regional Analysis and Outlook
8.3.6. Russia Blended Cooking Oil Regional Analysis and Outlook
8.3.7. Rest of Europe Blended Cooking Oil Regional Analysis and Outlook
8.4. Asia Pacific Blended Cooking Oil Revenue (USD Million) by Country (2021-2032)
8.4.1. China Blended Cooking Oil Regional Analysis and Outlook
8.4.2. Japan Blended Cooking Oil Regional Analysis and Outlook
8.4.3. India Blended Cooking Oil Regional Analysis and Outlook
8.4.4. South Korea Blended Cooking Oil Regional Analysis and Outlook
8.4.5. Australia Blended Cooking Oil Regional Analysis and Outlook
8.4.6. South East Asia Blended Cooking Oil Regional Analysis and Outlook
8.4.7. Rest of Asia Pacific Blended Cooking Oil Regional Analysis and Outlook
8.5. South America Blended Cooking Oil Revenue (USD Million), by Country (2021-2032)
8.5.1. Brazil Blended Cooking Oil Regional Analysis and Outlook
8.5.2. Argentina Blended Cooking Oil Regional Analysis and Outlook
8.5.3. Rest of South America Blended Cooking Oil Regional Analysis and Outlook
8.6. Middle East and Africa Blended Cooking Oil Revenue (USD Million) by Country (2021-2032)
8.6.1. Middle East Blended Cooking Oil Regional Analysis and Outlook
8.6.2. Africa Blended Cooking Oil Regional Analysis and Outlook
Chapter 9. North America Blended Cooking Oil Analysis and Outlook
9.1. North America Blended Cooking Oil Revenue (USD Million) by Segments (2021-2032)
9.1.1. North America Blended Cooking Oil Revenue (USD Million) by Type (2021-2032)
9.1.2. North America Blended Cooking Oil Revenue (USD Million) by Application (2021-2032)
9.1.3. North America Blended Cooking Oil Revenue (USD Million) by Product (2021-2032)
By Type
GMO
Non-GMO
By Application
Household
Commercial
Chapter 10. Europe Blended Cooking Oil Analysis and Outlook
10.1. Europe Blended Cooking Oil Revenue (USD Million), by Segments (USD Million) (2021-2032)
10.1.1. Europe Blended Cooking Oil Revenue (USD Million) by Type (2021-2032)
10.1.2. Europe Blended Cooking Oil Revenue (USD Million) by Application (2021-2032)
10.1.3. Europe Blended Cooking Oil Revenue (USD Million) by Product (2021-2032)
By Type
GMO
Non-GMO
By Application
Household
Commercial
Chapter 11. Asia Pacific Blended Cooking Oil Analysis and Outlook
11.1. Asia Pacific Blended Cooking Oil Revenue (USD Million), and Revenue (USD Million) by Segments (2021-2032)
11.1.1. Asia Pacific Blended Cooking Oil Revenue (USD Million) by Type (2021-2032)
11.1.2. Asia Pacific Blended Cooking Oil Revenue (USD Million) by Application (2021-2032)
11.1.3. Asia Pacific Blended Cooking Oil Revenue (USD Million) by Product (2021-2032)
By Type
GMO
Non-GMO
By Application
Household
Commercial
Chapter 12. South America Blended Cooking Oil Analysis and Outlook
12.1. South America Blended Cooking Oil Revenue (USD Million), by Segments (2021-2032)
12.1.1. South America Blended Cooking Oil Revenue (USD Million) by Type (2021-2032)
12.1.2. South America Blended Cooking Oil Revenue (USD Million) by Application (2021-2032)
12.1.3. South America Blended Cooking Oil Revenue (USD Million) by Product (2021-2032)
By Type
GMO
Non-GMO
By Application
Household
Commercial
Chapter 13. Middle East and Africa Blended Cooking Oil Analysis and Outlook
13.1. Middle East and Africa Blended Cooking Oil Revenue (USD Million), by Segments (2021-2032)
13.1.1. Middle East and Africa Blended Cooking Oil Revenue (USD Million) by Type (2021-2032)
13.1.2. Middle East and Africa Blended Cooking Oil Revenue (USD Million) by Application (2021-2032)
13.1.3. Middle East and Africa Blended Cooking Oil Revenue (USD Million) by Product (2021-2032)
By Type
GMO
Non-GMO
By Application
Household
Commercial
Chapter 14. Blended Cooking Oil Company Profiles
14.1 Business Overview
14.2 Product Profiles
14.3 SWOT Profiles
14.5 Recent Developments
14.6 Financial Profile
List of Companies
Cargill Inc
Catania Oils
Columbus Vegetable Oils
Henry Lamotte Oils
Kentish Oils
Lam Soon Group
15. Methodology and Data Sources
15.1 Customization Offerings
15.2 Subscription Services
15.3 Related Reports
15.4 Publisher Expertise
LIST OF TABLES
Table 1 Market Segmentation Analysis
Table 2 Global Blended Cooking Oil Market Share of Leading Companies, 2023
Table 3 Product Offerings of Leading Companies
Table 4 Low Growth Scenario Forecasts
Table 5 Reference Case Growth Scenario
Table 6 High Growth Case Scenario
Table 7 Global Blended Cooking Oil Revenue (USD Million) And CAGR (%) By Type (2021-2032)
Table 8 Global Blended Cooking Oil Revenue (USD Million) And CAGR (%) By Application (2021-2032)
Table 9 Global Blended Cooking Oil Revenue (USD Million) And CAGR (%) By Product (2021-2032)
Table 10 Global Blended Cooking Oil Market Revenue (USD Million) By Regions (2021-2032)
Table 11 Global Blended Cooking Oil Market Share (%) By Regions (2021-2032)
Table 12 North America Blended Cooking Oil Revenue (USD Million) By Country (2021-2032)
Table 13 Europe Blended Cooking Oil Revenue (USD Million) By Country (2021-2032)
Table 14 Asia Pacific Blended Cooking Oil Revenue (USD Million) By Country (2021-2032)
Table 15 South America Blended Cooking Oil Revenue (USD Million) By Country (2021-2032)
Table 16 Middle East and Africa Blended Cooking Oil Revenue (USD Million) By Region (2021-2032)
Table 17 North America Blended Cooking Oil Revenue (USD Million) By Type (2021-2032)
Table 18 North America Blended Cooking Oil Revenue (USD Million) By Application (2021-2032)
Table 19 North America Blended Cooking Oil Revenue (USD Million) By Product (2021-2032)
Table 20 Europe Blended Cooking Oil Revenue (USD Million) By Type (2021-2032)
Table 21 Europe Blended Cooking Oil Revenue (USD Million) By Application (2021-2032)
Table 22 Europe Blended Cooking Oil Revenue (USD Million) By Product (2021-2032)
Table 23 Asia Pacific Blended Cooking Oil Revenue (USD Million) By Type (2021-2032)
Table 24 Asia Pacific Blended Cooking Oil Revenue (USD Million) By Application (2021-2032)
Table 25 Asia Pacific Blended Cooking Oil Revenue (USD Million) By Product (2021-2032)
Table 26 South America Blended Cooking Oil Revenue (USD Million) By Type (2021-2032)
Table 27 South America Blended Cooking Oil Revenue (USD Million) By Application (2021-2032)
Table 28 South America Blended Cooking Oil Revenue (USD Million) By Product (2021-2032)
Table 29 Middle East and Africa Blended Cooking Oil Revenue (USD Million) By Type (2021-2032)
Table 30 Middle East and Africa Blended Cooking Oil Revenue (USD Million) By Application (2021-2032)
Table 31 Middle East and Africa Blended Cooking Oil Revenue (USD Million) By Product (2021-2032)
LIST OF FIGURES
Figure 1. Market Scope
Figure 2. Pricing Forecasts Per Unit, 2023- 2032
Figure 3. Porter’s Five Forces
Figure 4. Global Blended Cooking Oil Market Revenue (USD Million) By Regions (2021-2032)
Figure 5. Global Blended Cooking Oil Market Share (%) By Regions (2023)
Figure 6. North America Blended Cooking Oil Revenue (USD Million) By Country (2021-2032)
Figure 7. United States Blended Cooking Oil Revenue (USD Million) By Country (2021-2032)
Figure 8. Canada Blended Cooking Oil Revenue (USD Million) By Country (2021-2032)
Figure 9. Mexico Blended Cooking Oil Revenue (USD Million) By Country (2021-2032)
Figure 10. Europe Blended Cooking Oil Revenue (USD Million) By Country (2021-2032)
Figure 11. Germany Blended Cooking Oil Revenue (USD Million) By Country (2021-2032)
Figure 12. France Blended Cooking Oil Revenue (USD Million) By Country (2021-2032)
Figure 13. United Kingdom Blended Cooking Oil Revenue (USD Million) By Country (2021-2032)
Figure 14. Spain Blended Cooking Oil Revenue (USD Million) By Country (2021-2032)
Figure 15. Italy Blended Cooking Oil Revenue (USD Million) By Country (2021-2032)
Figure 16. Russia Blended Cooking Oil Revenue (USD Million) By Country (2021-2032)
Figure 17. Rest of Europe Blended Cooking Oil Revenue (USD Million) By Country (2021-2032)
Figure 11. Asia Pacific Blended Cooking Oil Revenue (USD Million) By Country (2021-2032)
Figure 12. China Blended Cooking Oil Revenue (USD Million) By Country (2021-2032)
Figure 13. Japan Blended Cooking Oil Revenue (USD Million) By Country (2021-2032)
Figure 14. India Blended Cooking Oil Revenue (USD Million) By Country (2021-2032)
Figure 15. South Korea Blended Cooking Oil Revenue (USD Million) By Country (2021-2032)
Figure 16. Australia Blended Cooking Oil Revenue (USD Million) By Country (2021-2032)
Figure 17. South East Asia Blended Cooking Oil Revenue (USD Million) By Country (2021-2032)
Figure 18. South America Blended Cooking Oil Revenue (USD Million) By Country (2021-2032)
Figure 19. Brazil Blended Cooking Oil Revenue (USD Million) By Country (2021-2032)
Figure 20. Argentina Blended Cooking Oil Revenue (USD Million) By Country (2021-2032)
Figure 21. Rest of Asia Pacific Blended Cooking Oil Revenue (USD Million) By Country (2021-2032)
Figure 22. Middle East and Africa Blended Cooking Oil Revenue (USD Million) By Region (2021-2032)
Figure 23. Saudi Arabia Blended Cooking Oil Revenue (USD Million) By Region (2021-2032)
Figure 24. The UAE Blended Cooking Oil Revenue (USD Million) By Region (2021-2032)
Figure 25. Rest of Middle East Blended Cooking Oil Revenue (USD Million) By Region (2021-2032)
Figure 26. South Africa Blended Cooking Oil Revenue (USD Million) By Region (2021-2032)
Figure 27. Africa Blended Cooking Oil Revenue (USD Million) By Region (2021-2032)
Figure 28. North America Blended Cooking Oil Revenue (USD Million) By Type (2021-2032)
Figure 29. North America Blended Cooking Oil Revenue (USD Million) By Application (2021-2032)
Figure 30. North America Blended Cooking Oil Revenue (USD Million) By Product (2021-2032)
Figure 31. Europe Blended Cooking Oil Revenue (USD Million) By Type (2021-2032)
Figure 32. Europe Blended Cooking Oil Revenue (USD Million) By Application (2021-2032)
Figure 33. Europe Blended Cooking Oil Revenue (USD Million) By Product (2021-2032)
Figure 34. Asia Pacific Blended Cooking Oil Revenue (USD Million) By Type (2021-2032)
Figure 35. Asia Pacific Blended Cooking Oil Revenue (USD Million) By Application (2021-2032)
Figure 36. Asia Pacific Blended Cooking Oil Revenue (USD Million) By Product (2021-2032)
Figure 37. South America Blended Cooking Oil Revenue (USD Million) By Type (2021-2032)
Figure 38. South America Blended Cooking Oil Revenue (USD Million) By Application (2021-2032)
Figure 39. South America Blended Cooking Oil Revenue (USD Million) By Product (2021-2032)
Figure 40. Middle East and Africa Blended Cooking Oil Revenue (USD Million) By Type (2021-2032)
Figure 41. Middle East and Africa Blended Cooking Oil Revenue (USD Million) By Application (2021-2032)
Figure 42. Middle East and Africa Blended Cooking Oil Revenue (USD Million) By Product (2021-2032)
By Type
GMO
Non-GMO
By Application
Household
Commercial
Countries Analyzed
North America (US, Canada, Mexico)
Europe (Germany, UK, France, Spain, Italy, Russia, Rest of Europe)
Asia Pacific (China, India, Japan, South Korea, Australia, South East Asia, Rest of Asia)
South America (Brazil, Argentina, Rest of South America)
Middle East and Africa (Saudi Arabia, UAE, Rest of Middle East, South Africa, Egypt, Rest of Africa)
