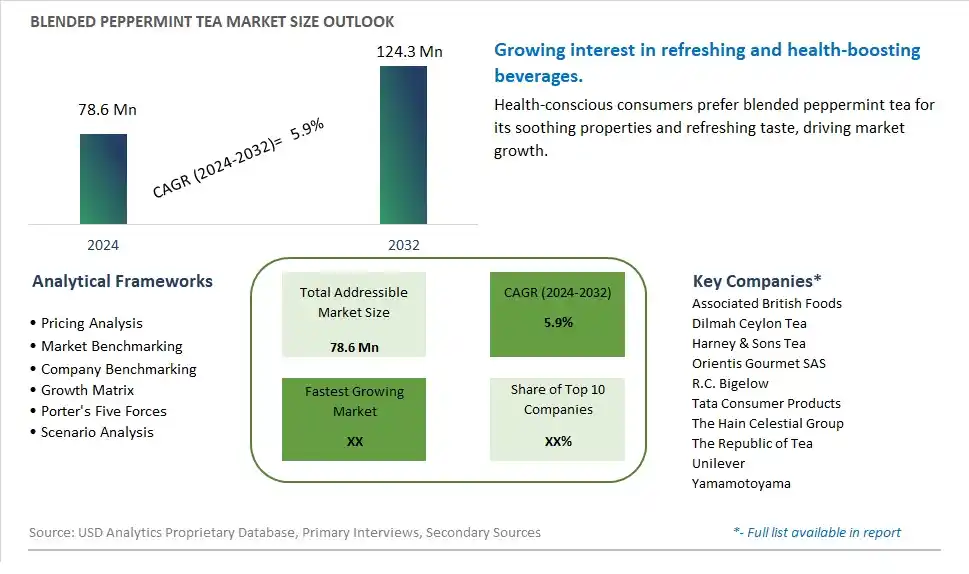
Global Blended Peppermint Tea Market Size is valued at $78.6 Million in 2024 and is forecast to register a growth rate (CAGR) of 5.9% to reach $124.3 Million by 2032.
The global Blended Peppermint Tea Market Comprehensive Study analyzes and forecasts the market size across 6 regions and 24 countries for diverse segments -By Type (Blended Fruits, Blended Spices, Others), By Sales Channel (Online, Offline)
An Introduction to Blended Peppermint Tea Market
In 2024, the Blended Peppermint Tea market is witnessing robust growth, driven by the increasing popularity of herbal and functional teas. Blended peppermint tea, which combines peppermint with other herbs and botanicals, is valued for its refreshing taste and health benefits, including digestive support and stress relief. The market is supported by the growing consumer interest in natural and caffeine-free beverages. Advances in tea blending and packaging technologies are enhancing the flavor, aroma, and shelf life of blended peppermint tea. The market is also benefiting from the trend towards wellness and holistic health, as consumers seek beverages that offer both therapeutic and sensory benefits.
Blended Peppermint Tea Competitive Landscape
The market report analyses the leading companies in the industry including Associated British Foods, Dilmah Ceylon Tea, Harney & Sons Tea, Orientis Gourmet SAS, R.C. Bigelow, Tata Consumer Products, The Hain Celestial Group, The Republic of Tea, Unilever, Yamamotoyama, and Others.
Blended Peppermint Tea Market Dynamics
Blended Peppermint Tea Market Trend: Growing Demand for Herbal and Functional Teas
The most prominent market trend for Blended Peppermint Tea is the growing demand for herbal and functional teas. Consumers are increasingly seeking beverages that offer not only refreshment but also health benefits. Blended Peppermint Tea, which combines peppermint with other herbs or flavors, aligns with this trend by providing a refreshing and functional beverage option that supports digestive health, relaxation, and overall well-being.
Blended Peppermint Tea Market Driver: Health and Wellness Consciousness Among Consumers
A key market driver for Blended Peppermint Tea is the rising health and wellness consciousness among consumers. Peppermint is known for its digestive properties, soothing effects, and pleasant taste, making it a popular choice among individuals looking for natural remedies and wellness-enhancing beverages. The driver of health-conscious consumer preferences fuels the demand for Blended Peppermint Tea as a flavorful and beneficial option in the tea market.
Blended Peppermint Tea Market Opportunity: Product Innovation and Diversification
A potential opportunity within the Blended Peppermint Tea market lies in product innovation and diversification. Manufacturers can explore creating new blends that combine peppermint with complementary herbs, fruits, or botanicals to offer unique flavor profiles and enhanced health benefits. Additionally, opportunities exist to develop specialty blends targeting specific consumer needs, such as relaxation blends, digestion support blends, or blends with added functional ingredients like antioxidants or vitamins. By focusing on product innovation and diversification, there are opportunities to attract new consumers, expand market reach, and differentiate Blended Peppermint Tea offerings in a competitive market landscape.
Blended Peppermint Tea Market Share Analysis: Blended Fruits segment generated the highest revenue share in the industry
In the Blended Peppermint Tea Market, the largest segment is Blended Fruits. Blended fruits peppermint tea refers to teas that combine peppermint leaves with various fruits such as berries, citrus fruits, apples, or tropical fruits. This segment experiences significant popularity due to several factors. Firstly, the blend of peppermint with fruits creates a refreshing and flavorful tea experience that appeals to a wide range of consumers. The fruity notes complement the cooling and invigorating properties of peppermint, resulting in a harmonious and delightful taste profile. Additionally, blended fruits peppermint tea offers a natural source of vitamins, antioxidants, and minerals from the fruits and peppermint leaves, making it a popular choice among health-conscious individuals seeking functional beverages. The blend of fruits also adds a touch of sweetness and complexity to the tea, making it enjoyable both hot and cold, suitable for all seasons. Further, the versatility of blended fruits peppermint tea allows for creative combinations and flavor innovations, catering to diverse consumer preferences and market trends. As a result, the Blended Fruits segment dominates the Blended Peppermint Tea Market, capturing the interest of tea enthusiasts and health-conscious consumers looking for refreshing and flavorful beverage options.
Blended Peppermint Tea Market Share Analysis: Online is the fastest growing segment over the forecast period to 2032
In the Blended Peppermint Tea Market, the Online sales channel segment is expected to be the fastest growing to 2032. The rapid growth of online sales channels for blended peppermint tea can be attributed to several key factors. Firstly, the increasing digitalization of retail and the rise of e-commerce platforms have made it more convenient and accessible for consumers to purchase a wide variety of tea products online, including blended peppermint tea. Online channels offer convenience, 24/7 availability, and a wider selection of products compared to traditional brick-and-mortar stores. Additionally, the Past few yearshas accelerated the shift towards online shopping as consumers prioritize safety, contactless transactions, and home delivery options. Further, online retailers often offer special promotions, discounts, and loyalty programs that attract and retain customers interested in blended peppermint tea. Furthermore, the digital landscape allows for targeted marketing, personalized recommendations, and customer engagement strategies that enhance the online shopping experience for tea enthusiasts. As a result, the Online sales channel segment presents significant growth opportunities in the Blended Peppermint Tea Market as consumers increasingly embrace digital platforms for their shopping needs and preferences.
Blended Peppermint Tea Market Segmentation
By Type
Blended Fruits
Blended Spices
Others
By Sales Channel
Online
Offline
Countries Analyzed
North America (US, Canada, Mexico)
Europe (Germany, UK, France, Spain, Italy, Russia, Rest of Europe)
Asia Pacific (China, India, Japan, South Korea, Australia, South East Asia, Rest of Asia)
South America (Brazil, Argentina, Rest of South America)
Middle East and Africa (Saudi Arabia, UAE, Rest of Middle East, South Africa, Egypt, Rest of Africa)
Blended Peppermint Tea Companies Profiled in the Study
Associated British Foods
Dilmah Ceylon Tea
Harney & Sons Tea
Orientis Gourmet SAS
R.C. Bigelow
Tata Consumer Products
The Hain Celestial Group
The Republic of Tea
Unilever
Yamamotoyama
*- List Not Exhaustive
Chapter 1. TABLE OF CONTENTS
Chapter 2. Introduction to Blended Peppermint Tea Market
2.1. Market Overview
2.2. Key Statistics and Report Highlights
2.3. Scope of the Comprehensive Study
2.3.1. Market Definition
2.3.2 Countries and Regions Covered
2.3.3 Research Objective
2.3.4 Units, Currency, and Conversions
2.3.5 Industry Value Chain
2.4. Key Market Segments
2.5. Key Companies
2.6. Study Period
Chapter 3. Strategic Analysis Review
3.1. Blended Peppermint Tea Pricing Analysis and Forecast
3.2. Porter’s Five Forces
3.3. Market Ecosystem
3.4. SWOT Analysis
3.5. Regulatory Scenario
3.3. Effects of Inflation, Russia-Ukraine War, moderating economic growth, and other macroeconomic factors
Chapter 4. Competitive Landscape
4.1. Market Share Analysis
4.1.1. Global Blended Peppermint Tea Market Share by Company, 2023
4.1.2. Product Offerings of Leading Blended Peppermint Tea Companies
4.2. Market Entropy
4.2.1. New Product Launches in the Industry
4.2.2. Mergers, Acquisitions, Joint ventures, and Partnerships
4.3. Key Strategies and Best Practices
Chapter 5. Global Market Projections: Best, Reference, and Low Case Scenarios
5.1. Growth Analysis- Case Scenario Definitions
5.2. Low Growth Case Scenario Forecasts
5.3. Reference Growth Case Scenario Forecasts
5.4. High Growth Case Scenario Forecasts
Chapter 6. Market Dynamics
6.1. Blended Peppermint Tea Market Drivers
6.2. Blended Peppermint Tea Market Challenges
6.6. Blended Peppermint Tea Market Opportunities
6.4. Blended Peppermint Tea Market Trends
Chapter 7. Global Blended Peppermint Tea Market Outlook Trends
7.1. Global Blended Peppermint Tea Revenue (USD Million) and CAGR (%) by Type (2021-2032)
7.2. Global Blended Peppermint Tea Revenue (USD Million) and CAGR (%) by Application (2021-2032)
7.3. Global Blended Peppermint Tea Revenue (USD Million) and CAGR (%) by Product (2021-2032)
By Type
Blended Fruits
Blended Spices
Others
By Sales Channel
Online
Offline
Chapter 8. Global Blended Peppermint Tea Regional Analysis and Outlook
8.1. Global Blended Peppermint Tea Revenue (USD Million) By Regions (2021- 2032)
8.2. North America Blended Peppermint Tea Revenue (USD Million) by Country (2021-2032)
8.2.1. United States Blended Peppermint Tea Regional Analysis and Outlook
8.2.2. Canada Blended Peppermint Tea Regional Analysis and Outlook
8.2.3. Mexico Blended Peppermint Tea Regional Analysis and Outlook
8.3. Europe Blended Peppermint Tea Revenue (USD Million), by Country (2021-2032)
8.3.1. Germany Blended Peppermint Tea Regional Analysis and Outlook
8.3.2. France Blended Peppermint Tea Regional Analysis and Outlook
8.3.3. United Kingdom Blended Peppermint Tea Regional Analysis and Outlook
8.3.4. Spain Blended Peppermint Tea Regional Analysis and Outlook
8.3.5. Italy Blended Peppermint Tea Regional Analysis and Outlook
8.3.6. Russia Blended Peppermint Tea Regional Analysis and Outlook
8.3.7. Rest of Europe Blended Peppermint Tea Regional Analysis and Outlook
8.4. Asia Pacific Blended Peppermint Tea Revenue (USD Million) by Country (2021-2032)
8.4.1. China Blended Peppermint Tea Regional Analysis and Outlook
8.4.2. Japan Blended Peppermint Tea Regional Analysis and Outlook
8.4.3. India Blended Peppermint Tea Regional Analysis and Outlook
8.4.4. South Korea Blended Peppermint Tea Regional Analysis and Outlook
8.4.5. Australia Blended Peppermint Tea Regional Analysis and Outlook
8.4.6. South East Asia Blended Peppermint Tea Regional Analysis and Outlook
8.4.7. Rest of Asia Pacific Blended Peppermint Tea Regional Analysis and Outlook
8.5. South America Blended Peppermint Tea Revenue (USD Million), by Country (2021-2032)
8.5.1. Brazil Blended Peppermint Tea Regional Analysis and Outlook
8.5.2. Argentina Blended Peppermint Tea Regional Analysis and Outlook
8.5.3. Rest of South America Blended Peppermint Tea Regional Analysis and Outlook
8.6. Middle East and Africa Blended Peppermint Tea Revenue (USD Million) by Country (2021-2032)
8.6.1. Middle East Blended Peppermint Tea Regional Analysis and Outlook
8.6.2. Africa Blended Peppermint Tea Regional Analysis and Outlook
Chapter 9. North America Blended Peppermint Tea Analysis and Outlook
9.1. North America Blended Peppermint Tea Revenue (USD Million) by Segments (2021-2032)
9.1.1. North America Blended Peppermint Tea Revenue (USD Million) by Type (2021-2032)
9.1.2. North America Blended Peppermint Tea Revenue (USD Million) by Application (2021-2032)
9.1.3. North America Blended Peppermint Tea Revenue (USD Million) by Product (2021-2032)
By Type
Blended Fruits
Blended Spices
Others
By Sales Channel
Online
Offline
Chapter 10. Europe Blended Peppermint Tea Analysis and Outlook
10.1. Europe Blended Peppermint Tea Revenue (USD Million), by Segments (USD Million) (2021-2032)
10.1.1. Europe Blended Peppermint Tea Revenue (USD Million) by Type (2021-2032)
10.1.2. Europe Blended Peppermint Tea Revenue (USD Million) by Application (2021-2032)
10.1.3. Europe Blended Peppermint Tea Revenue (USD Million) by Product (2021-2032)
By Type
Blended Fruits
Blended Spices
Others
By Sales Channel
Online
Offline
Chapter 11. Asia Pacific Blended Peppermint Tea Analysis and Outlook
11.1. Asia Pacific Blended Peppermint Tea Revenue (USD Million), and Revenue (USD Million) by Segments (2021-2032)
11.1.1. Asia Pacific Blended Peppermint Tea Revenue (USD Million) by Type (2021-2032)
11.1.2. Asia Pacific Blended Peppermint Tea Revenue (USD Million) by Application (2021-2032)
11.1.3. Asia Pacific Blended Peppermint Tea Revenue (USD Million) by Product (2021-2032)
By Type
Blended Fruits
Blended Spices
Others
By Sales Channel
Online
Offline
Chapter 12. South America Blended Peppermint Tea Analysis and Outlook
12.1. South America Blended Peppermint Tea Revenue (USD Million), by Segments (2021-2032)
12.1.1. South America Blended Peppermint Tea Revenue (USD Million) by Type (2021-2032)
12.1.2. South America Blended Peppermint Tea Revenue (USD Million) by Application (2021-2032)
12.1.3. South America Blended Peppermint Tea Revenue (USD Million) by Product (2021-2032)
By Type
Blended Fruits
Blended Spices
Others
By Sales Channel
Online
Offline
Chapter 13. Middle East and Africa Blended Peppermint Tea Analysis and Outlook
13.1. Middle East and Africa Blended Peppermint Tea Revenue (USD Million), by Segments (2021-2032)
13.1.1. Middle East and Africa Blended Peppermint Tea Revenue (USD Million) by Type (2021-2032)
13.1.2. Middle East and Africa Blended Peppermint Tea Revenue (USD Million) by Application (2021-2032)
13.1.3. Middle East and Africa Blended Peppermint Tea Revenue (USD Million) by Product (2021-2032)
By Type
Blended Fruits
Blended Spices
Others
By Sales Channel
Online
Offline
Chapter 14. Blended Peppermint Tea Company Profiles
14.1 Business Overview
14.2 Product Profiles
14.3 SWOT Profiles
14.5 Recent Developments
14.6 Financial Profile
List of Companies
Associated British Foods
Dilmah Ceylon Tea
Harney & Sons Tea
Orientis Gourmet SAS
R.C. Bigelow
Tata Consumer Products
The Hain Celestial Group
The Republic of Tea
Unilever
Yamamotoyama
15. Methodology and Data Sources
15.1 Customization Offerings
15.2 Subscription Services
15.3 Related Reports
15.4 Publisher Expertise
LIST OF TABLES
Table 1 Market Segmentation Analysis
Table 2 Global Blended Peppermint Tea Market Share of Leading Companies, 2023
Table 3 Product Offerings of Leading Companies
Table 4 Low Growth Scenario Forecasts
Table 5 Reference Case Growth Scenario
Table 6 High Growth Case Scenario
Table 7 Global Blended Peppermint Tea Revenue (USD Million) And CAGR (%) By Type (2021-2032)
Table 8 Global Blended Peppermint Tea Revenue (USD Million) And CAGR (%) By Application (2021-2032)
Table 9 Global Blended Peppermint Tea Revenue (USD Million) And CAGR (%) By Product (2021-2032)
Table 10 Global Blended Peppermint Tea Market Revenue (USD Million) By Regions (2021-2032)
Table 11 Global Blended Peppermint Tea Market Share (%) By Regions (2021-2032)
Table 12 North America Blended Peppermint Tea Revenue (USD Million) By Country (2021-2032)
Table 13 Europe Blended Peppermint Tea Revenue (USD Million) By Country (2021-2032)
Table 14 Asia Pacific Blended Peppermint Tea Revenue (USD Million) By Country (2021-2032)
Table 15 South America Blended Peppermint Tea Revenue (USD Million) By Country (2021-2032)
Table 16 Middle East and Africa Blended Peppermint Tea Revenue (USD Million) By Region (2021-2032)
Table 17 North America Blended Peppermint Tea Revenue (USD Million) By Type (2021-2032)
Table 18 North America Blended Peppermint Tea Revenue (USD Million) By Application (2021-2032)
Table 19 North America Blended Peppermint Tea Revenue (USD Million) By Product (2021-2032)
Table 20 Europe Blended Peppermint Tea Revenue (USD Million) By Type (2021-2032)
Table 21 Europe Blended Peppermint Tea Revenue (USD Million) By Application (2021-2032)
Table 22 Europe Blended Peppermint Tea Revenue (USD Million) By Product (2021-2032)
Table 23 Asia Pacific Blended Peppermint Tea Revenue (USD Million) By Type (2021-2032)
Table 24 Asia Pacific Blended Peppermint Tea Revenue (USD Million) By Application (2021-2032)
Table 25 Asia Pacific Blended Peppermint Tea Revenue (USD Million) By Product (2021-2032)
Table 26 South America Blended Peppermint Tea Revenue (USD Million) By Type (2021-2032)
Table 27 South America Blended Peppermint Tea Revenue (USD Million) By Application (2021-2032)
Table 28 South America Blended Peppermint Tea Revenue (USD Million) By Product (2021-2032)
Table 29 Middle East and Africa Blended Peppermint Tea Revenue (USD Million) By Type (2021-2032)
Table 30 Middle East and Africa Blended Peppermint Tea Revenue (USD Million) By Application (2021-2032)
Table 31 Middle East and Africa Blended Peppermint Tea Revenue (USD Million) By Product (2021-2032)
LIST OF FIGURES
Figure 1. Market Scope
Figure 2. Pricing Forecasts Per Unit, 2023- 2032
Figure 3. Porter’s Five Forces
Figure 4. Global Blended Peppermint Tea Market Revenue (USD Million) By Regions (2021-2032)
Figure 5. Global Blended Peppermint Tea Market Share (%) By Regions (2023)
Figure 6. North America Blended Peppermint Tea Revenue (USD Million) By Country (2021-2032)
Figure 7. United States Blended Peppermint Tea Revenue (USD Million) By Country (2021-2032)
Figure 8. Canada Blended Peppermint Tea Revenue (USD Million) By Country (2021-2032)
Figure 9. Mexico Blended Peppermint Tea Revenue (USD Million) By Country (2021-2032)
Figure 10. Europe Blended Peppermint Tea Revenue (USD Million) By Country (2021-2032)
Figure 11. Germany Blended Peppermint Tea Revenue (USD Million) By Country (2021-2032)
Figure 12. France Blended Peppermint Tea Revenue (USD Million) By Country (2021-2032)
Figure 13. United Kingdom Blended Peppermint Tea Revenue (USD Million) By Country (2021-2032)
Figure 14. Spain Blended Peppermint Tea Revenue (USD Million) By Country (2021-2032)
Figure 15. Italy Blended Peppermint Tea Revenue (USD Million) By Country (2021-2032)
Figure 16. Russia Blended Peppermint Tea Revenue (USD Million) By Country (2021-2032)
Figure 17. Rest of Europe Blended Peppermint Tea Revenue (USD Million) By Country (2021-2032)
Figure 11. Asia Pacific Blended Peppermint Tea Revenue (USD Million) By Country (2021-2032)
Figure 12. China Blended Peppermint Tea Revenue (USD Million) By Country (2021-2032)
Figure 13. Japan Blended Peppermint Tea Revenue (USD Million) By Country (2021-2032)
Figure 14. India Blended Peppermint Tea Revenue (USD Million) By Country (2021-2032)
Figure 15. South Korea Blended Peppermint Tea Revenue (USD Million) By Country (2021-2032)
Figure 16. Australia Blended Peppermint Tea Revenue (USD Million) By Country (2021-2032)
Figure 17. South East Asia Blended Peppermint Tea Revenue (USD Million) By Country (2021-2032)
Figure 18. South America Blended Peppermint Tea Revenue (USD Million) By Country (2021-2032)
Figure 19. Brazil Blended Peppermint Tea Revenue (USD Million) By Country (2021-2032)
Figure 20. Argentina Blended Peppermint Tea Revenue (USD Million) By Country (2021-2032)
Figure 21. Rest of Asia Pacific Blended Peppermint Tea Revenue (USD Million) By Country (2021-2032)
Figure 22. Middle East and Africa Blended Peppermint Tea Revenue (USD Million) By Region (2021-2032)
Figure 23. Saudi Arabia Blended Peppermint Tea Revenue (USD Million) By Region (2021-2032)
Figure 24. The UAE Blended Peppermint Tea Revenue (USD Million) By Region (2021-2032)
Figure 25. Rest of Middle East Blended Peppermint Tea Revenue (USD Million) By Region (2021-2032)
Figure 26. South Africa Blended Peppermint Tea Revenue (USD Million) By Region (2021-2032)
Figure 27. Africa Blended Peppermint Tea Revenue (USD Million) By Region (2021-2032)
Figure 28. North America Blended Peppermint Tea Revenue (USD Million) By Type (2021-2032)
Figure 29. North America Blended Peppermint Tea Revenue (USD Million) By Application (2021-2032)
Figure 30. North America Blended Peppermint Tea Revenue (USD Million) By Product (2021-2032)
Figure 31. Europe Blended Peppermint Tea Revenue (USD Million) By Type (2021-2032)
Figure 32. Europe Blended Peppermint Tea Revenue (USD Million) By Application (2021-2032)
Figure 33. Europe Blended Peppermint Tea Revenue (USD Million) By Product (2021-2032)
Figure 34. Asia Pacific Blended Peppermint Tea Revenue (USD Million) By Type (2021-2032)
Figure 35. Asia Pacific Blended Peppermint Tea Revenue (USD Million) By Application (2021-2032)
Figure 36. Asia Pacific Blended Peppermint Tea Revenue (USD Million) By Product (2021-2032)
Figure 37. South America Blended Peppermint Tea Revenue (USD Million) By Type (2021-2032)
Figure 38. South America Blended Peppermint Tea Revenue (USD Million) By Application (2021-2032)
Figure 39. South America Blended Peppermint Tea Revenue (USD Million) By Product (2021-2032)
Figure 40. Middle East and Africa Blended Peppermint Tea Revenue (USD Million) By Type (2021-2032)
Figure 41. Middle East and Africa Blended Peppermint Tea Revenue (USD Million) By Application (2021-2032)
Figure 42. Middle East and Africa Blended Peppermint Tea Revenue (USD Million) By Product (2021-2032)
By Type
Blended Fruits
Blended Spices
Others
By Sales Channel
Online
Offline
Countries Analyzed
North America (US, Canada, Mexico)
Europe (Germany, UK, France, Spain, Italy, Russia, Rest of Europe)
Asia Pacific (China, India, Japan, South Korea, Australia, South East Asia, Rest of Asia)
South America (Brazil, Argentina, Rest of South America)
Middle East and Africa (Saudi Arabia, UAE, Rest of Middle East, South Africa, Egypt, Rest of Africa)
