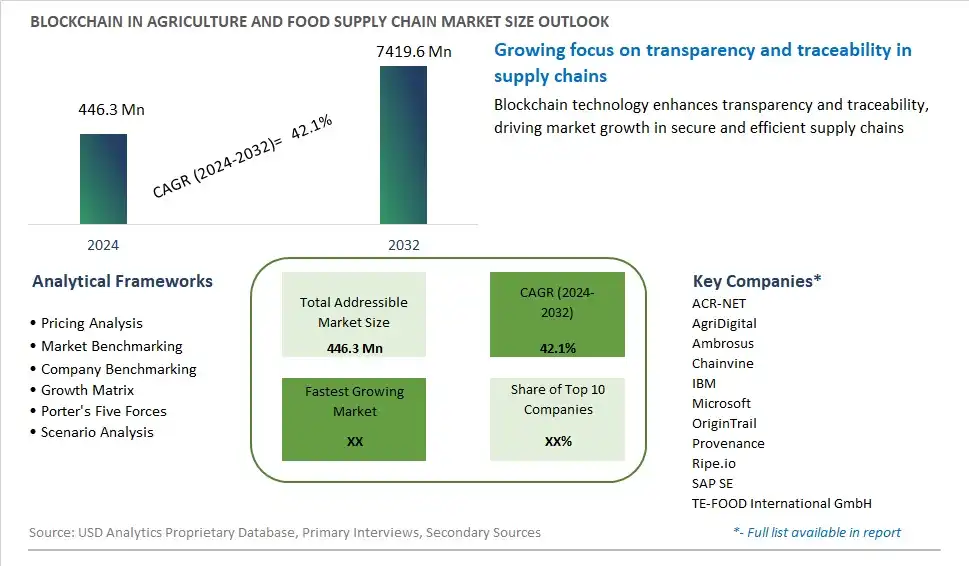
Global Blockchain in Agriculture and Food Supply Chain Market Size is valued at $446.3 Million in 2024 and is forecast to register a growth rate (CAGR) of 42.1% to reach $7419.6 Million by 2032.
The global Blockchain in Agriculture and Food Supply Chain Market Comprehensive Study analyzes and forecasts the market size across 6 regions and 24 countries for diverse segments -By Type (Public, Private, Consortium), By Stakeholder (Growers, Food Manufacturers/Processors, Retailers), By Provider (Application Providers, Middleware Providers, Infrastructure Providers), By Organization Size (Small and Medium-Sized Enterprises, Large Enterprises), By Application (Product Traceability, Tracking, Visibility, Payment And Settlement, Smart Contract, Governance, Risk, Compliance Management)
An Introduction to Blockchain in Agriculture and Food Supply Chain Market
Blockchain technology is revolutionizing the agriculture and food supply chain in 2024, offering unprecedented transparency, traceability, and trustworthiness in the production, distribution, and consumption of food products. By creating a decentralized and immutable ledger of transactions, blockchain enables stakeholders to track the journey of food products from farm to fork, providing real-time visibility into sourcing, processing, and handling practices at every stage of the supply chain. With growing concerns about food safety, fraud, and sustainability, blockchain solutions offer a reliable and secure means of verifying product authenticity, ensuring compliance with regulatory standards, and building consumer confidence in the integrity of the food system. From farm management and certification to logistics and retail, blockchain applications are transforming how food is produced, traded, and consumed, driving efficiencies, reducing waste, and fostering greater collaboration and accountability among supply chain partners. As adoption of blockchain technology accelerates across the agriculture and food industry, the potential for innovation and disruption in supply chain management and food safety assurance is vast, promising a more resilient, transparent, and sustainable food system for future generations.
Blockchain in Agriculture and Food Supply Chain Competitive Landscape
The market report analyses the leading companies in the industry including ACR-NET, AgriDigital, Ambrosus, Chainvine, IBM, Microsoft, OriginTrail, Provenance, Ripe.io, SAP SE, TE-FOOD International GmbH, and Others.
Blockchain in Agriculture and Food Supply Chain Market Dynamics
Blockchain in Agriculture and Food Supply Chain Market Trend: Increased Adoption of Blockchain Technology in Agriculture and Food Supply Chain
A prominent trend in the blockchain in agriculture and food supply chain market is the increased adoption of blockchain technology across the industry. Blockchain offers a decentralized, transparent, and immutable ledger system that enables secure recording and tracking of transactions and data throughout the food supply chain. This trend is driven by the need for enhanced traceability, food safety, and sustainability, as well as the growing demand for transparency and accountability from consumers, regulators, and stakeholders. Blockchain technology enables stakeholders to access real-time, tamper-proof information about the origin, production methods, and journey of food products, promoting trust and integrity in the food system. As a result, more companies in the agriculture and food industry are exploring and implementing blockchain solutions to improve supply chain efficiency, reduce food fraud, and ensure compliance with regulatory requirements and industry standards.
Market Driver: Rising Concerns About Food Safety and Traceability
A key driver propelling the growth of the blockchain in agriculture and food supply chain market is the rising concerns about food safety, traceability, and authenticity. With increasing globalization of the food supply chain, complex distribution networks, and frequent foodborne illness outbreaks, there's a growing awareness of the need for better traceability and transparency in the food system. Blockchain technology offers a solution by providing a decentralized and secure platform for recording and sharing information about food products from farm to fork. By leveraging blockchain-enabled traceability systems, stakeholders can quickly identify and respond to food safety incidents, track the source of contamination, and implement targeted recalls, minimizing the risk of public health hazards and financial losses. Additionally, blockchain enhances supply chain visibility and accountability, enabling companies to build consumer trust, differentiate their brands, and meet regulatory requirements for food safety and quality assurance. As concerns about food safety continue to escalate, the demand for blockchain solutions in the agriculture and food supply chain is expected to increase, driving market growth and adoption of technology-driven traceability initiatives.
Market Opportunity: Integration of Blockchain with IoT and AI Technologies
An opportunity within the blockchain in agriculture and food supply chain market lies in the integration of blockchain technology with Internet of Things (IoT) and artificial intelligence (AI) technologies to create more comprehensive and intelligent supply chain solutions. While blockchain provides a secure and transparent ledger for recording transactions and data, the combination of blockchain with IoT sensors and AI analytics offers enhanced capabilities for real-time monitoring, predictive insights, and autonomous decision-making in the food supply chain. For example, IoT sensors can collect data on environmental conditions, such as temperature, humidity, and location, throughout the journey of food products, which is then recorded on the blockchain for immutable tracking and verification. AI algorithms can analyze this data to detect anomalies, predict potential risks, and optimize supply chain operations, such as inventory management, route optimization, and quality control. By integrating blockchain with IoT and AI technologies, companies can create end-to-end visibility and intelligence in the food supply chain, improving efficiency, resilience, and sustainability while unlocking new opportunities for innovation and value creation. Additionally, the convergence of blockchain, IoT, and AI opens doors for collaborative partnerships, ecosystem development, and new business models that harness the power of emerging technologies to address complex challenges in the agriculture and food industry.
Blockchain in Agriculture and Food Supply Chain Market Share Analysis: Consortium held the dominant market share in 2024
In the Blockchain in Agriculture and Food Supply Chain Market categorized by type, the consortium segment is the largest, driven by several pivotal factors. Consortium blockchain networks, formed through collaboration among multiple stakeholders within the agriculture and food supply chain, offer a decentralized and secure platform for data sharing, transparency, and traceability. By pooling resources and expertise, consortiums enable participants, including farmers, suppliers, distributors, retailers, and consumers, to collectively address industry challenges such as food safety, authenticity, and sustainability. The consortium model fosters trust and collaboration among participants while ensuring data privacy and integrity, making it an attractive option for organizations seeking to leverage blockchain technology without the complexities associated with public or private networks. Further, consortiums facilitate interoperability and standardization across the supply chain, promoting seamless data exchange and interoperability among disparate systems and stakeholders. As a result, the consortium segment dominates the Blockchain in Agriculture and Food Supply Chain Market, poised for continued growth as industry players recognize the value of collaborative approaches in driving innovation and resilience across the food system.
Blockchain in Agriculture and Food Supply Chain Market Share Analysis: Retailers market is poised to register the fastest growth rae over the forecast period to 2032
In the Blockchain in Agriculture and Food Supply Chain Market segmented by stakeholders, the retailers segment is the fastest-growing, propelled by several transformative factors. Retailers play a pivotal role in the food supply chain, serving as the final link between producers and consumers. As consumers increasingly demand transparency, traceability, and accountability in the products they purchase, retailers are under pressure to ensure the integrity and safety of the food they offer. Blockchain technology offers a solution by providing a transparent and immutable ledger that enables retailers to track and trace the journey of food products from farm to fork. By leveraging blockchain, retailers can enhance food safety, mitigate risks of contamination or fraud, and build trust with consumers by providing access to verified information about product origins, handling practices, and certifications. Further, blockchain-enabled supply chain visibility enables retailers to optimize inventory management, reduce waste, and improve operational efficiency, driving cost savings and competitive advantage. As a result, retailers are increasingly adopting blockchain technology to meet consumer expectations for quality, safety, and sustainability, making the retailers segment the fastest-growing in the Blockchain in Agriculture and Food Supply Chain Market.
Blockchain in Agriculture and Food Supply Chain Market Share Analysis: Application Providers held the dominant market share in 2024
In the Blockchain in Agriculture and Food Supply Chain Market segmented by providers, the application providers segment is the largest, driven by several pivotal factors. Application providers play a crucial role in developing and deploying blockchain-based solutions tailored to address the unique challenges and requirements of the agriculture and food supply chain. These solutions encompass a wide range of applications, including traceability, provenance, smart contracts, and quality assurance, aimed at enhancing transparency, efficiency, and trust throughout the supply chain. Application providers offer turnkey solutions that enable stakeholders, including growers, manufacturers, processors, distributors, and retailers, to seamlessly integrate blockchain technology into their existing operations without the need for extensive technical expertise or infrastructure investment. Further, application providers facilitate interoperability and standardization across the supply chain by offering customizable solutions that can be tailored to meet the diverse needs of different stakeholders and industry sectors. As a result, the application providers segment dominates the Blockchain in Agriculture and Food Supply Chain Market, poised for continued growth as organizations recognize the value of blockchain technology in addressing pressing challenges and driving innovation across the food system.
Blockchain in Agriculture and Food Supply Chain Market Segmentation
By Type
Public
Private
Consortium
By Stakeholder
Growers
Food Manufacturers/Processors
Retailers
By Provider
Application Providers
Middleware Providers
Infrastructure Providers
By Organization Size
Small and Medium-Sized Enterprises
Large Enterprises
By Application
Product Traceability
Tracking
Visibility
Payment And Settlement
Smart Contract
Governance
Risk
Compliance Management
Countries Analyzed
North America (US, Canada, Mexico)
Europe (Germany, UK, France, Spain, Italy, Russia, Rest of Europe)
Asia Pacific (China, India, Japan, South Korea, Australia, South East Asia, Rest of Asia)
South America (Brazil, Argentina, Rest of South America)
Middle East and Africa (Saudi Arabia, UAE, Rest of Middle East, South Africa, Egypt, Rest of Africa)
Blockchain in Agriculture and Food Supply Chain Companies Profiled in the Study
ACR-NET
AgriDigital
Ambrosus
Chainvine
IBM
Microsoft
OriginTrail
Provenance
Ripe.io
SAP SE
TE-FOOD International GmbH
*- List Not Exhaustive
Chapter 1. TABLE OF CONTENTS
Chapter 2. Introduction to Blockchain in Agriculture and Food Supply Chain Market
2.1. Market Overview
2.2. Key Statistics and Report Highlights
2.3. Scope of the Comprehensive Study
2.3.1. Market Definition
2.3.2 Countries and Regions Covered
2.3.3 Research Objective
2.3.4 Units, Currency, and Conversions
2.3.5 Industry Value Chain
2.4. Key Market Segments
2.5. Key Companies
2.6. Study Period
Chapter 3. Strategic Analysis Review
3.1. Blockchain in Agriculture and Food Supply Chain Pricing Analysis and Forecast
3.2. Porter’s Five Forces
3.3. Market Ecosystem
3.4. SWOT Analysis
3.5. Regulatory Scenario
3.3. Effects of Inflation, Russia-Ukraine War, moderating economic growth, and other macroeconomic factors
Chapter 4. Competitive Landscape
4.1. Market Share Analysis
4.1.1. Global Blockchain in Agriculture and Food Supply Chain Market Share by Company, 2023
4.1.2. Product Offerings of Leading Blockchain in Agriculture and Food Supply Chain Companies
4.2. Market Entropy
4.2.1. New Product Launches in the Industry
4.2.2. Mergers, Acquisitions, Joint ventures, and Partnerships
4.3. Key Strategies and Best Practices
Chapter 5. Global Market Projections: Best, Reference, and Low Case Scenarios
5.1. Growth Analysis- Case Scenario Definitions
5.2. Low Growth Case Scenario Forecasts
5.3. Reference Growth Case Scenario Forecasts
5.4. High Growth Case Scenario Forecasts
Chapter 6. Market Dynamics
6.1. Blockchain in Agriculture and Food Supply Chain Market Drivers
6.2. Blockchain in Agriculture and Food Supply Chain Market Challenges
6.6. Blockchain in Agriculture and Food Supply Chain Market Opportunities
6.4. Blockchain in Agriculture and Food Supply Chain Market Trends
Chapter 7. Global Blockchain in Agriculture and Food Supply Chain Market Outlook Trends
7.1. Global Blockchain in Agriculture and Food Supply Chain Revenue (USD Million) and CAGR (%) by Type (2021-2032)
7.2. Global Blockchain in Agriculture and Food Supply Chain Revenue (USD Million) and CAGR (%) by Application (2021-2032)
7.3. Global Blockchain in Agriculture and Food Supply Chain Revenue (USD Million) and CAGR (%) by Product (2021-2032)
By Type
Public
Private
Consortium
By Stakeholder
Growers
Food Manufacturers/Processors
Retailers
By Provider
Application Providers
Middleware Providers
Infrastructure Providers
By Organization Size
Small and Medium-Sized Enterprises
Large Enterprises
By Application
Product Traceability
Tracking
Visibility
Payment And Settlement
Smart Contract
Governance
Risk
Compliance Management
Chapter 8. Global Blockchain in Agriculture and Food Supply Chain Regional Analysis and Outlook
8.1. Global Blockchain in Agriculture and Food Supply Chain Revenue (USD Million) By Regions (2021- 2032)
8.2. North America Blockchain in Agriculture and Food Supply Chain Revenue (USD Million) by Country (2021-2032)
8.2.1. United States Blockchain in Agriculture and Food Supply Chain Regional Analysis and Outlook
8.2.2. Canada Blockchain in Agriculture and Food Supply Chain Regional Analysis and Outlook
8.2.3. Mexico Blockchain in Agriculture and Food Supply Chain Regional Analysis and Outlook
8.3. Europe Blockchain in Agriculture and Food Supply Chain Revenue (USD Million), by Country (2021-2032)
8.3.1. Germany Blockchain in Agriculture and Food Supply Chain Regional Analysis and Outlook
8.3.2. France Blockchain in Agriculture and Food Supply Chain Regional Analysis and Outlook
8.3.3. United Kingdom Blockchain in Agriculture and Food Supply Chain Regional Analysis and Outlook
8.3.4. Spain Blockchain in Agriculture and Food Supply Chain Regional Analysis and Outlook
8.3.5. Italy Blockchain in Agriculture and Food Supply Chain Regional Analysis and Outlook
8.3.6. Russia Blockchain in Agriculture and Food Supply Chain Regional Analysis and Outlook
8.3.7. Rest of Europe Blockchain in Agriculture and Food Supply Chain Regional Analysis and Outlook
8.4. Asia Pacific Blockchain in Agriculture and Food Supply Chain Revenue (USD Million) by Country (2021-2032)
8.4.1. China Blockchain in Agriculture and Food Supply Chain Regional Analysis and Outlook
8.4.2. Japan Blockchain in Agriculture and Food Supply Chain Regional Analysis and Outlook
8.4.3. India Blockchain in Agriculture and Food Supply Chain Regional Analysis and Outlook
8.4.4. South Korea Blockchain in Agriculture and Food Supply Chain Regional Analysis and Outlook
8.4.5. Australia Blockchain in Agriculture and Food Supply Chain Regional Analysis and Outlook
8.4.6. South East Asia Blockchain in Agriculture and Food Supply Chain Regional Analysis and Outlook
8.4.7. Rest of Asia Pacific Blockchain in Agriculture and Food Supply Chain Regional Analysis and Outlook
8.5. South America Blockchain in Agriculture and Food Supply Chain Revenue (USD Million), by Country (2021-2032)
8.5.1. Brazil Blockchain in Agriculture and Food Supply Chain Regional Analysis and Outlook
8.5.2. Argentina Blockchain in Agriculture and Food Supply Chain Regional Analysis and Outlook
8.5.3. Rest of South America Blockchain in Agriculture and Food Supply Chain Regional Analysis and Outlook
8.6. Middle East and Africa Blockchain in Agriculture and Food Supply Chain Revenue (USD Million) by Country (2021-2032)
8.6.1. Middle East Blockchain in Agriculture and Food Supply Chain Regional Analysis and Outlook
8.6.2. Africa Blockchain in Agriculture and Food Supply Chain Regional Analysis and Outlook
Chapter 9. North America Blockchain in Agriculture and Food Supply Chain Analysis and Outlook
9.1. North America Blockchain in Agriculture and Food Supply Chain Revenue (USD Million) by Segments (2021-2032)
9.1.1. North America Blockchain in Agriculture and Food Supply Chain Revenue (USD Million) by Type (2021-2032)
9.1.2. North America Blockchain in Agriculture and Food Supply Chain Revenue (USD Million) by Application (2021-2032)
9.1.3. North America Blockchain in Agriculture and Food Supply Chain Revenue (USD Million) by Product (2021-2032)
By Type
Public
Private
Consortium
By Stakeholder
Growers
Food Manufacturers/Processors
Retailers
By Provider
Application Providers
Middleware Providers
Infrastructure Providers
By Organization Size
Small and Medium-Sized Enterprises
Large Enterprises
By Application
Product Traceability
Tracking
Visibility
Payment And Settlement
Smart Contract
Governance
Risk
Compliance Management
Chapter 10. Europe Blockchain in Agriculture and Food Supply Chain Analysis and Outlook
10.1. Europe Blockchain in Agriculture and Food Supply Chain Revenue (USD Million), by Segments (USD Million) (2021-2032)
10.1.1. Europe Blockchain in Agriculture and Food Supply Chain Revenue (USD Million) by Type (2021-2032)
10.1.2. Europe Blockchain in Agriculture and Food Supply Chain Revenue (USD Million) by Application (2021-2032)
10.1.3. Europe Blockchain in Agriculture and Food Supply Chain Revenue (USD Million) by Product (2021-2032)
By Type
Public
Private
Consortium
By Stakeholder
Growers
Food Manufacturers/Processors
Retailers
By Provider
Application Providers
Middleware Providers
Infrastructure Providers
By Organization Size
Small and Medium-Sized Enterprises
Large Enterprises
By Application
Product Traceability
Tracking
Visibility
Payment And Settlement
Smart Contract
Governance
Risk
Compliance Management
Chapter 11. Asia Pacific Blockchain in Agriculture and Food Supply Chain Analysis and Outlook
11.1. Asia Pacific Blockchain in Agriculture and Food Supply Chain Revenue (USD Million), and Revenue (USD Million) by Segments (2021-2032)
11.1.1. Asia Pacific Blockchain in Agriculture and Food Supply Chain Revenue (USD Million) by Type (2021-2032)
11.1.2. Asia Pacific Blockchain in Agriculture and Food Supply Chain Revenue (USD Million) by Application (2021-2032)
11.1.3. Asia Pacific Blockchain in Agriculture and Food Supply Chain Revenue (USD Million) by Product (2021-2032)
By Type
Public
Private
Consortium
By Stakeholder
Growers
Food Manufacturers/Processors
Retailers
By Provider
Application Providers
Middleware Providers
Infrastructure Providers
By Organization Size
Small and Medium-Sized Enterprises
Large Enterprises
By Application
Product Traceability
Tracking
Visibility
Payment And Settlement
Smart Contract
Governance
Risk
Compliance Management
Chapter 12. South America Blockchain in Agriculture and Food Supply Chain Analysis and Outlook
12.1. South America Blockchain in Agriculture and Food Supply Chain Revenue (USD Million), by Segments (2021-2032)
12.1.1. South America Blockchain in Agriculture and Food Supply Chain Revenue (USD Million) by Type (2021-2032)
12.1.2. South America Blockchain in Agriculture and Food Supply Chain Revenue (USD Million) by Application (2021-2032)
12.1.3. South America Blockchain in Agriculture and Food Supply Chain Revenue (USD Million) by Product (2021-2032)
By Type
Public
Private
Consortium
By Stakeholder
Growers
Food Manufacturers/Processors
Retailers
By Provider
Application Providers
Middleware Providers
Infrastructure Providers
By Organization Size
Small and Medium-Sized Enterprises
Large Enterprises
By Application
Product Traceability
Tracking
Visibility
Payment And Settlement
Smart Contract
Governance
Risk
Compliance Management
Chapter 13. Middle East and Africa Blockchain in Agriculture and Food Supply Chain Analysis and Outlook
13.1. Middle East and Africa Blockchain in Agriculture and Food Supply Chain Revenue (USD Million), by Segments (2021-2032)
13.1.1. Middle East and Africa Blockchain in Agriculture and Food Supply Chain Revenue (USD Million) by Type (2021-2032)
13.1.2. Middle East and Africa Blockchain in Agriculture and Food Supply Chain Revenue (USD Million) by Application (2021-2032)
13.1.3. Middle East and Africa Blockchain in Agriculture and Food Supply Chain Revenue (USD Million) by Product (2021-2032)
By Type
Public
Private
Consortium
By Stakeholder
Growers
Food Manufacturers/Processors
Retailers
By Provider
Application Providers
Middleware Providers
Infrastructure Providers
By Organization Size
Small and Medium-Sized Enterprises
Large Enterprises
By Application
Product Traceability
Tracking
Visibility
Payment And Settlement
Smart Contract
Governance
Risk
Compliance Management
Chapter 14. Blockchain in Agriculture and Food Supply Chain Company Profiles
14.1 Business Overview
14.2 Product Profiles
14.3 SWOT Profiles
14.5 Recent Developments
14.6 Financial Profile
List of Companies
ACR-NET
AgriDigital
Ambrosus
Chainvine
IBM
Microsoft
OriginTrail
Provenance
Ripe.io
SAP SE
TE-FOOD International GmbH
15. Methodology and Data Sources
15.1 Customization Offerings
15.2 Subscription Services
15.3 Related Reports
15.4 Publisher Expertise
LIST OF TABLES
Table 1 Market Segmentation Analysis
Table 2 Global Blockchain in Agriculture and Food Supply Chain Market Share of Leading Companies, 2023
Table 3 Product Offerings of Leading Companies
Table 4 Low Growth Scenario Forecasts
Table 5 Reference Case Growth Scenario
Table 6 High Growth Case Scenario
Table 7 Global Blockchain in Agriculture and Food Supply Chain Revenue (USD Million) And CAGR (%) By Type (2021-2032)
Table 8 Global Blockchain in Agriculture and Food Supply Chain Revenue (USD Million) And CAGR (%) By Application (2021-2032)
Table 9 Global Blockchain in Agriculture and Food Supply Chain Revenue (USD Million) And CAGR (%) By Product (2021-2032)
Table 10 Global Blockchain in Agriculture and Food Supply Chain Market Revenue (USD Million) By Regions (2021-2032)
Table 11 Global Blockchain in Agriculture and Food Supply Chain Market Share (%) By Regions (2021-2032)
Table 12 North America Blockchain in Agriculture and Food Supply Chain Revenue (USD Million) By Country (2021-2032)
Table 13 Europe Blockchain in Agriculture and Food Supply Chain Revenue (USD Million) By Country (2021-2032)
Table 14 Asia Pacific Blockchain in Agriculture and Food Supply Chain Revenue (USD Million) By Country (2021-2032)
Table 15 South America Blockchain in Agriculture and Food Supply Chain Revenue (USD Million) By Country (2021-2032)
Table 16 Middle East and Africa Blockchain in Agriculture and Food Supply Chain Revenue (USD Million) By Region (2021-2032)
Table 17 North America Blockchain in Agriculture and Food Supply Chain Revenue (USD Million) By Type (2021-2032)
Table 18 North America Blockchain in Agriculture and Food Supply Chain Revenue (USD Million) By Application (2021-2032)
Table 19 North America Blockchain in Agriculture and Food Supply Chain Revenue (USD Million) By Product (2021-2032)
Table 20 Europe Blockchain in Agriculture and Food Supply Chain Revenue (USD Million) By Type (2021-2032)
Table 21 Europe Blockchain in Agriculture and Food Supply Chain Revenue (USD Million) By Application (2021-2032)
Table 22 Europe Blockchain in Agriculture and Food Supply Chain Revenue (USD Million) By Product (2021-2032)
Table 23 Asia Pacific Blockchain in Agriculture and Food Supply Chain Revenue (USD Million) By Type (2021-2032)
Table 24 Asia Pacific Blockchain in Agriculture and Food Supply Chain Revenue (USD Million) By Application (2021-2032)
Table 25 Asia Pacific Blockchain in Agriculture and Food Supply Chain Revenue (USD Million) By Product (2021-2032)
Table 26 South America Blockchain in Agriculture and Food Supply Chain Revenue (USD Million) By Type (2021-2032)
Table 27 South America Blockchain in Agriculture and Food Supply Chain Revenue (USD Million) By Application (2021-2032)
Table 28 South America Blockchain in Agriculture and Food Supply Chain Revenue (USD Million) By Product (2021-2032)
Table 29 Middle East and Africa Blockchain in Agriculture and Food Supply Chain Revenue (USD Million) By Type (2021-2032)
Table 30 Middle East and Africa Blockchain in Agriculture and Food Supply Chain Revenue (USD Million) By Application (2021-2032)
Table 31 Middle East and Africa Blockchain in Agriculture and Food Supply Chain Revenue (USD Million) By Product (2021-2032)
LIST OF FIGURES
Figure 1. Market Scope
Figure 2. Pricing Forecasts Per Unit, 2023- 2032
Figure 3. Porter’s Five Forces
Figure 4. Global Blockchain in Agriculture and Food Supply Chain Market Revenue (USD Million) By Regions (2021-2032)
Figure 5. Global Blockchain in Agriculture and Food Supply Chain Market Share (%) By Regions (2023)
Figure 6. North America Blockchain in Agriculture and Food Supply Chain Revenue (USD Million) By Country (2021-2032)
Figure 7. United States Blockchain in Agriculture and Food Supply Chain Revenue (USD Million) By Country (2021-2032)
Figure 8. Canada Blockchain in Agriculture and Food Supply Chain Revenue (USD Million) By Country (2021-2032)
Figure 9. Mexico Blockchain in Agriculture and Food Supply Chain Revenue (USD Million) By Country (2021-2032)
Figure 10. Europe Blockchain in Agriculture and Food Supply Chain Revenue (USD Million) By Country (2021-2032)
Figure 11. Germany Blockchain in Agriculture and Food Supply Chain Revenue (USD Million) By Country (2021-2032)
Figure 12. France Blockchain in Agriculture and Food Supply Chain Revenue (USD Million) By Country (2021-2032)
Figure 13. United Kingdom Blockchain in Agriculture and Food Supply Chain Revenue (USD Million) By Country (2021-2032)
Figure 14. Spain Blockchain in Agriculture and Food Supply Chain Revenue (USD Million) By Country (2021-2032)
Figure 15. Italy Blockchain in Agriculture and Food Supply Chain Revenue (USD Million) By Country (2021-2032)
Figure 16. Russia Blockchain in Agriculture and Food Supply Chain Revenue (USD Million) By Country (2021-2032)
Figure 17. Rest of Europe Blockchain in Agriculture and Food Supply Chain Revenue (USD Million) By Country (2021-2032)
Figure 11. Asia Pacific Blockchain in Agriculture and Food Supply Chain Revenue (USD Million) By Country (2021-2032)
Figure 12. China Blockchain in Agriculture and Food Supply Chain Revenue (USD Million) By Country (2021-2032)
Figure 13. Japan Blockchain in Agriculture and Food Supply Chain Revenue (USD Million) By Country (2021-2032)
Figure 14. India Blockchain in Agriculture and Food Supply Chain Revenue (USD Million) By Country (2021-2032)
Figure 15. South Korea Blockchain in Agriculture and Food Supply Chain Revenue (USD Million) By Country (2021-2032)
Figure 16. Australia Blockchain in Agriculture and Food Supply Chain Revenue (USD Million) By Country (2021-2032)
Figure 17. South East Asia Blockchain in Agriculture and Food Supply Chain Revenue (USD Million) By Country (2021-2032)
Figure 18. South America Blockchain in Agriculture and Food Supply Chain Revenue (USD Million) By Country (2021-2032)
Figure 19. Brazil Blockchain in Agriculture and Food Supply Chain Revenue (USD Million) By Country (2021-2032)
Figure 20. Argentina Blockchain in Agriculture and Food Supply Chain Revenue (USD Million) By Country (2021-2032)
Figure 21. Rest of Asia Pacific Blockchain in Agriculture and Food Supply Chain Revenue (USD Million) By Country (2021-2032)
Figure 22. Middle East and Africa Blockchain in Agriculture and Food Supply Chain Revenue (USD Million) By Region (2021-2032)
Figure 23. Saudi Arabia Blockchain in Agriculture and Food Supply Chain Revenue (USD Million) By Region (2021-2032)
Figure 24. The UAE Blockchain in Agriculture and Food Supply Chain Revenue (USD Million) By Region (2021-2032)
Figure 25. Rest of Middle East Blockchain in Agriculture and Food Supply Chain Revenue (USD Million) By Region (2021-2032)
Figure 26. South Africa Blockchain in Agriculture and Food Supply Chain Revenue (USD Million) By Region (2021-2032)
Figure 27. Africa Blockchain in Agriculture and Food Supply Chain Revenue (USD Million) By Region (2021-2032)
Figure 28. North America Blockchain in Agriculture and Food Supply Chain Revenue (USD Million) By Type (2021-2032)
Figure 29. North America Blockchain in Agriculture and Food Supply Chain Revenue (USD Million) By Application (2021-2032)
Figure 30. North America Blockchain in Agriculture and Food Supply Chain Revenue (USD Million) By Product (2021-2032)
Figure 31. Europe Blockchain in Agriculture and Food Supply Chain Revenue (USD Million) By Type (2021-2032)
Figure 32. Europe Blockchain in Agriculture and Food Supply Chain Revenue (USD Million) By Application (2021-2032)
Figure 33. Europe Blockchain in Agriculture and Food Supply Chain Revenue (USD Million) By Product (2021-2032)
Figure 34. Asia Pacific Blockchain in Agriculture and Food Supply Chain Revenue (USD Million) By Type (2021-2032)
Figure 35. Asia Pacific Blockchain in Agriculture and Food Supply Chain Revenue (USD Million) By Application (2021-2032)
Figure 36. Asia Pacific Blockchain in Agriculture and Food Supply Chain Revenue (USD Million) By Product (2021-2032)
Figure 37. South America Blockchain in Agriculture and Food Supply Chain Revenue (USD Million) By Type (2021-2032)
Figure 38. South America Blockchain in Agriculture and Food Supply Chain Revenue (USD Million) By Application (2021-2032)
Figure 39. South America Blockchain in Agriculture and Food Supply Chain Revenue (USD Million) By Product (2021-2032)
Figure 40. Middle East and Africa Blockchain in Agriculture and Food Supply Chain Revenue (USD Million) By Type (2021-2032)
Figure 41. Middle East and Africa Blockchain in Agriculture and Food Supply Chain Revenue (USD Million) By Application (2021-2032)
Figure 42. Middle East and Africa Blockchain in Agriculture and Food Supply Chain Revenue (USD Million) By Product (2021-2032)
By Type
Public
Private
Consortium
By Stakeholder
Growers
Food Manufacturers/Processors
Retailers
By Provider
Application Providers
Middleware Providers
Infrastructure Providers
By Organization Size
Small and Medium-Sized Enterprises
Large Enterprises
By Application
Product Traceability
Tracking
Visibility
Payment And Settlement
Smart Contract
Governance
Risk
Compliance Management
Countries Analyzed
North America (US, Canada, Mexico)
Europe (Germany, UK, France, Spain, Italy, Russia, Rest of Europe)
Asia Pacific (China, India, Japan, South Korea, Australia, South East Asia, Rest of Asia)
South America (Brazil, Argentina, Rest of South America)
Middle East and Africa (Saudi Arabia, UAE, Rest of Middle East, South Africa, Egypt, Rest of Africa)
