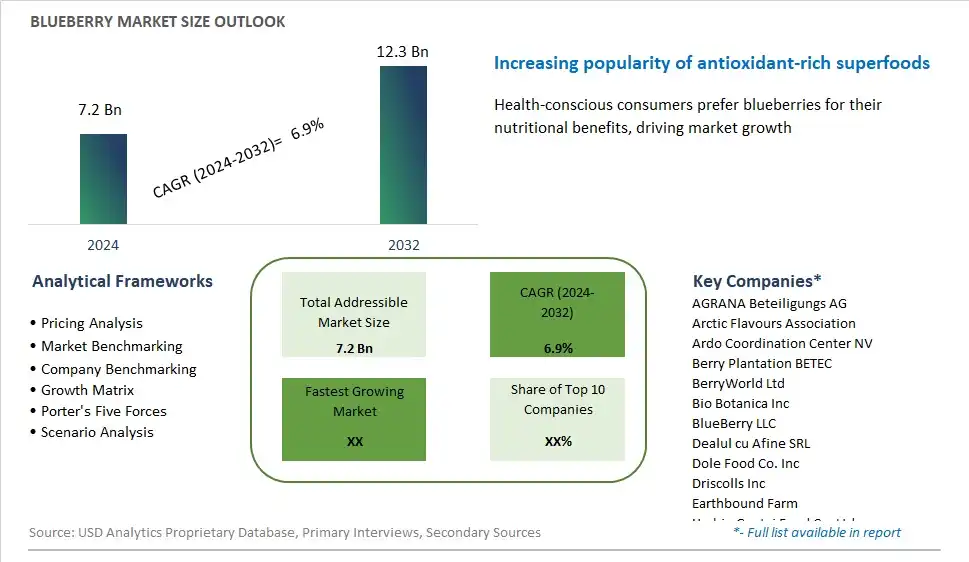
Global Blueberry Market Size is valued at $7.2 Billion in 2024 and is forecast to register a growth rate (CAGR) of 6.9% to reach $12.3 Billion by 2032.
The global Blueberry Market Comprehensive Study analyzes and forecasts the market size across 6 regions and 24 countries for diverse segments -By Type (Organic, Conventional), By Application (Food and beverages, Bakery and confectionary), By Product (Fresh, Frozen, Dried)
An Introduction to Blueberry Market
Blueberries, hailed as a superfood for their antioxidant-rich properties, continue to captivate consumers in the food and beverage market of 2024. Renowned for their vibrant color, sweet-tart flavor, and numerous health benefits, blueberries are featured in an array of products ranging from fresh produce to packaged goods. Smoothies, juices, snacks, baked goods, and even savory dishes showcase the versatility of this small but mighty fruit. With increased awareness of the importance of a balanced diet and wellness-focused lifestyles, blueberries remain a staple ingredient, contributing not only to culinary enjoyment but also to overall health and vitality.
Blueberry Competitive Landscape
The market report analyses the leading companies in the industry including AGRANA Beteiligungs AG, Arctic Flavours Association, Ardo Coordination Center NV, Berry Plantation BETEC, BerryWorld Ltd, Bio Botanica Inc, BlueBerry LLC, Dealul cu Afine SRL, Dole Food Co. Inc, Driscolls Inc, Earthbound Farm, Harbin Gaotai Food Co. Ltd, J.R. Simplot Co., JWM Asia Holdings, MBG Marketing, and Others.
Blueberry Market Dynamics
Blueberry Market Trend: Increasing Demand for Functional and Nutrient-Dense Foods
The market trend for Blueberries reflects the increasing demand for functional and nutrient-dense foods. Blueberries are renowned for their high antioxidant content, including anthocyanins, which have been linked to various health benefits such as improved cognitive function, heart health, and inflammation reduction. As consumers become more health-conscious and seek out foods with added nutritional value, there's a growing interest in incorporating blueberries into their diets. This trend is evident in the rise of blueberry-based products such as juices, smoothies, snacks, and supplements, as consumers recognize the potential health benefits of consuming blueberries regularly.
Market Driver: Growing Awareness of Health and Wellness
A significant driver of the Blueberry market is the growing awareness of health and wellness among consumers. With an increasing focus on preventive healthcare and holistic well-being, there's a heightened interest in incorporating nutrient-rich foods like blueberries into daily diets. Blueberries are not only delicious but also packed with vitamins, minerals, and antioxidants that support overall health and vitality. The promotion of blueberries as a superfood by health experts, nutritionists, and influencers further drives consumer interest and consumption. This driver underscores the importance of health-conscious consumer behavior in fueling the demand for blueberries and blueberry-based products.
Market Opportunity: Expansion into Functional Food and Beverage Categories
An opportunity in the Blueberry market lies in the expansion into functional food and beverage categories. While blueberries are commonly consumed fresh or frozen, there's potential to leverage their health-promoting properties in a wider range of product applications. For instance, incorporating blueberry extracts or powders into functional beverages such as smoothies, teas, and sports drinks can enhance their nutritional profile and appeal to health-conscious consumers seeking convenient and flavorful options. Similarly, integrating blueberries into functional food categories such as granola bars, yogurt, and breakfast cereals can offer consumers a convenient way to incorporate blueberries into their daily routines. By capitalizing on the growing demand for functional foods and beverages, companies can unlock new opportunities for product innovation and market expansion in the Blueberry market.
Blueberry Market Share Analysis: Conventional Blueberries held the dominant market share in 2024
In the Blueberry market, conventional blueberries emerge as the largest segment, primarily due to their widespread availability, established production practices, and lower price points compared to organic counterparts. Conventional blueberries are cultivated using conventional farming methods that may include the use of synthetic fertilizers, pesticides, and herbicides to enhance yields and protect against pests and diseases. Their accessibility and affordability make them a preferred choice for a broad spectrum of consumers, catering to various culinary uses and preferences. Additionally, conventional blueberries often boast consistent quality, flavor, and appearance, meeting the expectations of consumers and retailers alike. Further, the well-established supply chain networks for conventional blueberries ensure their widespread distribution in supermarkets, grocery stores, and foodservice establishments worldwide. With their accessibility, affordability, and consistent quality, conventional blueberries maintain their stronghold as the largest segment in the market, meeting the diverse culinary needs and preferences of consumers.
Blueberry Market Share Analysis: Bakery and Confectionary market is poised to register the fastest growth rae over the forecast period to 2032
Among the applications in the Blueberry market, the Bakery and Confectionary segment is the fastest-growing, driven by several key factors. Firstly, blueberries add natural sweetness, vibrant color, and a unique flavor profile to bakery and confectionary products, enhancing their appeal to consumers seeking healthier and more indulgent treats. The versatility of blueberries allows for their incorporation into a wide range of baked goods, including muffins, cakes, pies, cookies, and pastries, as well as confectionary items such as chocolates, candies, and jams. Secondly, the growing consumer interest in plant-based and natural ingredients fuels the demand for blueberry-infused bakery and confectionary products, as blueberries are perceived as wholesome and nutritious additions. Further, the rising popularity of artisanal and gourmet baked goods and confectionary items further drives innovation and product development in this segment, with blueberries often featured as a premium ingredient. Additionally, the increasing availability of blueberry-flavored bakery and confectionary products in retail outlets, specialty bakeries, and online platforms expands consumer access and drives sales growth. With their delicious flavor, nutritional benefits, and versatility in culinary applications, blueberries are poised to continue their rapid expansion in the Bakery and Confectionary segment, meeting the evolving tastes and preferences of consumers worldwide.
Blueberry Market Share Analysis: Frozen Blueberries held the dominant market share in 2024
In the Blueberry market, frozen blueberries emerge as the largest segment, primarily due to their extended shelf life, convenience, and versatility in culinary applications. Frozen blueberries offer consumers the opportunity to enjoy the nutritional benefits and vibrant flavor of blueberries year-round, regardless of seasonal availability. Their frozen state preserves the fruit's freshness, texture, and nutritional content, making them suitable for use in a wide range of recipes, including smoothies, baked goods, desserts, and savory dishes. Further, frozen blueberries are often more affordable than fresh blueberries, making them accessible to a broader consumer base. Additionally, frozen blueberries are widely available in supermarkets, grocery stores, and online platforms, further driving their popularity and dominance in the market. With their convenience, affordability, and versatility, frozen blueberries maintain their stronghold as the largest segment in the Blueberry market, meeting the diverse culinary needs and preferences of consumers.
Blueberry Market Segmentation
By Type
Organic
Conventional
By Application
Food and beverages
Bakery and confectionary
By Product
Fresh
Frozen
Dried
Countries Analyzed
North America (US, Canada, Mexico)
Europe (Germany, UK, France, Spain, Italy, Russia, Rest of Europe)
Asia Pacific (China, India, Japan, South Korea, Australia, South East Asia, Rest of Asia)
South America (Brazil, Argentina, Rest of South America)
Middle East and Africa (Saudi Arabia, UAE, Rest of Middle East, South Africa, Egypt, Rest of Africa)
Blueberry Companies Profiled in the Study
AGRANA Beteiligungs AG
Arctic Flavours Association
Ardo Coordination Center NV
Berry Plantation BETEC
BerryWorld Ltd
Bio Botanica Inc
BlueBerry LLC
Dealul cu Afine SRL
Dole Food Co. Inc
Driscolls Inc
Earthbound Farm
Harbin Gaotai Food Co. Ltd
J.R. Simplot Co.
JWM Asia Holdings
MBG Marketing
*- List Not Exhaustive
Chapter 1. TABLE OF CONTENTS
Chapter 2. Introduction to Blueberry Market
2.1. Market Overview
2.2. Key Statistics and Report Highlights
2.3. Scope of the Comprehensive Study
2.3.1. Market Definition
2.3.2 Countries and Regions Covered
2.3.3 Research Objective
2.3.4 Units, Currency, and Conversions
2.3.5 Industry Value Chain
2.4. Key Market Segments
2.5. Key Companies
2.6. Study Period
Chapter 3. Strategic Analysis Review
3.1. Blueberry Pricing Analysis and Forecast
3.2. Porter’s Five Forces
3.3. Market Ecosystem
3.4. SWOT Analysis
3.5. Regulatory Scenario
3.3. Effects of Inflation, Russia-Ukraine War, moderating economic growth, and other macroeconomic factors
Chapter 4. Competitive Landscape
4.1. Market Share Analysis
4.1.1. Global Blueberry Market Share by Company, 2023
4.1.2. Product Offerings of Leading Blueberry Companies
4.2. Market Entropy
4.2.1. New Product Launches in the Industry
4.2.2. Mergers, Acquisitions, Joint ventures, and Partnerships
4.3. Key Strategies and Best Practices
Chapter 5. Global Market Projections: Best, Reference, and Low Case Scenarios
5.1. Growth Analysis- Case Scenario Definitions
5.2. Low Growth Case Scenario Forecasts
5.3. Reference Growth Case Scenario Forecasts
5.4. High Growth Case Scenario Forecasts
Chapter 6. Market Dynamics
6.1. Blueberry Market Drivers
6.2. Blueberry Market Challenges
6.6. Blueberry Market Opportunities
6.4. Blueberry Market Trends
Chapter 7. Global Blueberry Market Outlook Trends
7.1. Global Blueberry Revenue (USD Million) and CAGR (%) by Type (2021-2032)
7.2. Global Blueberry Revenue (USD Million) and CAGR (%) by Application (2021-2032)
7.3. Global Blueberry Revenue (USD Million) and CAGR (%) by Product (2021-2032)
By Type
Organic
Conventional
By Application
Food and beverages
Bakery and confectionary
By Product
Fresh
Frozen
Dried
Chapter 8. Global Blueberry Regional Analysis and Outlook
8.1. Global Blueberry Revenue (USD Million) By Regions (2021- 2032)
8.2. North America Blueberry Revenue (USD Million) by Country (2021-2032)
8.2.1. United States Blueberry Regional Analysis and Outlook
8.2.2. Canada Blueberry Regional Analysis and Outlook
8.2.3. Mexico Blueberry Regional Analysis and Outlook
8.3. Europe Blueberry Revenue (USD Million), by Country (2021-2032)
8.3.1. Germany Blueberry Regional Analysis and Outlook
8.3.2. France Blueberry Regional Analysis and Outlook
8.3.3. United Kingdom Blueberry Regional Analysis and Outlook
8.3.4. Spain Blueberry Regional Analysis and Outlook
8.3.5. Italy Blueberry Regional Analysis and Outlook
8.3.6. Russia Blueberry Regional Analysis and Outlook
8.3.7. Rest of Europe Blueberry Regional Analysis and Outlook
8.4. Asia Pacific Blueberry Revenue (USD Million) by Country (2021-2032)
8.4.1. China Blueberry Regional Analysis and Outlook
8.4.2. Japan Blueberry Regional Analysis and Outlook
8.4.3. India Blueberry Regional Analysis and Outlook
8.4.4. South Korea Blueberry Regional Analysis and Outlook
8.4.5. Australia Blueberry Regional Analysis and Outlook
8.4.6. South East Asia Blueberry Regional Analysis and Outlook
8.4.7. Rest of Asia Pacific Blueberry Regional Analysis and Outlook
8.5. South America Blueberry Revenue (USD Million), by Country (2021-2032)
8.5.1. Brazil Blueberry Regional Analysis and Outlook
8.5.2. Argentina Blueberry Regional Analysis and Outlook
8.5.3. Rest of South America Blueberry Regional Analysis and Outlook
8.6. Middle East and Africa Blueberry Revenue (USD Million) by Country (2021-2032)
8.6.1. Middle East Blueberry Regional Analysis and Outlook
8.6.2. Africa Blueberry Regional Analysis and Outlook
Chapter 9. North America Blueberry Analysis and Outlook
9.1. North America Blueberry Revenue (USD Million) by Segments (2021-2032)
9.1.1. North America Blueberry Revenue (USD Million) by Type (2021-2032)
9.1.2. North America Blueberry Revenue (USD Million) by Application (2021-2032)
9.1.3. North America Blueberry Revenue (USD Million) by Product (2021-2032)
By Type
Organic
Conventional
By Application
Food and beverages
Bakery and confectionary
By Product
Fresh
Frozen
Dried
Chapter 10. Europe Blueberry Analysis and Outlook
10.1. Europe Blueberry Revenue (USD Million), by Segments (USD Million) (2021-2032)
10.1.1. Europe Blueberry Revenue (USD Million) by Type (2021-2032)
10.1.2. Europe Blueberry Revenue (USD Million) by Application (2021-2032)
10.1.3. Europe Blueberry Revenue (USD Million) by Product (2021-2032)
By Type
Organic
Conventional
By Application
Food and beverages
Bakery and confectionary
By Product
Fresh
Frozen
Dried
Chapter 11. Asia Pacific Blueberry Analysis and Outlook
11.1. Asia Pacific Blueberry Revenue (USD Million), and Revenue (USD Million) by Segments (2021-2032)
11.1.1. Asia Pacific Blueberry Revenue (USD Million) by Type (2021-2032)
11.1.2. Asia Pacific Blueberry Revenue (USD Million) by Application (2021-2032)
11.1.3. Asia Pacific Blueberry Revenue (USD Million) by Product (2021-2032)
By Type
Organic
Conventional
By Application
Food and beverages
Bakery and confectionary
By Product
Fresh
Frozen
Dried
Chapter 12. South America Blueberry Analysis and Outlook
12.1. South America Blueberry Revenue (USD Million), by Segments (2021-2032)
12.1.1. South America Blueberry Revenue (USD Million) by Type (2021-2032)
12.1.2. South America Blueberry Revenue (USD Million) by Application (2021-2032)
12.1.3. South America Blueberry Revenue (USD Million) by Product (2021-2032)
By Type
Organic
Conventional
By Application
Food and beverages
Bakery and confectionary
By Product
Fresh
Frozen
Dried
Chapter 13. Middle East and Africa Blueberry Analysis and Outlook
13.1. Middle East and Africa Blueberry Revenue (USD Million), by Segments (2021-2032)
13.1.1. Middle East and Africa Blueberry Revenue (USD Million) by Type (2021-2032)
13.1.2. Middle East and Africa Blueberry Revenue (USD Million) by Application (2021-2032)
13.1.3. Middle East and Africa Blueberry Revenue (USD Million) by Product (2021-2032)
By Type
Organic
Conventional
By Application
Food and beverages
Bakery and confectionary
By Product
Fresh
Frozen
Dried
Chapter 14. Blueberry Company Profiles
14.1 Business Overview
14.2 Product Profiles
14.3 SWOT Profiles
14.5 Recent Developments
14.6 Financial Profile
List of Companies
AGRANA Beteiligungs AG
Arctic Flavours Association
Ardo Coordination Center NV
Berry Plantation BETEC
BerryWorld Ltd
Bio Botanica Inc
BlueBerry LLC
Dealul cu Afine SRL
Dole Food Co. Inc
Driscolls Inc
Earthbound Farm
Harbin Gaotai Food Co. Ltd
J.R. Simplot Co.
JWM Asia Holdings
MBG Marketing
15. Methodology and Data Sources
15.1 Customization Offerings
15.2 Subscription Services
15.3 Related Reports
15.4 Publisher Expertise
LIST OF TABLES
Table 1 Market Segmentation Analysis
Table 2 Global Blueberry Market Share of Leading Companies, 2023
Table 3 Product Offerings of Leading Companies
Table 4 Low Growth Scenario Forecasts
Table 5 Reference Case Growth Scenario
Table 6 High Growth Case Scenario
Table 7 Global Blueberry Revenue (USD Million) And CAGR (%) By Type (2021-2032)
Table 8 Global Blueberry Revenue (USD Million) And CAGR (%) By Application (2021-2032)
Table 9 Global Blueberry Revenue (USD Million) And CAGR (%) By Product (2021-2032)
Table 10 Global Blueberry Market Revenue (USD Million) By Regions (2021-2032)
Table 11 Global Blueberry Market Share (%) By Regions (2021-2032)
Table 12 North America Blueberry Revenue (USD Million) By Country (2021-2032)
Table 13 Europe Blueberry Revenue (USD Million) By Country (2021-2032)
Table 14 Asia Pacific Blueberry Revenue (USD Million) By Country (2021-2032)
Table 15 South America Blueberry Revenue (USD Million) By Country (2021-2032)
Table 16 Middle East and Africa Blueberry Revenue (USD Million) By Region (2021-2032)
Table 17 North America Blueberry Revenue (USD Million) By Type (2021-2032)
Table 18 North America Blueberry Revenue (USD Million) By Application (2021-2032)
Table 19 North America Blueberry Revenue (USD Million) By Product (2021-2032)
Table 20 Europe Blueberry Revenue (USD Million) By Type (2021-2032)
Table 21 Europe Blueberry Revenue (USD Million) By Application (2021-2032)
Table 22 Europe Blueberry Revenue (USD Million) By Product (2021-2032)
Table 23 Asia Pacific Blueberry Revenue (USD Million) By Type (2021-2032)
Table 24 Asia Pacific Blueberry Revenue (USD Million) By Application (2021-2032)
Table 25 Asia Pacific Blueberry Revenue (USD Million) By Product (2021-2032)
Table 26 South America Blueberry Revenue (USD Million) By Type (2021-2032)
Table 27 South America Blueberry Revenue (USD Million) By Application (2021-2032)
Table 28 South America Blueberry Revenue (USD Million) By Product (2021-2032)
Table 29 Middle East and Africa Blueberry Revenue (USD Million) By Type (2021-2032)
Table 30 Middle East and Africa Blueberry Revenue (USD Million) By Application (2021-2032)
Table 31 Middle East and Africa Blueberry Revenue (USD Million) By Product (2021-2032)
LIST OF FIGURES
Figure 1. Market Scope
Figure 2. Pricing Forecasts Per Unit, 2023- 2032
Figure 3. Porter’s Five Forces
Figure 4. Global Blueberry Market Revenue (USD Million) By Regions (2021-2032)
Figure 5. Global Blueberry Market Share (%) By Regions (2023)
Figure 6. North America Blueberry Revenue (USD Million) By Country (2021-2032)
Figure 7. United States Blueberry Revenue (USD Million) By Country (2021-2032)
Figure 8. Canada Blueberry Revenue (USD Million) By Country (2021-2032)
Figure 9. Mexico Blueberry Revenue (USD Million) By Country (2021-2032)
Figure 10. Europe Blueberry Revenue (USD Million) By Country (2021-2032)
Figure 11. Germany Blueberry Revenue (USD Million) By Country (2021-2032)
Figure 12. France Blueberry Revenue (USD Million) By Country (2021-2032)
Figure 13. United Kingdom Blueberry Revenue (USD Million) By Country (2021-2032)
Figure 14. Spain Blueberry Revenue (USD Million) By Country (2021-2032)
Figure 15. Italy Blueberry Revenue (USD Million) By Country (2021-2032)
Figure 16. Russia Blueberry Revenue (USD Million) By Country (2021-2032)
Figure 17. Rest of Europe Blueberry Revenue (USD Million) By Country (2021-2032)
Figure 11. Asia Pacific Blueberry Revenue (USD Million) By Country (2021-2032)
Figure 12. China Blueberry Revenue (USD Million) By Country (2021-2032)
Figure 13. Japan Blueberry Revenue (USD Million) By Country (2021-2032)
Figure 14. India Blueberry Revenue (USD Million) By Country (2021-2032)
Figure 15. South Korea Blueberry Revenue (USD Million) By Country (2021-2032)
Figure 16. Australia Blueberry Revenue (USD Million) By Country (2021-2032)
Figure 17. South East Asia Blueberry Revenue (USD Million) By Country (2021-2032)
Figure 18. South America Blueberry Revenue (USD Million) By Country (2021-2032)
Figure 19. Brazil Blueberry Revenue (USD Million) By Country (2021-2032)
Figure 20. Argentina Blueberry Revenue (USD Million) By Country (2021-2032)
Figure 21. Rest of Asia Pacific Blueberry Revenue (USD Million) By Country (2021-2032)
Figure 22. Middle East and Africa Blueberry Revenue (USD Million) By Region (2021-2032)
Figure 23. Saudi Arabia Blueberry Revenue (USD Million) By Region (2021-2032)
Figure 24. The UAE Blueberry Revenue (USD Million) By Region (2021-2032)
Figure 25. Rest of Middle East Blueberry Revenue (USD Million) By Region (2021-2032)
Figure 26. South Africa Blueberry Revenue (USD Million) By Region (2021-2032)
Figure 27. Africa Blueberry Revenue (USD Million) By Region (2021-2032)
Figure 28. North America Blueberry Revenue (USD Million) By Type (2021-2032)
Figure 29. North America Blueberry Revenue (USD Million) By Application (2021-2032)
Figure 30. North America Blueberry Revenue (USD Million) By Product (2021-2032)
Figure 31. Europe Blueberry Revenue (USD Million) By Type (2021-2032)
Figure 32. Europe Blueberry Revenue (USD Million) By Application (2021-2032)
Figure 33. Europe Blueberry Revenue (USD Million) By Product (2021-2032)
Figure 34. Asia Pacific Blueberry Revenue (USD Million) By Type (2021-2032)
Figure 35. Asia Pacific Blueberry Revenue (USD Million) By Application (2021-2032)
Figure 36. Asia Pacific Blueberry Revenue (USD Million) By Product (2021-2032)
Figure 37. South America Blueberry Revenue (USD Million) By Type (2021-2032)
Figure 38. South America Blueberry Revenue (USD Million) By Application (2021-2032)
Figure 39. South America Blueberry Revenue (USD Million) By Product (2021-2032)
Figure 40. Middle East and Africa Blueberry Revenue (USD Million) By Type (2021-2032)
Figure 41. Middle East and Africa Blueberry Revenue (USD Million) By Application (2021-2032)
Figure 42. Middle East and Africa Blueberry Revenue (USD Million) By Product (2021-2032)
By Type
Organic
Conventional
By Application
Food and beverages
Bakery and confectionary
By Product
Fresh
Frozen
Dried
Countries Analyzed
North America (US, Canada, Mexico)
Europe (Germany, UK, France, Spain, Italy, Russia, Rest of Europe)
Asia Pacific (China, India, Japan, South Korea, Australia, South East Asia, Rest of Asia)
South America (Brazil, Argentina, Rest of South America)
Middle East and Africa (Saudi Arabia, UAE, Rest of Middle East, South Africa, Egypt, Rest of Africa)
