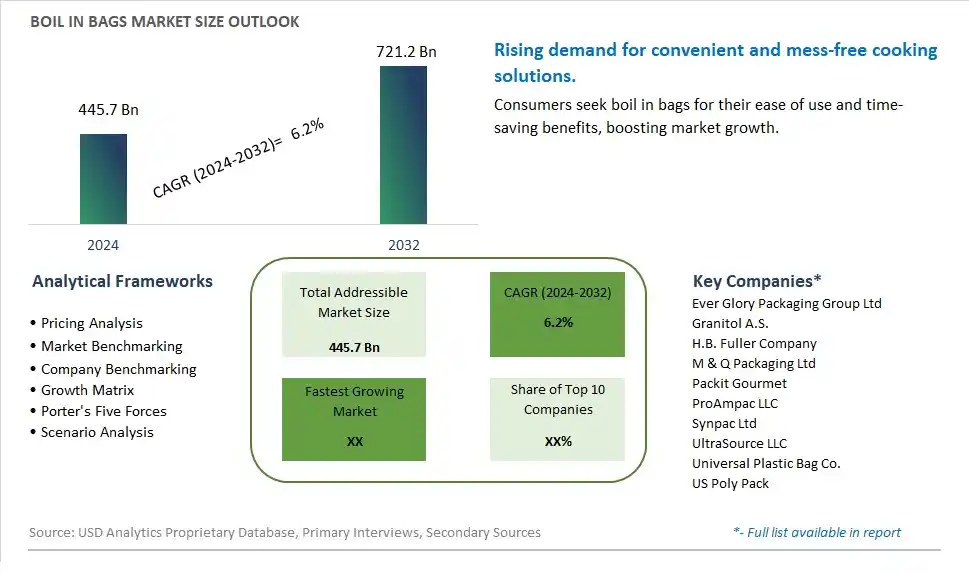
Global Boil in Bags Market Size is valued at $445.7 Billion in 2024 and is forecast to register a growth rate (CAGR) of 6.2% to reach $721.2 Billion by 2032.
The global Boil in Bags Market Comprehensive Study analyzes and forecasts the market size across 6 regions and 24 countries for diverse segments -By Material (Plastic, Aluminum Foil, Others), By Appearance (Transparent, Opaque, Printed), By Application (Frozen Food, Meat and Poultry, Sea Food, Others)
An Introduction to Boil in Bags Market
In 2024, boil-in-bags technology has revolutionized the convenience food sector, offering consumers hassle-free meal solutions without compromising on taste or nutrition. This innovative packaging format allows food products to be cooked directly in sealed pouches by immersing them in boiling water, eliminating the need for additional cookware and minimizing kitchen cleanup. Boil-in-bags have found widespread application across a diverse range of food categories, including rice, pasta, vegetables, and ready-to-eat meals, catering to busy lifestyles and changing consumption patterns. Manufacturers are continually innovating with advanced materials and cooking techniques to enhance product safety, convenience, and sensory attributes. Furthermore, the rise of e-commerce and on-the-go consumption has propelled the popularity of boil-in-bag products, driving market expansion and diversification. As consumers prioritize convenience without compromising on quality, boil-in-bags are poised to remain a staple in kitchens and on supermarket shelves worldwide.
Boil In Bags Competitive Landscape
The market report analyses the leading companies in the industry including Ever Glory Packaging Group Ltd, Granitol A.S., H.B. Fuller Company, M & Q Packaging Ltd, Packit Gourmet, ProAmpac LLC, Synpac Ltd, UltraSource LLC, Universal Plastic Bag Co., US Poly Pack, and Others.
Boil In Bags Market Dynamics
Boil In Bags Market Trend: Increasing Demand for Convenient and Ready-to-Cook Meal Solutions
One prominent trend in the boil in bags market is the increasing demand for convenient and ready-to-cook meal solutions. As consumers lead busier lifestyles and seek convenient meal options that require minimal preparation time, there's a growing preference for boil in bags products. These products offer the convenience of pre-portioned, pre-seasoned ingredients that can be quickly cooked by simply placing the sealed bags in boiling water. This trend is driven by the desire for hassle-free cooking experiences and the need for convenient meal solutions that cater to busy schedules, making boil in bags products increasingly popular among consumers looking for quick and easy meal options without compromising on taste or quality.
Market Driver: Growth of the Ready-to-Eat and Meal Kit Market Segments
A key driver in the boil in bags market is the growth of the ready-to-eat and meal kit market segments. With changing consumer preferences and increasing demand for convenient meal solutions, there's a rising interest in ready-to-eat meals and meal kits that offer convenience, variety, and customization. Boil in bags products align with this trend by providing a convenient cooking method for pre-prepared meal components, whether as standalone meals or as part of meal kit offerings. The expansion of the ready-to-eat and meal kit market segments drives the demand for boil in bags products as manufacturers and retailers respond to consumer demand for convenient, time-saving meal solutions that offer freshness, quality, and convenience.
Market Opportunity: Diversification into Healthier and Gourmet Meal Options
An emerging opportunity in the boil in bags market is the diversification into healthier and gourmet meal options. While boil in bags products have traditionally been associated with convenience and comfort foods, there's potential to expand into healthier and gourmet meal segments to cater to evolving consumer preferences for nutritious and upscale dining experiences. This presents an opportunity for manufacturers to innovate with premium ingredients, artisanal flavors, and healthier recipe formulations to create boil in bags products that appeal to health-conscious consumers and food enthusiasts alike. By offering a wider range of options, including vegetarian, vegan, gluten-free, and globally inspired cuisines, manufacturers can capitalize on the growing demand for convenient yet indulgent meal solutions that meet diverse dietary preferences and taste preferences.
Boil In Bags Market Share Analysis: Plastic held the dominant market share in 2024
The plastic segment commands the largest share in the Boil In Bags market due to its widespread usage, cost-effectiveness, and convenience. Plastic boil-in bags offer a versatile and lightweight packaging solution suitable for a wide range of food products, including vegetables, meats, seafood, and ready-to-eat meals. These bags are often made from food-grade polyethylene or polypropylene materials, providing excellent heat resistance and durability during the boiling process. Further, plastic boil-in bags are available in various sizes and shapes, catering to the diverse needs of consumers and food manufacturers. Additionally, the ease of sealing and opening, along with the transparent nature of plastic bags, allows for convenient storage, transportation, and visibility of the contents, further contributing to their popularity in the market. As a result, the plastic segment remains the largest in the Boil In Bags market, meeting the demand for practical and efficient food packaging solutions.
Boil In Bags Market Share Analysis: Printed market is poised to register the fastest growth rae over the forecast period to 2032
The printed segment is experiencing the fastest growth in the Boil In Bags market due to its ability to enhance brand visibility, communicate product information, and attract consumers' attention. Printed boil-in bags feature vibrant graphics, logos, and product details, making them stand out on store shelves and effectively conveying brand identity and product attributes. Additionally, printed bags offer a platform for manufacturers to showcase nutritional information, cooking instructions, and promotional messages, aiding consumers in making informed purchasing decisions. Further, the customization options available with printed bags allow for creative branding strategies, seasonal promotions, and product differentiation, driving consumer engagement and loyalty. As a result, the printed segment is the fastest-growing in the Boil In Bags market, meeting the evolving needs of brands and retailers for effective packaging solutions that combine functionality with marketing appeal.
Boil In Bags Market Share Analysis: Frozen Food held the dominant market share in 2024
The frozen food segment commands the largest share in the Boil In Bags market due to the widespread adoption of boil-in-bag packaging for convenience meals and frozen food products. Boil-in-bags offer a hassle-free cooking solution for frozen meals, allowing consumers to simply place the bag in boiling water to heat and serve the contents without the need for additional pots or pans. This convenience factor has driven the popularity of boil-in-bag packaging in the frozen food industry, where consumers seek convenient and time-saving meal options. Further, the ability of boil-in-bags to preserve food freshness and flavors during the freezing and cooking process further enhances their appeal for frozen food applications. As a result, the frozen food segment remains the largest in the Boil In Bags market, catering to the demands of busy consumers for convenient and ready-to-eat meal solutions.
Boil In Bags Market Segmentation
By Material
Plastic
Aluminum Foil
Others
By Appearance
Transparent
Opaque
Printed
By Application
Frozen Food
Meat and Poultry
Sea Food
Others
Countries Analyzed
North America (US, Canada, Mexico)
Europe (Germany, UK, France, Spain, Italy, Russia, Rest of Europe)
Asia Pacific (China, India, Japan, South Korea, Australia, South East Asia, Rest of Asia)
South America (Brazil, Argentina, Rest of South America)
Middle East and Africa (Saudi Arabia, UAE, Rest of Middle East, South Africa, Egypt, Rest of Africa)
Boil In Bags Companies Profiled in the Study
Ever Glory Packaging Group Ltd
Granitol A.S.
H.B. Fuller Company
M & Q Packaging Ltd
Packit Gourmet
ProAmpac LLC
Synpac Ltd
UltraSource LLC
Universal Plastic Bag Co.
US Poly Pack
*- List Not Exhaustive
Chapter 1. TABLE OF CONTENTS
Chapter 2. Introduction to Boil In Bags Market
2.1. Market Overview
2.2. Key Statistics and Report Highlights
2.3. Scope of the Comprehensive Study
2.3.1. Market Definition
2.3.2 Countries and Regions Covered
2.3.3 Research Objective
2.3.4 Units, Currency, and Conversions
2.3.5 Industry Value Chain
2.4. Key Market Segments
2.5. Key Companies
2.6. Study Period
Chapter 3. Strategic Analysis Review
3.1. Boil In Bags Pricing Analysis and Forecast
3.2. Porter’s Five Forces
3.3. Market Ecosystem
3.4. SWOT Analysis
3.5. Regulatory Scenario
3.3. Effects of Inflation, Russia-Ukraine War, moderating economic growth, and other macroeconomic factors
Chapter 4. Competitive Landscape
4.1. Market Share Analysis
4.1.1. Global Boil In Bags Market Share by Company, 2023
4.1.2. Product Offerings of Leading Boil In Bags Companies
4.2. Market Entropy
4.2.1. New Product Launches in the Industry
4.2.2. Mergers, Acquisitions, Joint ventures, and Partnerships
4.3. Key Strategies and Best Practices
Chapter 5. Global Market Projections: Best, Reference, and Low Case Scenarios
5.1. Growth Analysis- Case Scenario Definitions
5.2. Low Growth Case Scenario Forecasts
5.3. Reference Growth Case Scenario Forecasts
5.4. High Growth Case Scenario Forecasts
Chapter 6. Market Dynamics
6.1. Boil In Bags Market Drivers
6.2. Boil In Bags Market Challenges
6.6. Boil In Bags Market Opportunities
6.4. Boil In Bags Market Trends
Chapter 7. Global Boil In Bags Market Outlook Trends
7.1. Global Boil In Bags Revenue (USD Million) and CAGR (%) by Type (2021-2032)
7.2. Global Boil In Bags Revenue (USD Million) and CAGR (%) by Application (2021-2032)
7.3. Global Boil In Bags Revenue (USD Million) and CAGR (%) by Product (2021-2032)
By Material
Plastic
Aluminum Foil
Others
By Appearance
Transparent
Opaque
Printed
By Application
Frozen Food
Meat and Poultry
Sea Food
Others
Chapter 8. Global Boil In Bags Regional Analysis and Outlook
8.1. Global Boil In Bags Revenue (USD Million) By Regions (2021- 2032)
8.2. North America Boil In Bags Revenue (USD Million) by Country (2021-2032)
8.2.1. United States Boil In Bags Regional Analysis and Outlook
8.2.2. Canada Boil In Bags Regional Analysis and Outlook
8.2.3. Mexico Boil In Bags Regional Analysis and Outlook
8.3. Europe Boil In Bags Revenue (USD Million), by Country (2021-2032)
8.3.1. Germany Boil In Bags Regional Analysis and Outlook
8.3.2. France Boil In Bags Regional Analysis and Outlook
8.3.3. United Kingdom Boil In Bags Regional Analysis and Outlook
8.3.4. Spain Boil In Bags Regional Analysis and Outlook
8.3.5. Italy Boil In Bags Regional Analysis and Outlook
8.3.6. Russia Boil In Bags Regional Analysis and Outlook
8.3.7. Rest of Europe Boil In Bags Regional Analysis and Outlook
8.4. Asia Pacific Boil In Bags Revenue (USD Million) by Country (2021-2032)
8.4.1. China Boil In Bags Regional Analysis and Outlook
8.4.2. Japan Boil In Bags Regional Analysis and Outlook
8.4.3. India Boil In Bags Regional Analysis and Outlook
8.4.4. South Korea Boil In Bags Regional Analysis and Outlook
8.4.5. Australia Boil In Bags Regional Analysis and Outlook
8.4.6. South East Asia Boil In Bags Regional Analysis and Outlook
8.4.7. Rest of Asia Pacific Boil In Bags Regional Analysis and Outlook
8.5. South America Boil In Bags Revenue (USD Million), by Country (2021-2032)
8.5.1. Brazil Boil In Bags Regional Analysis and Outlook
8.5.2. Argentina Boil In Bags Regional Analysis and Outlook
8.5.3. Rest of South America Boil In Bags Regional Analysis and Outlook
8.6. Middle East and Africa Boil In Bags Revenue (USD Million) by Country (2021-2032)
8.6.1. Middle East Boil In Bags Regional Analysis and Outlook
8.6.2. Africa Boil In Bags Regional Analysis and Outlook
Chapter 9. North America Boil In Bags Analysis and Outlook
9.1. North America Boil In Bags Revenue (USD Million) by Segments (2021-2032)
9.1.1. North America Boil In Bags Revenue (USD Million) by Type (2021-2032)
9.1.2. North America Boil In Bags Revenue (USD Million) by Application (2021-2032)
9.1.3. North America Boil In Bags Revenue (USD Million) by Product (2021-2032)
By Material
Plastic
Aluminum Foil
Others
By Appearance
Transparent
Opaque
Printed
By Application
Frozen Food
Meat and Poultry
Sea Food
Others
Chapter 10. Europe Boil In Bags Analysis and Outlook
10.1. Europe Boil In Bags Revenue (USD Million), by Segments (USD Million) (2021-2032)
10.1.1. Europe Boil In Bags Revenue (USD Million) by Type (2021-2032)
10.1.2. Europe Boil In Bags Revenue (USD Million) by Application (2021-2032)
10.1.3. Europe Boil In Bags Revenue (USD Million) by Product (2021-2032)
By Material
Plastic
Aluminum Foil
Others
By Appearance
Transparent
Opaque
Printed
By Application
Frozen Food
Meat and Poultry
Sea Food
Others
Chapter 11. Asia Pacific Boil In Bags Analysis and Outlook
11.1. Asia Pacific Boil In Bags Revenue (USD Million), and Revenue (USD Million) by Segments (2021-2032)
11.1.1. Asia Pacific Boil In Bags Revenue (USD Million) by Type (2021-2032)
11.1.2. Asia Pacific Boil In Bags Revenue (USD Million) by Application (2021-2032)
11.1.3. Asia Pacific Boil In Bags Revenue (USD Million) by Product (2021-2032)
By Material
Plastic
Aluminum Foil
Others
By Appearance
Transparent
Opaque
Printed
By Application
Frozen Food
Meat and Poultry
Sea Food
Others
Chapter 12. South America Boil In Bags Analysis and Outlook
12.1. South America Boil In Bags Revenue (USD Million), by Segments (2021-2032)
12.1.1. South America Boil In Bags Revenue (USD Million) by Type (2021-2032)
12.1.2. South America Boil In Bags Revenue (USD Million) by Application (2021-2032)
12.1.3. South America Boil In Bags Revenue (USD Million) by Product (2021-2032)
By Material
Plastic
Aluminum Foil
Others
By Appearance
Transparent
Opaque
Printed
By Application
Frozen Food
Meat and Poultry
Sea Food
Others
Chapter 13. Middle East and Africa Boil In Bags Analysis and Outlook
13.1. Middle East and Africa Boil In Bags Revenue (USD Million), by Segments (2021-2032)
13.1.1. Middle East and Africa Boil In Bags Revenue (USD Million) by Type (2021-2032)
13.1.2. Middle East and Africa Boil In Bags Revenue (USD Million) by Application (2021-2032)
13.1.3. Middle East and Africa Boil In Bags Revenue (USD Million) by Product (2021-2032)
By Material
Plastic
Aluminum Foil
Others
By Appearance
Transparent
Opaque
Printed
By Application
Frozen Food
Meat and Poultry
Sea Food
Others
Chapter 14. Boil In Bags Company Profiles
14.1 Business Overview
14.2 Product Profiles
14.3 SWOT Profiles
14.5 Recent Developments
14.6 Financial Profile
List of Companies
Ever Glory Packaging Group Ltd
Granitol A.S.
H.B. Fuller Company
M & Q Packaging Ltd
Packit Gourmet
ProAmpac LLC
Synpac Ltd
UltraSource LLC
Universal Plastic Bag Co.
US Poly Pack
15. Methodology and Data Sources
15.1 Customization Offerings
15.2 Subscription Services
15.3 Related Reports
15.4 Publisher Expertise
LIST OF TABLES
Table 1 Market Segmentation Analysis
Table 2 Global Boil In Bags Market Share of Leading Companies, 2023
Table 3 Product Offerings of Leading Companies
Table 4 Low Growth Scenario Forecasts
Table 5 Reference Case Growth Scenario
Table 6 High Growth Case Scenario
Table 7 Global Boil In Bags Revenue (USD Million) And CAGR (%) By Type (2021-2032)
Table 8 Global Boil In Bags Revenue (USD Million) And CAGR (%) By Application (2021-2032)
Table 9 Global Boil In Bags Revenue (USD Million) And CAGR (%) By Product (2021-2032)
Table 10 Global Boil In Bags Market Revenue (USD Million) By Regions (2021-2032)
Table 11 Global Boil In Bags Market Share (%) By Regions (2021-2032)
Table 12 North America Boil In Bags Revenue (USD Million) By Country (2021-2032)
Table 13 Europe Boil In Bags Revenue (USD Million) By Country (2021-2032)
Table 14 Asia Pacific Boil In Bags Revenue (USD Million) By Country (2021-2032)
Table 15 South America Boil In Bags Revenue (USD Million) By Country (2021-2032)
Table 16 Middle East and Africa Boil In Bags Revenue (USD Million) By Region (2021-2032)
Table 17 North America Boil In Bags Revenue (USD Million) By Type (2021-2032)
Table 18 North America Boil In Bags Revenue (USD Million) By Application (2021-2032)
Table 19 North America Boil In Bags Revenue (USD Million) By Product (2021-2032)
Table 20 Europe Boil In Bags Revenue (USD Million) By Type (2021-2032)
Table 21 Europe Boil In Bags Revenue (USD Million) By Application (2021-2032)
Table 22 Europe Boil In Bags Revenue (USD Million) By Product (2021-2032)
Table 23 Asia Pacific Boil In Bags Revenue (USD Million) By Type (2021-2032)
Table 24 Asia Pacific Boil In Bags Revenue (USD Million) By Application (2021-2032)
Table 25 Asia Pacific Boil In Bags Revenue (USD Million) By Product (2021-2032)
Table 26 South America Boil In Bags Revenue (USD Million) By Type (2021-2032)
Table 27 South America Boil In Bags Revenue (USD Million) By Application (2021-2032)
Table 28 South America Boil In Bags Revenue (USD Million) By Product (2021-2032)
Table 29 Middle East and Africa Boil In Bags Revenue (USD Million) By Type (2021-2032)
Table 30 Middle East and Africa Boil In Bags Revenue (USD Million) By Application (2021-2032)
Table 31 Middle East and Africa Boil In Bags Revenue (USD Million) By Product (2021-2032)
LIST OF FIGURES
Figure 1. Market Scope
Figure 2. Pricing Forecasts Per Unit, 2023- 2032
Figure 3. Porter’s Five Forces
Figure 4. Global Boil In Bags Market Revenue (USD Million) By Regions (2021-2032)
Figure 5. Global Boil In Bags Market Share (%) By Regions (2023)
Figure 6. North America Boil In Bags Revenue (USD Million) By Country (2021-2032)
Figure 7. United States Boil In Bags Revenue (USD Million) By Country (2021-2032)
Figure 8. Canada Boil In Bags Revenue (USD Million) By Country (2021-2032)
Figure 9. Mexico Boil In Bags Revenue (USD Million) By Country (2021-2032)
Figure 10. Europe Boil In Bags Revenue (USD Million) By Country (2021-2032)
Figure 11. Germany Boil In Bags Revenue (USD Million) By Country (2021-2032)
Figure 12. France Boil In Bags Revenue (USD Million) By Country (2021-2032)
Figure 13. United Kingdom Boil In Bags Revenue (USD Million) By Country (2021-2032)
Figure 14. Spain Boil In Bags Revenue (USD Million) By Country (2021-2032)
Figure 15. Italy Boil In Bags Revenue (USD Million) By Country (2021-2032)
Figure 16. Russia Boil In Bags Revenue (USD Million) By Country (2021-2032)
Figure 17. Rest of Europe Boil In Bags Revenue (USD Million) By Country (2021-2032)
Figure 11. Asia Pacific Boil In Bags Revenue (USD Million) By Country (2021-2032)
Figure 12. China Boil In Bags Revenue (USD Million) By Country (2021-2032)
Figure 13. Japan Boil In Bags Revenue (USD Million) By Country (2021-2032)
Figure 14. India Boil In Bags Revenue (USD Million) By Country (2021-2032)
Figure 15. South Korea Boil In Bags Revenue (USD Million) By Country (2021-2032)
Figure 16. Australia Boil In Bags Revenue (USD Million) By Country (2021-2032)
Figure 17. South East Asia Boil In Bags Revenue (USD Million) By Country (2021-2032)
Figure 18. South America Boil In Bags Revenue (USD Million) By Country (2021-2032)
Figure 19. Brazil Boil In Bags Revenue (USD Million) By Country (2021-2032)
Figure 20. Argentina Boil In Bags Revenue (USD Million) By Country (2021-2032)
Figure 21. Rest of Asia Pacific Boil In Bags Revenue (USD Million) By Country (2021-2032)
Figure 22. Middle East and Africa Boil In Bags Revenue (USD Million) By Region (2021-2032)
Figure 23. Saudi Arabia Boil In Bags Revenue (USD Million) By Region (2021-2032)
Figure 24. The UAE Boil In Bags Revenue (USD Million) By Region (2021-2032)
Figure 25. Rest of Middle East Boil In Bags Revenue (USD Million) By Region (2021-2032)
Figure 26. South Africa Boil In Bags Revenue (USD Million) By Region (2021-2032)
Figure 27. Africa Boil In Bags Revenue (USD Million) By Region (2021-2032)
Figure 28. North America Boil In Bags Revenue (USD Million) By Type (2021-2032)
Figure 29. North America Boil In Bags Revenue (USD Million) By Application (2021-2032)
Figure 30. North America Boil In Bags Revenue (USD Million) By Product (2021-2032)
Figure 31. Europe Boil In Bags Revenue (USD Million) By Type (2021-2032)
Figure 32. Europe Boil In Bags Revenue (USD Million) By Application (2021-2032)
Figure 33. Europe Boil In Bags Revenue (USD Million) By Product (2021-2032)
Figure 34. Asia Pacific Boil In Bags Revenue (USD Million) By Type (2021-2032)
Figure 35. Asia Pacific Boil In Bags Revenue (USD Million) By Application (2021-2032)
Figure 36. Asia Pacific Boil In Bags Revenue (USD Million) By Product (2021-2032)
Figure 37. South America Boil In Bags Revenue (USD Million) By Type (2021-2032)
Figure 38. South America Boil In Bags Revenue (USD Million) By Application (2021-2032)
Figure 39. South America Boil In Bags Revenue (USD Million) By Product (2021-2032)
Figure 40. Middle East and Africa Boil In Bags Revenue (USD Million) By Type (2021-2032)
Figure 41. Middle East and Africa Boil In Bags Revenue (USD Million) By Application (2021-2032)
Figure 42. Middle East and Africa Boil In Bags Revenue (USD Million) By Product (2021-2032)
By Material
Plastic
Aluminum Foil
Others
By Appearance
Transparent
Opaque
Printed
By Application
Frozen Food
Meat and Poultry
Sea Food
Others
Countries Analyzed
North America (US, Canada, Mexico)
Europe (Germany, UK, France, Spain, Italy, Russia, Rest of Europe)
Asia Pacific (China, India, Japan, South Korea, Australia, South East Asia, Rest of Asia)
South America (Brazil, Argentina, Rest of South America)
Middle East and Africa (Saudi Arabia, UAE, Rest of Middle East, South Africa, Egypt, Rest of Africa)
