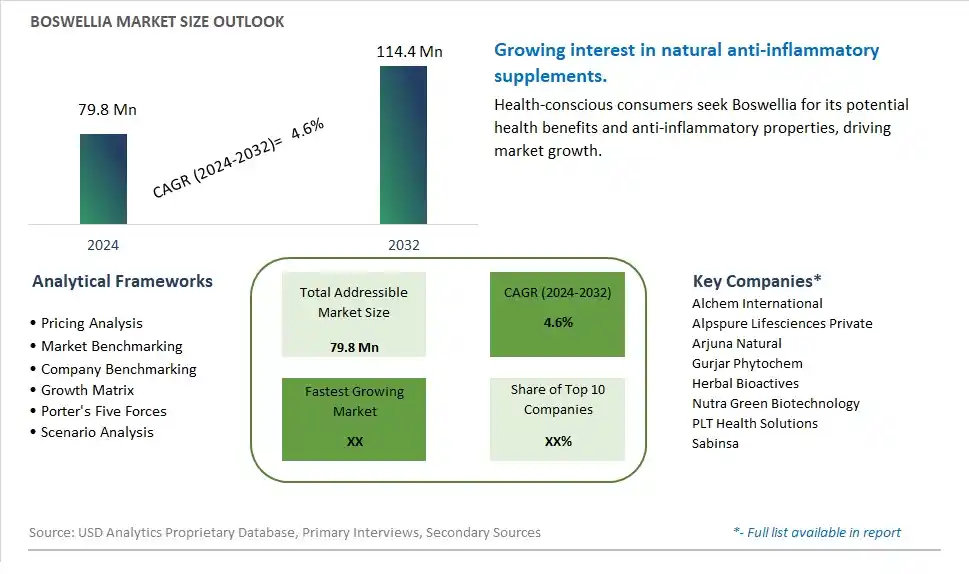
Global Boswellia Market Size is valued at $79.8 Million in 2024 and is forecast to register a growth rate (CAGR) of 4.6% to reach $114.4 Million by 2032.
The global Boswellia Market Comprehensive Study analyzes and forecasts the market size across 6 regions and 24 countries for diverse segments -By Type (Resins, Essential Oils, Extracts), By Application (Food Supplements, Herbal Medicinal Products, Aromatherapy, Personal Care Products, Others)
An Introduction to Boswellia Market
The Boswellia market in 2024 is expanding rapidly, driven by the growing awareness of its medicinal properties and applications in the health and wellness sector. Boswellia, also known as frankincense, is prized for its anti-inflammatory and analgesic properties, making it a popular ingredient in dietary supplements, herbal remedies, and topical treatments. The market is supported by increasing consumer interest in natural and holistic health solutions. Advances in extraction and formulation technologies are enhancing the purity, potency, and efficacy of boswellia products. The market is also benefiting from the trend towards clean-label and organic products, appealing to health-conscious consumers seeking natural remedies for various health conditions.
Boswellia Competitive Landscape
The market report analyses the leading companies in the industry including Alchem International, Alpspure Lifesciences Private, Arjuna Natural, Gurjar Phytochem, Herbal Bioactives, Nutra Green Biotechnology, PLT Health Solutions, Sabinsa, and Others.
Boswellia Market Dynamics
Boswellia Market Trend: Rising Demand for Natural and Herbal Supplements
One prominent market trend for Boswellia is the rising demand for natural and herbal supplements. Consumers are increasingly turning to alternative medicine and natural remedies to support their health and well-being. Boswellia, known for its anti-inflammatory properties and potential health benefits, has gained popularity as a supplement for joint health, pain relief, and overall wellness. This trend reflects a growing preference for natural and plant-based products in the healthcare and wellness industry.
Boswellia Market Driver: Increasing Awareness of Health Benefits
A significant market driver for Boswellia is the increasing awareness of its health benefits among consumers. Studies and research highlighting the anti-inflammatory and antioxidant properties of Boswellia have contributed to its recognition as a valuable supplement for managing conditions such as arthritis, inflammation-related disorders, and respiratory ailments. The growing awareness of these health benefits has led to higher demand and adoption of Boswellia supplements among health-conscious individuals seeking natural remedies.
Boswellia Market Opportunity: Diversification into Functional Foods and Beverages
A potential opportunity within the Boswellia market lies in diversifying into functional foods and beverages. With the rising trend of functional ingredients and health-enhancing products, incorporating Boswellia extract into food and beverage formulations presents an opportunity to reach a wider consumer base. Manufacturers can explore developing Boswellia-infused products such as teas, juices, snacks, and dietary supplements to offer consumers convenient and innovative ways to incorporate the benefits of Boswellia into their daily diet. This expansion into functional foods and beverages can open up new market segments and revenue streams for Boswellia-based products.
Boswellia Market Share Analysis: Resins segment generated the highest revenue share in the industry
The Resins segment stands out as the largest within the Boswellia Market, holding a substantial share of the overall market. This segment's dominance can be attributed to several key factors that contribute to its growth and market appeal. Firstly, Boswellia resin has a long history of traditional use in various cultures for its therapeutic properties, particularly in Ayurvedic and traditional medicine systems. The increasing awareness and acceptance of natural remedies and alternative medicine practices globally have fueled the demand for Boswellia resin products. Additionally, the versatility of Boswellia resin in formulations for dietary supplements, herbal remedies, and skincare products has expanded its market reach across diverse industries. The growing interest in wellness and holistic health approaches among consumers has further propelled the demand for Boswellia resin-based products. Further, advancements in extraction technologies have enabled manufacturers to produce high-quality Boswellia resin extracts, catering to the specific needs and preferences of consumers. As a result, the Resins segment continues to maintain its lead in the Boswellia Market, presenting opportunities for market players to innovate and capitalize on the growing demand for natural health and wellness solutions.
Boswellia Market Share Analysis: Aromatherapy is the fastest growing segment over the forecast period to 2032
The Aromatherapy segment within the Boswellia Market is experiencing rapid growth and is projected to continue expanding significantly until 2032. This surge can be attributed to several key factors that drive the demand for Boswellia products in aromatherapy applications. Firstly, there is a growing interest in natural and holistic approaches to health and wellness, leading consumers to explore aromatherapy as a therapeutic practice. Boswellia essential oils, known for their anti-inflammatory and stress-relieving properties, are increasingly favored by aromatherapy practitioners and enthusiasts. The versatility of Boswellia essential oil in diffusers, massage oils, and topical applications further contributes to its popularity in aromatherapy practices. Further, the rise in stress-related health concerns, coupled with the growing awareness of mental health benefits associated with aromatherapy, has propelled the demand for Boswellia essential oils. Additionally, collaborations between aromatherapy practitioners, wellness centers, and product manufacturers have created new avenues for introducing Boswellia-based aromatherapy products to a wider consumer base. As a result, the Aromatherapy segment emerges as the fastest-growing segment within the Boswellia Market, offering significant opportunities for market players to cater to the increasing demand for natural and therapeutic aromatic solutions.
Boswellia Market Segmentation
By Type
Resins
Essential Oils
Extracts
By Application
Food Supplements
Herbal Medicinal Products
Aromatherapy
Personal Care Products
Others
Countries Analyzed
North America (US, Canada, Mexico)
Europe (Germany, UK, France, Spain, Italy, Russia, Rest of Europe)
Asia Pacific (China, India, Japan, South Korea, Australia, South East Asia, Rest of Asia)
South America (Brazil, Argentina, Rest of South America)
Middle East and Africa (Saudi Arabia, UAE, Rest of Middle East, South Africa, Egypt, Rest of Africa)
Boswellia Companies Profiled in the Study
Alchem International
Alpspure Lifesciences Private
Arjuna Natural
Gurjar Phytochem
Herbal Bioactives
Nutra Green Biotechnology
PLT Health Solutions
Sabinsa
*- List Not Exhaustive
Chapter 1. TABLE OF CONTENTS
Chapter 2. Introduction to Boswellia Market
2.1. Market Overview
2.2. Key Statistics and Report Highlights
2.3. Scope of the Comprehensive Study
2.3.1. Market Definition
2.3.2 Countries and Regions Covered
2.3.3 Research Objective
2.3.4 Units, Currency, and Conversions
2.3.5 Industry Value Chain
2.4. Key Market Segments
2.5. Key Companies
2.6. Study Period
Chapter 3. Strategic Analysis Review
3.1. Boswellia Pricing Analysis and Forecast
3.2. Porter’s Five Forces
3.3. Market Ecosystem
3.4. SWOT Analysis
3.5. Regulatory Scenario
3.3. Effects of Inflation, Russia-Ukraine War, moderating economic growth, and other macroeconomic factors
Chapter 4. Competitive Landscape
4.1. Market Share Analysis
4.1.1. Global Boswellia Market Share by Company, 2023
4.1.2. Product Offerings of Leading Boswellia Companies
4.2. Market Entropy
4.2.1. New Product Launches in the Industry
4.2.2. Mergers, Acquisitions, Joint ventures, and Partnerships
4.3. Key Strategies and Best Practices
Chapter 5. Global Market Projections: Best, Reference, and Low Case Scenarios
5.1. Growth Analysis- Case Scenario Definitions
5.2. Low Growth Case Scenario Forecasts
5.3. Reference Growth Case Scenario Forecasts
5.4. High Growth Case Scenario Forecasts
Chapter 6. Market Dynamics
6.1. Boswellia Market Drivers
6.2. Boswellia Market Challenges
6.6. Boswellia Market Opportunities
6.4. Boswellia Market Trends
Chapter 7. Global Boswellia Market Outlook Trends
7.1. Global Boswellia Revenue (USD Million) and CAGR (%) by Type (2021-2032)
7.2. Global Boswellia Revenue (USD Million) and CAGR (%) by Application (2021-2032)
7.3. Global Boswellia Revenue (USD Million) and CAGR (%) by Product (2021-2032)
By Type
Resins
Essential Oils
Extracts
By Application
Food Supplements
Herbal Medicinal Products
Aromatherapy
Personal Care Products
Others
Chapter 8. Global Boswellia Regional Analysis and Outlook
8.1. Global Boswellia Revenue (USD Million) By Regions (2021- 2032)
8.2. North America Boswellia Revenue (USD Million) by Country (2021-2032)
8.2.1. United States Boswellia Regional Analysis and Outlook
8.2.2. Canada Boswellia Regional Analysis and Outlook
8.2.3. Mexico Boswellia Regional Analysis and Outlook
8.3. Europe Boswellia Revenue (USD Million), by Country (2021-2032)
8.3.1. Germany Boswellia Regional Analysis and Outlook
8.3.2. France Boswellia Regional Analysis and Outlook
8.3.3. United Kingdom Boswellia Regional Analysis and Outlook
8.3.4. Spain Boswellia Regional Analysis and Outlook
8.3.5. Italy Boswellia Regional Analysis and Outlook
8.3.6. Russia Boswellia Regional Analysis and Outlook
8.3.7. Rest of Europe Boswellia Regional Analysis and Outlook
8.4. Asia Pacific Boswellia Revenue (USD Million) by Country (2021-2032)
8.4.1. China Boswellia Regional Analysis and Outlook
8.4.2. Japan Boswellia Regional Analysis and Outlook
8.4.3. India Boswellia Regional Analysis and Outlook
8.4.4. South Korea Boswellia Regional Analysis and Outlook
8.4.5. Australia Boswellia Regional Analysis and Outlook
8.4.6. South East Asia Boswellia Regional Analysis and Outlook
8.4.7. Rest of Asia Pacific Boswellia Regional Analysis and Outlook
8.5. South America Boswellia Revenue (USD Million), by Country (2021-2032)
8.5.1. Brazil Boswellia Regional Analysis and Outlook
8.5.2. Argentina Boswellia Regional Analysis and Outlook
8.5.3. Rest of South America Boswellia Regional Analysis and Outlook
8.6. Middle East and Africa Boswellia Revenue (USD Million) by Country (2021-2032)
8.6.1. Middle East Boswellia Regional Analysis and Outlook
8.6.2. Africa Boswellia Regional Analysis and Outlook
Chapter 9. North America Boswellia Analysis and Outlook
9.1. North America Boswellia Revenue (USD Million) by Segments (2021-2032)
9.1.1. North America Boswellia Revenue (USD Million) by Type (2021-2032)
9.1.2. North America Boswellia Revenue (USD Million) by Application (2021-2032)
9.1.3. North America Boswellia Revenue (USD Million) by Product (2021-2032)
By Type
Resins
Essential Oils
Extracts
By Application
Food Supplements
Herbal Medicinal Products
Aromatherapy
Personal Care Products
Others
Chapter 10. Europe Boswellia Analysis and Outlook
10.1. Europe Boswellia Revenue (USD Million), by Segments (USD Million) (2021-2032)
10.1.1. Europe Boswellia Revenue (USD Million) by Type (2021-2032)
10.1.2. Europe Boswellia Revenue (USD Million) by Application (2021-2032)
10.1.3. Europe Boswellia Revenue (USD Million) by Product (2021-2032)
By Type
Resins
Essential Oils
Extracts
By Application
Food Supplements
Herbal Medicinal Products
Aromatherapy
Personal Care Products
Others
Chapter 11. Asia Pacific Boswellia Analysis and Outlook
11.1. Asia Pacific Boswellia Revenue (USD Million), and Revenue (USD Million) by Segments (2021-2032)
11.1.1. Asia Pacific Boswellia Revenue (USD Million) by Type (2021-2032)
11.1.2. Asia Pacific Boswellia Revenue (USD Million) by Application (2021-2032)
11.1.3. Asia Pacific Boswellia Revenue (USD Million) by Product (2021-2032)
By Type
Resins
Essential Oils
Extracts
By Application
Food Supplements
Herbal Medicinal Products
Aromatherapy
Personal Care Products
Others
Chapter 12. South America Boswellia Analysis and Outlook
12.1. South America Boswellia Revenue (USD Million), by Segments (2021-2032)
12.1.1. South America Boswellia Revenue (USD Million) by Type (2021-2032)
12.1.2. South America Boswellia Revenue (USD Million) by Application (2021-2032)
12.1.3. South America Boswellia Revenue (USD Million) by Product (2021-2032)
By Type
Resins
Essential Oils
Extracts
By Application
Food Supplements
Herbal Medicinal Products
Aromatherapy
Personal Care Products
Others
Chapter 13. Middle East and Africa Boswellia Analysis and Outlook
13.1. Middle East and Africa Boswellia Revenue (USD Million), by Segments (2021-2032)
13.1.1. Middle East and Africa Boswellia Revenue (USD Million) by Type (2021-2032)
13.1.2. Middle East and Africa Boswellia Revenue (USD Million) by Application (2021-2032)
13.1.3. Middle East and Africa Boswellia Revenue (USD Million) by Product (2021-2032)
By Type
Resins
Essential Oils
Extracts
By Application
Food Supplements
Herbal Medicinal Products
Aromatherapy
Personal Care Products
Others
Chapter 14. Boswellia Company Profiles
14.1 Business Overview
14.2 Product Profiles
14.3 SWOT Profiles
14.5 Recent Developments
14.6 Financial Profile
List of Companies
Alchem International
Alpspure Lifesciences Private
Arjuna Natural
Gurjar Phytochem
Herbal Bioactives
Nutra Green Biotechnology
PLT Health Solutions
Sabinsa
15. Methodology and Data Sources
15.1 Customization Offerings
15.2 Subscription Services
15.3 Related Reports
15.4 Publisher Expertise
LIST OF TABLES
Table 1 Market Segmentation Analysis
Table 2 Global Boswellia Market Share of Leading Companies, 2023
Table 3 Product Offerings of Leading Companies
Table 4 Low Growth Scenario Forecasts
Table 5 Reference Case Growth Scenario
Table 6 High Growth Case Scenario
Table 7 Global Boswellia Revenue (USD Million) And CAGR (%) By Type (2021-2032)
Table 8 Global Boswellia Revenue (USD Million) And CAGR (%) By Application (2021-2032)
Table 9 Global Boswellia Revenue (USD Million) And CAGR (%) By Product (2021-2032)
Table 10 Global Boswellia Market Revenue (USD Million) By Regions (2021-2032)
Table 11 Global Boswellia Market Share (%) By Regions (2021-2032)
Table 12 North America Boswellia Revenue (USD Million) By Country (2021-2032)
Table 13 Europe Boswellia Revenue (USD Million) By Country (2021-2032)
Table 14 Asia Pacific Boswellia Revenue (USD Million) By Country (2021-2032)
Table 15 South America Boswellia Revenue (USD Million) By Country (2021-2032)
Table 16 Middle East and Africa Boswellia Revenue (USD Million) By Region (2021-2032)
Table 17 North America Boswellia Revenue (USD Million) By Type (2021-2032)
Table 18 North America Boswellia Revenue (USD Million) By Application (2021-2032)
Table 19 North America Boswellia Revenue (USD Million) By Product (2021-2032)
Table 20 Europe Boswellia Revenue (USD Million) By Type (2021-2032)
Table 21 Europe Boswellia Revenue (USD Million) By Application (2021-2032)
Table 22 Europe Boswellia Revenue (USD Million) By Product (2021-2032)
Table 23 Asia Pacific Boswellia Revenue (USD Million) By Type (2021-2032)
Table 24 Asia Pacific Boswellia Revenue (USD Million) By Application (2021-2032)
Table 25 Asia Pacific Boswellia Revenue (USD Million) By Product (2021-2032)
Table 26 South America Boswellia Revenue (USD Million) By Type (2021-2032)
Table 27 South America Boswellia Revenue (USD Million) By Application (2021-2032)
Table 28 South America Boswellia Revenue (USD Million) By Product (2021-2032)
Table 29 Middle East and Africa Boswellia Revenue (USD Million) By Type (2021-2032)
Table 30 Middle East and Africa Boswellia Revenue (USD Million) By Application (2021-2032)
Table 31 Middle East and Africa Boswellia Revenue (USD Million) By Product (2021-2032)
LIST OF FIGURES
Figure 1. Market Scope
Figure 2. Pricing Forecasts Per Unit, 2023- 2032
Figure 3. Porter’s Five Forces
Figure 4. Global Boswellia Market Revenue (USD Million) By Regions (2021-2032)
Figure 5. Global Boswellia Market Share (%) By Regions (2023)
Figure 6. North America Boswellia Revenue (USD Million) By Country (2021-2032)
Figure 7. United States Boswellia Revenue (USD Million) By Country (2021-2032)
Figure 8. Canada Boswellia Revenue (USD Million) By Country (2021-2032)
Figure 9. Mexico Boswellia Revenue (USD Million) By Country (2021-2032)
Figure 10. Europe Boswellia Revenue (USD Million) By Country (2021-2032)
Figure 11. Germany Boswellia Revenue (USD Million) By Country (2021-2032)
Figure 12. France Boswellia Revenue (USD Million) By Country (2021-2032)
Figure 13. United Kingdom Boswellia Revenue (USD Million) By Country (2021-2032)
Figure 14. Spain Boswellia Revenue (USD Million) By Country (2021-2032)
Figure 15. Italy Boswellia Revenue (USD Million) By Country (2021-2032)
Figure 16. Russia Boswellia Revenue (USD Million) By Country (2021-2032)
Figure 17. Rest of Europe Boswellia Revenue (USD Million) By Country (2021-2032)
Figure 11. Asia Pacific Boswellia Revenue (USD Million) By Country (2021-2032)
Figure 12. China Boswellia Revenue (USD Million) By Country (2021-2032)
Figure 13. Japan Boswellia Revenue (USD Million) By Country (2021-2032)
Figure 14. India Boswellia Revenue (USD Million) By Country (2021-2032)
Figure 15. South Korea Boswellia Revenue (USD Million) By Country (2021-2032)
Figure 16. Australia Boswellia Revenue (USD Million) By Country (2021-2032)
Figure 17. South East Asia Boswellia Revenue (USD Million) By Country (2021-2032)
Figure 18. South America Boswellia Revenue (USD Million) By Country (2021-2032)
Figure 19. Brazil Boswellia Revenue (USD Million) By Country (2021-2032)
Figure 20. Argentina Boswellia Revenue (USD Million) By Country (2021-2032)
Figure 21. Rest of Asia Pacific Boswellia Revenue (USD Million) By Country (2021-2032)
Figure 22. Middle East and Africa Boswellia Revenue (USD Million) By Region (2021-2032)
Figure 23. Saudi Arabia Boswellia Revenue (USD Million) By Region (2021-2032)
Figure 24. The UAE Boswellia Revenue (USD Million) By Region (2021-2032)
Figure 25. Rest of Middle East Boswellia Revenue (USD Million) By Region (2021-2032)
Figure 26. South Africa Boswellia Revenue (USD Million) By Region (2021-2032)
Figure 27. Africa Boswellia Revenue (USD Million) By Region (2021-2032)
Figure 28. North America Boswellia Revenue (USD Million) By Type (2021-2032)
Figure 29. North America Boswellia Revenue (USD Million) By Application (2021-2032)
Figure 30. North America Boswellia Revenue (USD Million) By Product (2021-2032)
Figure 31. Europe Boswellia Revenue (USD Million) By Type (2021-2032)
Figure 32. Europe Boswellia Revenue (USD Million) By Application (2021-2032)
Figure 33. Europe Boswellia Revenue (USD Million) By Product (2021-2032)
Figure 34. Asia Pacific Boswellia Revenue (USD Million) By Type (2021-2032)
Figure 35. Asia Pacific Boswellia Revenue (USD Million) By Application (2021-2032)
Figure 36. Asia Pacific Boswellia Revenue (USD Million) By Product (2021-2032)
Figure 37. South America Boswellia Revenue (USD Million) By Type (2021-2032)
Figure 38. South America Boswellia Revenue (USD Million) By Application (2021-2032)
Figure 39. South America Boswellia Revenue (USD Million) By Product (2021-2032)
Figure 40. Middle East and Africa Boswellia Revenue (USD Million) By Type (2021-2032)
Figure 41. Middle East and Africa Boswellia Revenue (USD Million) By Application (2021-2032)
Figure 42. Middle East and Africa Boswellia Revenue (USD Million) By Product (2021-2032)
By Type
Resins
Essential Oils
Extracts
By Application
Food Supplements
Herbal Medicinal Products
Aromatherapy
Personal Care Products
Others
Countries Analyzed
North America (US, Canada, Mexico)
Europe (Germany, UK, France, Spain, Italy, Russia, Rest of Europe)
Asia Pacific (China, India, Japan, South Korea, Australia, South East Asia, Rest of Asia)
South America (Brazil, Argentina, Rest of South America)
Middle East and Africa (Saudi Arabia, UAE, Rest of Middle East, South Africa, Egypt, Rest of Africa)
