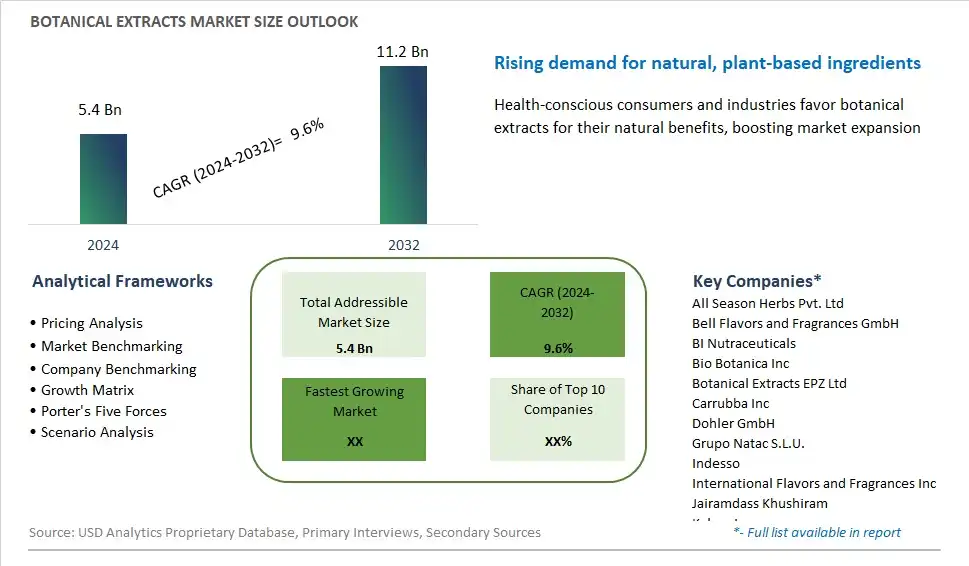
Global Botanical Extracts Market Size is valued at $5.4 Billion in 2024 and is forecast to register a growth rate (CAGR) of 9.6% to reach $11.2 Billion by 2032.
The global Botanical Extracts Market Comprehensive Study analyzes and forecasts the market size across 6 regions and 24 countries for diverse segments -By Source (Spices, Herbs, Flowers, Tea Leaves), By Application (Food, Beverages), By Type (Powder, Liquid)
An Introduction to Botanical Extracts Market
Botanical extracts are natural compounds derived from plants and herbs used for their therapeutic, flavoring, and functional properties in various industries in 2024. These extracts contain bioactive compounds such as polyphenols, flavonoids, and terpenes that exhibit antioxidant, antimicrobial, and anti-inflammatory effects, making them valuable ingredients in dietary supplements, functional foods, and personal care products. With growing interest in natural remedies and plant-based wellness solutions, botanical extracts are gaining popularity as ingredients that promote health and enhance sensory experiences. From green tea and turmeric to ginseng and echinacea, botanical extracts offer a wide range of flavors and health benefits that appeal to consumers seeking holistic approaches to health and well-being. As research advances and consumer demand for clean-label products increases, the market for botanical extracts is expected to expand, driven by innovation in extraction methods, formulation techniques, and product applications that harness the power of nature to improve human health and quality of life.
Botanical Extracts Competitive Landscape
The market report analyses the leading companies in the industry including All Season Herbs Pvt. Ltd, Bell Flavors and Fragrances GmbH, BI Nutraceuticals, Bio Botanica Inc, Botanical Extracts EPZ Ltd, Carrubba Inc, Dohler GmbH, Grupo Natac S.L.U., Indesso, International Flavors and Fragrances Inc, Jairamdass Khushiram, Kalsec Inc, Kerry Group Plc, MB Holding GmbH and Co. KG, NEXIRA SAS, and Others.
Botanical Extracts Market Dynamics
Botanical Extracts Market Trend: Growing Demand for Natural and Functional Ingredients
One prominent trend in the botanical extracts market is the growing demand for natural and functional ingredients across various industries. Consumers are increasingly seeking products made with natural ingredients, driven by concerns about health, sustainability, and environmental impact. Botanical extracts, derived from plants such as herbs, fruits, and flowers, are valued for their rich phytochemical content and potential health benefits, including antioxidant, anti-inflammatory, and immune-boosting properties. This trend is fueled by factors such as rising consumer awareness of wellness and preventive healthcare, clean label preferences, and the shift towards holistic and plant-based lifestyles. As a result, there's a growing market demand for botanical extracts as key ingredients in food and beverages, dietary supplements, personal care products, and pharmaceuticals. Manufacturers are responding to this trend by expanding their portfolio of botanical extract offerings, exploring novel plant sources, and developing innovative formulations to meet the evolving needs and preferences of consumers for natural, functional, and health-promoting products.
Market Driver: Increasing Consumer Interest in Plant-Based Solutions
A key driver propelling the growth of the botanical extracts market is the increasing consumer interest in plant-based solutions for health and wellness. With growing concerns about the environmental impact of animal agriculture, ethical considerations, and the desire for healthier and more sustainable lifestyles, consumers are turning to plant-based alternatives for their dietary and lifestyle choices. Botanical extracts offer a versatile and sustainable solution as natural ingredients derived from plants, aligning with the growing demand for plant-based foods, beverages, and personal care products. This driver is reinforced by factors such as changing dietary habits, the rise of veganism and vegetarianism, and the perception of plant-based products as healthier and more environmentally friendly options. As consumers seek cleaner, greener, and more ethical choices, there's a growing market opportunity for botanical extracts as functional ingredients and natural remedies that support health and well-being. Manufacturers can leverage this driver by developing innovative botanical extract formulations tailored to specific health concerns, lifestyle preferences, and market trends, catering to the growing demand for plant-based solutions across various industries.
Market Opportunity: Expansion into Functional Food and Nutraceutical Applications
An opportunity within the botanical extracts market lies in the expansion into functional food and nutraceutical applications to capitalize on the growing demand for natural health and wellness products. Functional foods and nutraceuticals, which offer health benefits beyond basic nutrition, are gaining popularity as consumers seek proactive approaches to health management and preventive healthcare. Botanical extracts, with their diverse phytochemical profiles and bioactive compounds, offer immense potential for formulating functional food and nutraceutical products targeted at specific health concerns and wellness goals. For example, botanical extracts rich in polyphenols, flavonoids, and other phytonutrients can be incorporated into functional beverages, snacks, and supplements aimed at promoting heart health, cognitive function, immune support, and skin beauty. Additionally, botanical extracts with adaptogenic properties, such as ashwagandha, rhodiola, and holy basil, are gaining traction for their stress-relieving and mood-enhancing benefits, presenting opportunities for innovative product development in the mental wellness category. By positioning botanical extracts as key ingredients in functional food and nutraceutical formulations, manufacturers can tap into the growing market for natural health solutions, differentiate their products, and meet the evolving needs of health-conscious consumers seeking holistic approaches to wellness.
Botanical Extracts Market Share Analysis: Herbs held the dominant market share in 2024
In the Botanical Extracts Market segmented by source, the herbs segment is the largest, driven by several significant factors. Herbs have been utilized for centuries for their medicinal, culinary, and aromatic properties, making them a staple in various traditional and modern applications. With the increasing consumer interest in natural and plant-based products, the demand for botanical extracts derived from herbs has witnessed a surge across diverse industries, including food and beverages, pharmaceuticals, cosmetics, and dietary supplements. Herbs offer a wide array of bioactive compounds, such as polyphenols, flavonoids, and essential oils, known for their antioxidant, anti-inflammatory, and antimicrobial properties, contributing to their popularity among health-conscious consumers. Further, the versatility of herbs allows for their incorporation into a myriad of products, ranging from herbal teas and culinary seasonings to skincare formulations and herbal remedies, driving their widespread adoption by manufacturers seeking to capitalize on consumer preferences for natural and holistic solutions. Additionally, the growing trend towards sustainability and environmental stewardship has further fueled the demand for botanical extracts sourced from herbs, as they are often cultivated using organic and regenerative farming practices, aligning with the values of eco-conscious consumers. As a result, the herbs segment stands as the largest in the Botanical Extracts Market, poised for continued growth as the demand for natural and plant-based ingredients continues to rise globally.
Botanical Extracts Market Share Analysis: Beverages - Alcoholic Beverages market is poised to register the fastest growth rae over the forecast period to 2032
In the Botanical Extracts Market categorized by application, the segment for alcoholic beverages is the fastest-growing, fueled by several transformative factors. Alcoholic beverages infused with botanical extracts offer an appealing fusion of flavor, aroma, and health benefits, catering to evolving consumer preferences for unique and sophisticated drinking experiences. With the rise of craft cocktails and artisanal spirits, there is a growing demand for botanical-infused alcoholic beverages, such as botanical gins, herbal liqueurs, and botanical-infused vodkas, among discerning consumers seeking premium and innovative libations. Additionally, botanical extracts add complexity and depth to alcoholic beverages, enhancing their sensory attributes and distinguishing them in a competitive market landscape. Furthermore, the increasing consumer interest in wellness and functional beverages has spurred the development of botanical-infused alcoholic beverages that offer not only indulgence but also health-promoting properties derived from botanical ingredients. As a result, the segment for alcoholic beverages stands as the fastest-growing in the Botanical Extracts Market, poised for continued expansion as beverage manufacturers and mixologists harness the potential of botanical extracts to create captivating and health-conscious libations that resonate with modern consumers.
Botanical Extracts Market Share Analysis: Powder held the dominant market share in 2024
In the Botanical Extracts Market segmented by type, the powder segment is the largest, propelled by several pivotal factors. Powdered botanical extracts offer convenience, versatility, and longer shelf life compared to their liquid counterparts, making them a preferred choice for manufacturers across diverse industries. Powdered extracts are easier to handle, store, and transport, reducing logistical complexities and costs associated with liquid formulations. Further, powdered extracts can be more easily standardized for active compounds, ensuring consistency and efficacy in various applications, including food and beverages, dietary supplements, cosmetics, and pharmaceuticals. Additionally, powdered botanical extracts lend themselves well to dry formulations, such as capsules, tablets, and powdered blends, facilitating their incorporation into a wide range of products without compromising stability or sensory attributes. Furthermore, advancements in extraction and drying technologies have enabled the production of high-quality powdered extracts with enhanced bioavailability and retention of phytochemicals and bioactive compounds, further driving their popularity among manufacturers and consumers alike. As a result, the powder segment stands as the largest in the Botanical Extracts Market, poised for sustained growth as the demand for natural and functional ingredients continues to rise globally.
Botanical Extracts Market Segmentation
By Source
Spices
Herbs
Flowers
Tea Leaves
By Application
Food
-Bakery & Confectionery
-Sauces And Dressings
Beverages
-Alcoholic Beverages
-Carbonated Soft Drinks
-Ice Tea
-Flavored Dairy Products
By Type
Powder
Liquid
Countries Analyzed
North America (US, Canada, Mexico)
Europe (Germany, UK, France, Spain, Italy, Russia, Rest of Europe)
Asia Pacific (China, India, Japan, South Korea, Australia, South East Asia, Rest of Asia)
South America (Brazil, Argentina, Rest of South America)
Middle East and Africa (Saudi Arabia, UAE, Rest of Middle East, South Africa, Egypt, Rest of Africa)
Botanical Extracts Companies Profiled in the Study
All Season Herbs Pvt. Ltd
Bell Flavors and Fragrances GmbH
BI Nutraceuticals
Bio Botanica Inc
Botanical Extracts EPZ Ltd
Carrubba Inc
Dohler GmbH
Grupo Natac S.L.U.
Indesso
International Flavors and Fragrances Inc
Jairamdass Khushiram
Kalsec Inc
Kerry Group Plc
MB Holding GmbH and Co. KG
NEXIRA SAS
*- List Not Exhaustive
Chapter 1. TABLE OF CONTENTS
Chapter 2. Introduction to Botanical Extracts Market
2.1. Market Overview
2.2. Key Statistics and Report Highlights
2.3. Scope of the Comprehensive Study
2.3.1. Market Definition
2.3.2 Countries and Regions Covered
2.3.3 Research Objective
2.3.4 Units, Currency, and Conversions
2.3.5 Industry Value Chain
2.4. Key Market Segments
2.5. Key Companies
2.6. Study Period
Chapter 3. Strategic Analysis Review
3.1. Botanical Extracts Pricing Analysis and Forecast
3.2. Porter’s Five Forces
3.3. Market Ecosystem
3.4. SWOT Analysis
3.5. Regulatory Scenario
3.3. Effects of Inflation, Russia-Ukraine War, moderating economic growth, and other macroeconomic factors
Chapter 4. Competitive Landscape
4.1. Market Share Analysis
4.1.1. Global Botanical Extracts Market Share by Company, 2023
4.1.2. Product Offerings of Leading Botanical Extracts Companies
4.2. Market Entropy
4.2.1. New Product Launches in the Industry
4.2.2. Mergers, Acquisitions, Joint ventures, and Partnerships
4.3. Key Strategies and Best Practices
Chapter 5. Global Market Projections: Best, Reference, and Low Case Scenarios
5.1. Growth Analysis- Case Scenario Definitions
5.2. Low Growth Case Scenario Forecasts
5.3. Reference Growth Case Scenario Forecasts
5.4. High Growth Case Scenario Forecasts
Chapter 6. Market Dynamics
6.1. Botanical Extracts Market Drivers
6.2. Botanical Extracts Market Challenges
6.6. Botanical Extracts Market Opportunities
6.4. Botanical Extracts Market Trends
Chapter 7. Global Botanical Extracts Market Outlook Trends
7.1. Global Botanical Extracts Revenue (USD Million) and CAGR (%) by Type (2021-2032)
7.2. Global Botanical Extracts Revenue (USD Million) and CAGR (%) by Application (2021-2032)
7.3. Global Botanical Extracts Revenue (USD Million) and CAGR (%) by Product (2021-2032)
By Source
Spices
Herbs
Flowers
Tea Leaves
By Application
Food
-Bakery & Confectionery
-Sauces And Dressings
Beverages
-Alcoholic Beverages
-Carbonated Soft Drinks
-Ice Tea
-Flavored Dairy Products
By Type
Powder
Liquid
Chapter 8. Global Botanical Extracts Regional Analysis and Outlook
8.1. Global Botanical Extracts Revenue (USD Million) By Regions (2021- 2032)
8.2. North America Botanical Extracts Revenue (USD Million) by Country (2021-2032)
8.2.1. United States Botanical Extracts Regional Analysis and Outlook
8.2.2. Canada Botanical Extracts Regional Analysis and Outlook
8.2.3. Mexico Botanical Extracts Regional Analysis and Outlook
8.3. Europe Botanical Extracts Revenue (USD Million), by Country (2021-2032)
8.3.1. Germany Botanical Extracts Regional Analysis and Outlook
8.3.2. France Botanical Extracts Regional Analysis and Outlook
8.3.3. United Kingdom Botanical Extracts Regional Analysis and Outlook
8.3.4. Spain Botanical Extracts Regional Analysis and Outlook
8.3.5. Italy Botanical Extracts Regional Analysis and Outlook
8.3.6. Russia Botanical Extracts Regional Analysis and Outlook
8.3.7. Rest of Europe Botanical Extracts Regional Analysis and Outlook
8.4. Asia Pacific Botanical Extracts Revenue (USD Million) by Country (2021-2032)
8.4.1. China Botanical Extracts Regional Analysis and Outlook
8.4.2. Japan Botanical Extracts Regional Analysis and Outlook
8.4.3. India Botanical Extracts Regional Analysis and Outlook
8.4.4. South Korea Botanical Extracts Regional Analysis and Outlook
8.4.5. Australia Botanical Extracts Regional Analysis and Outlook
8.4.6. South East Asia Botanical Extracts Regional Analysis and Outlook
8.4.7. Rest of Asia Pacific Botanical Extracts Regional Analysis and Outlook
8.5. South America Botanical Extracts Revenue (USD Million), by Country (2021-2032)
8.5.1. Brazil Botanical Extracts Regional Analysis and Outlook
8.5.2. Argentina Botanical Extracts Regional Analysis and Outlook
8.5.3. Rest of South America Botanical Extracts Regional Analysis and Outlook
8.6. Middle East and Africa Botanical Extracts Revenue (USD Million) by Country (2021-2032)
8.6.1. Middle East Botanical Extracts Regional Analysis and Outlook
8.6.2. Africa Botanical Extracts Regional Analysis and Outlook
Chapter 9. North America Botanical Extracts Analysis and Outlook
9.1. North America Botanical Extracts Revenue (USD Million) by Segments (2021-2032)
9.1.1. North America Botanical Extracts Revenue (USD Million) by Type (2021-2032)
9.1.2. North America Botanical Extracts Revenue (USD Million) by Application (2021-2032)
9.1.3. North America Botanical Extracts Revenue (USD Million) by Product (2021-2032)
By Source
Spices
Herbs
Flowers
Tea Leaves
By Application
Food
-Bakery & Confectionery
-Sauces And Dressings
Beverages
-Alcoholic Beverages
-Carbonated Soft Drinks
-Ice Tea
-Flavored Dairy Products
By Type
Powder
Liquid
Chapter 10. Europe Botanical Extracts Analysis and Outlook
10.1. Europe Botanical Extracts Revenue (USD Million), by Segments (USD Million) (2021-2032)
10.1.1. Europe Botanical Extracts Revenue (USD Million) by Type (2021-2032)
10.1.2. Europe Botanical Extracts Revenue (USD Million) by Application (2021-2032)
10.1.3. Europe Botanical Extracts Revenue (USD Million) by Product (2021-2032)
By Source
Spices
Herbs
Flowers
Tea Leaves
By Application
Food
-Bakery & Confectionery
-Sauces And Dressings
Beverages
-Alcoholic Beverages
-Carbonated Soft Drinks
-Ice Tea
-Flavored Dairy Products
By Type
Powder
Liquid
Chapter 11. Asia Pacific Botanical Extracts Analysis and Outlook
11.1. Asia Pacific Botanical Extracts Revenue (USD Million), and Revenue (USD Million) by Segments (2021-2032)
11.1.1. Asia Pacific Botanical Extracts Revenue (USD Million) by Type (2021-2032)
11.1.2. Asia Pacific Botanical Extracts Revenue (USD Million) by Application (2021-2032)
11.1.3. Asia Pacific Botanical Extracts Revenue (USD Million) by Product (2021-2032)
By Source
Spices
Herbs
Flowers
Tea Leaves
By Application
Food
-Bakery & Confectionery
-Sauces And Dressings
Beverages
-Alcoholic Beverages
-Carbonated Soft Drinks
-Ice Tea
-Flavored Dairy Products
By Type
Powder
Liquid
Chapter 12. South America Botanical Extracts Analysis and Outlook
12.1. South America Botanical Extracts Revenue (USD Million), by Segments (2021-2032)
12.1.1. South America Botanical Extracts Revenue (USD Million) by Type (2021-2032)
12.1.2. South America Botanical Extracts Revenue (USD Million) by Application (2021-2032)
12.1.3. South America Botanical Extracts Revenue (USD Million) by Product (2021-2032)
By Source
Spices
Herbs
Flowers
Tea Leaves
By Application
Food
-Bakery & Confectionery
-Sauces And Dressings
Beverages
-Alcoholic Beverages
-Carbonated Soft Drinks
-Ice Tea
-Flavored Dairy Products
By Type
Powder
Liquid
Chapter 13. Middle East and Africa Botanical Extracts Analysis and Outlook
13.1. Middle East and Africa Botanical Extracts Revenue (USD Million), by Segments (2021-2032)
13.1.1. Middle East and Africa Botanical Extracts Revenue (USD Million) by Type (2021-2032)
13.1.2. Middle East and Africa Botanical Extracts Revenue (USD Million) by Application (2021-2032)
13.1.3. Middle East and Africa Botanical Extracts Revenue (USD Million) by Product (2021-2032)
By Source
Spices
Herbs
Flowers
Tea Leaves
By Application
Food
-Bakery & Confectionery
-Sauces And Dressings
Beverages
-Alcoholic Beverages
-Carbonated Soft Drinks
-Ice Tea
-Flavored Dairy Products
By Type
Powder
Liquid
Chapter 14. Botanical Extracts Company Profiles
14.1 Business Overview
14.2 Product Profiles
14.3 SWOT Profiles
14.5 Recent Developments
14.6 Financial Profile
List of Companies
All Season Herbs Pvt. Ltd
Bell Flavors and Fragrances GmbH
BI Nutraceuticals
Bio Botanica Inc
Botanical Extracts EPZ Ltd
Carrubba Inc
Dohler GmbH
Grupo Natac S.L.U.
Indesso
International Flavors and Fragrances Inc
Jairamdass Khushiram
Kalsec Inc
Kerry Group Plc
MB Holding GmbH and Co. KG
NEXIRA SAS
15. Methodology and Data Sources
15.1 Customization Offerings
15.2 Subscription Services
15.3 Related Reports
15.4 Publisher Expertise
LIST OF TABLES
Table 1 Market Segmentation Analysis
Table 2 Global Botanical Extracts Market Share of Leading Companies, 2023
Table 3 Product Offerings of Leading Companies
Table 4 Low Growth Scenario Forecasts
Table 5 Reference Case Growth Scenario
Table 6 High Growth Case Scenario
Table 7 Global Botanical Extracts Revenue (USD Million) And CAGR (%) By Type (2021-2032)
Table 8 Global Botanical Extracts Revenue (USD Million) And CAGR (%) By Application (2021-2032)
Table 9 Global Botanical Extracts Revenue (USD Million) And CAGR (%) By Product (2021-2032)
Table 10 Global Botanical Extracts Market Revenue (USD Million) By Regions (2021-2032)
Table 11 Global Botanical Extracts Market Share (%) By Regions (2021-2032)
Table 12 North America Botanical Extracts Revenue (USD Million) By Country (2021-2032)
Table 13 Europe Botanical Extracts Revenue (USD Million) By Country (2021-2032)
Table 14 Asia Pacific Botanical Extracts Revenue (USD Million) By Country (2021-2032)
Table 15 South America Botanical Extracts Revenue (USD Million) By Country (2021-2032)
Table 16 Middle East and Africa Botanical Extracts Revenue (USD Million) By Region (2021-2032)
Table 17 North America Botanical Extracts Revenue (USD Million) By Type (2021-2032)
Table 18 North America Botanical Extracts Revenue (USD Million) By Application (2021-2032)
Table 19 North America Botanical Extracts Revenue (USD Million) By Product (2021-2032)
Table 20 Europe Botanical Extracts Revenue (USD Million) By Type (2021-2032)
Table 21 Europe Botanical Extracts Revenue (USD Million) By Application (2021-2032)
Table 22 Europe Botanical Extracts Revenue (USD Million) By Product (2021-2032)
Table 23 Asia Pacific Botanical Extracts Revenue (USD Million) By Type (2021-2032)
Table 24 Asia Pacific Botanical Extracts Revenue (USD Million) By Application (2021-2032)
Table 25 Asia Pacific Botanical Extracts Revenue (USD Million) By Product (2021-2032)
Table 26 South America Botanical Extracts Revenue (USD Million) By Type (2021-2032)
Table 27 South America Botanical Extracts Revenue (USD Million) By Application (2021-2032)
Table 28 South America Botanical Extracts Revenue (USD Million) By Product (2021-2032)
Table 29 Middle East and Africa Botanical Extracts Revenue (USD Million) By Type (2021-2032)
Table 30 Middle East and Africa Botanical Extracts Revenue (USD Million) By Application (2021-2032)
Table 31 Middle East and Africa Botanical Extracts Revenue (USD Million) By Product (2021-2032)
LIST OF FIGURES
Figure 1. Market Scope
Figure 2. Pricing Forecasts Per Unit, 2023- 2032
Figure 3. Porter’s Five Forces
Figure 4. Global Botanical Extracts Market Revenue (USD Million) By Regions (2021-2032)
Figure 5. Global Botanical Extracts Market Share (%) By Regions (2023)
Figure 6. North America Botanical Extracts Revenue (USD Million) By Country (2021-2032)
Figure 7. United States Botanical Extracts Revenue (USD Million) By Country (2021-2032)
Figure 8. Canada Botanical Extracts Revenue (USD Million) By Country (2021-2032)
Figure 9. Mexico Botanical Extracts Revenue (USD Million) By Country (2021-2032)
Figure 10. Europe Botanical Extracts Revenue (USD Million) By Country (2021-2032)
Figure 11. Germany Botanical Extracts Revenue (USD Million) By Country (2021-2032)
Figure 12. France Botanical Extracts Revenue (USD Million) By Country (2021-2032)
Figure 13. United Kingdom Botanical Extracts Revenue (USD Million) By Country (2021-2032)
Figure 14. Spain Botanical Extracts Revenue (USD Million) By Country (2021-2032)
Figure 15. Italy Botanical Extracts Revenue (USD Million) By Country (2021-2032)
Figure 16. Russia Botanical Extracts Revenue (USD Million) By Country (2021-2032)
Figure 17. Rest of Europe Botanical Extracts Revenue (USD Million) By Country (2021-2032)
Figure 11. Asia Pacific Botanical Extracts Revenue (USD Million) By Country (2021-2032)
Figure 12. China Botanical Extracts Revenue (USD Million) By Country (2021-2032)
Figure 13. Japan Botanical Extracts Revenue (USD Million) By Country (2021-2032)
Figure 14. India Botanical Extracts Revenue (USD Million) By Country (2021-2032)
Figure 15. South Korea Botanical Extracts Revenue (USD Million) By Country (2021-2032)
Figure 16. Australia Botanical Extracts Revenue (USD Million) By Country (2021-2032)
Figure 17. South East Asia Botanical Extracts Revenue (USD Million) By Country (2021-2032)
Figure 18. South America Botanical Extracts Revenue (USD Million) By Country (2021-2032)
Figure 19. Brazil Botanical Extracts Revenue (USD Million) By Country (2021-2032)
Figure 20. Argentina Botanical Extracts Revenue (USD Million) By Country (2021-2032)
Figure 21. Rest of Asia Pacific Botanical Extracts Revenue (USD Million) By Country (2021-2032)
Figure 22. Middle East and Africa Botanical Extracts Revenue (USD Million) By Region (2021-2032)
Figure 23. Saudi Arabia Botanical Extracts Revenue (USD Million) By Region (2021-2032)
Figure 24. The UAE Botanical Extracts Revenue (USD Million) By Region (2021-2032)
Figure 25. Rest of Middle East Botanical Extracts Revenue (USD Million) By Region (2021-2032)
Figure 26. South Africa Botanical Extracts Revenue (USD Million) By Region (2021-2032)
Figure 27. Africa Botanical Extracts Revenue (USD Million) By Region (2021-2032)
Figure 28. North America Botanical Extracts Revenue (USD Million) By Type (2021-2032)
Figure 29. North America Botanical Extracts Revenue (USD Million) By Application (2021-2032)
Figure 30. North America Botanical Extracts Revenue (USD Million) By Product (2021-2032)
Figure 31. Europe Botanical Extracts Revenue (USD Million) By Type (2021-2032)
Figure 32. Europe Botanical Extracts Revenue (USD Million) By Application (2021-2032)
Figure 33. Europe Botanical Extracts Revenue (USD Million) By Product (2021-2032)
Figure 34. Asia Pacific Botanical Extracts Revenue (USD Million) By Type (2021-2032)
Figure 35. Asia Pacific Botanical Extracts Revenue (USD Million) By Application (2021-2032)
Figure 36. Asia Pacific Botanical Extracts Revenue (USD Million) By Product (2021-2032)
Figure 37. South America Botanical Extracts Revenue (USD Million) By Type (2021-2032)
Figure 38. South America Botanical Extracts Revenue (USD Million) By Application (2021-2032)
Figure 39. South America Botanical Extracts Revenue (USD Million) By Product (2021-2032)
Figure 40. Middle East and Africa Botanical Extracts Revenue (USD Million) By Type (2021-2032)
Figure 41. Middle East and Africa Botanical Extracts Revenue (USD Million) By Application (2021-2032)
Figure 42. Middle East and Africa Botanical Extracts Revenue (USD Million) By Product (2021-2032)
By Source
Spices
Herbs
Flowers
Tea Leaves
By Application
Food
-Bakery & Confectionery
-Sauces And Dressings
Beverages
-Alcoholic Beverages
-Carbonated Soft Drinks
-Ice Tea
-Flavored Dairy Products
By Type
Powder
Liquid
Countries Analyzed
North America (US, Canada, Mexico)
Europe (Germany, UK, France, Spain, Italy, Russia, Rest of Europe)
Asia Pacific (China, India, Japan, South Korea, Australia, South East Asia, Rest of Asia)
South America (Brazil, Argentina, Rest of South America)
Middle East and Africa (Saudi Arabia, UAE, Rest of Middle East, South Africa, Egypt, Rest of Africa)
