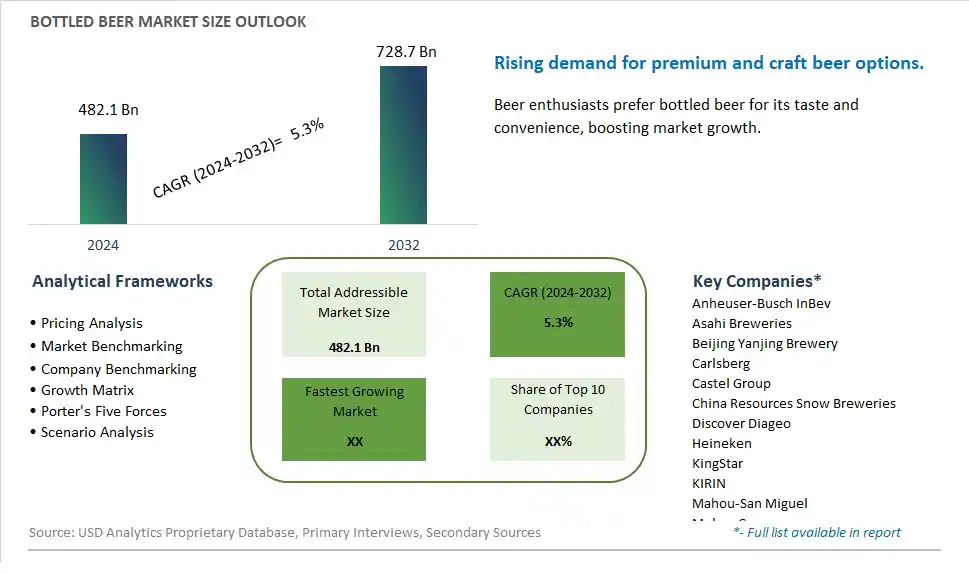
Global Bottled Beer Market Size is valued at $482.1 Billion in 2024 and is forecast to register a growth rate (CAGR) of 5.3% to reach $728.7 Billion by 2032.
The global Bottled Beer Market Comprehensive Study analyzes and forecasts the market size across 6 regions and 24 countries for diverse segments -By Type (Value Beer, Standard Beer, Premium Beer), By Sales Channel (Online, Offline)
An Introduction to Bottled Beer Market
In 2024, the Bottled Beer market is witnessing steady growth, driven by the sustained demand for both mass-produced and craft beers in convenient packaging. Bottled beer remains a popular choice due to its preservation of flavor and carbonation, as well as its recyclability and portability. The market is supported by the increasing consumer interest in premium, artisanal, and diverse beer offerings. Advances in brewing technology and packaging innovation are enhancing the quality and variety of bottled beers available. The market is also benefiting from the rise of beer tourism and the trend towards specialty and seasonal brews that attract beer enthusiasts and casual drinkers alike.
Bottled Beer Competitive Landscape
The market report analyses the leading companies in the industry including Anheuser-Busch InBev, Asahi Breweries, Beijing Yanjing Brewery, Carlsberg, Castel Group, China Resources Snow Breweries, Discover Diageo, Heineken, KingStar, KIRIN, Mahou-San Miguel, MolsonCoors, Radeberger, San Miguel Corp, Tsingtao Brewery, Zhujiang Beer, and Others.
Bottled Beer Market Dynamics
Bottled Beer Market Trend: Craft Beer Movement and Premiumization
One of the most prominent trends in the Bottled Beer market is the craft beer movement and premiumization. Consumers are increasingly interested in unique and artisanal beer varieties, leading to a rise in craft breweries and specialty beer offerings. This trend has also driven the premiumization of bottled beer, with consumers willing to pay more for high-quality, distinctive brews that offer unique flavors, ingredients, and brewing techniques.
Bottled Beer Market Driver: Shift Towards At-Home Consumption and Convenience
A significant driver of the Bottled Beer market is the shift towards at-home consumption and convenience. With changes in consumer preferences and lifestyle patterns, more people are opting to enjoy beer at home or in small gatherings rather than at bars or restaurants. Bottled beer provides convenience, portability, and a longer shelf life, making it a preferred choice for consumers looking to enjoy their favorite brews in the comfort of their homes.
Bottled Beer Market Opportunity: Innovation in Flavors, Packaging, and Marketing
An exciting opportunity within the Bottled Beer market lies in innovation across flavors, packaging, and marketing strategies. Breweries can capitalize on consumer demand for variety and experimentation by introducing new and unique beer flavors, such as fruity, spicy, or barrel-aged options. Additionally, creative packaging designs, such as artistic labels, sustainable packaging materials, and convenient multi-packs, can attract consumers' attention and enhance brand perception. Furthermore, innovative marketing campaigns that emphasize the craftsmanship, story, and authenticity behind each beer can resonate with consumers and drive sales in the competitive bottled beer market.
Bottled Beer Market Share Analysis: Standard Beer segment generated the highest revenue share in the industry
The Standard Beer segment emerges as the largest within the Bottled Beer Market, holding a significant share of the overall market. This segment's dominance can be attributed to several key factors driving consumer preferences and market dynamics. Firstly, standard beer appeals to a broad consumer base due to its affordability, consistent quality, and familiar taste profile. Consumers often choose standard beer as a go-to option for casual social gatherings, everyday consumption, and budget-conscious purchases. Additionally, standard beer brands have widespread distribution networks and strong brand recognition, further contributing to their market leadership. Further, the versatility of standard beer in terms of brewing styles, flavors, and packaging formats ensures its popularity across different market segments and consumption occasions. Furthermore, the standard beer segment benefits from continuous innovation, product diversification, and marketing strategies aimed at engaging consumers and maintaining brand loyalty. As a result, the Standard Beer segment continues to lead the Bottled Beer Market, presenting opportunities for breweries to leverage consumer preferences and market trends to drive growth and profitability.
Bottled Beer Market Share Analysis: Online Sales is the fastest growing segment over the forecast period to 2032
The Online Sales segment within the Bottled Beer Market is experiencing rapid growth and is anticipated to continue expanding significantly until 2032. This surge can be attributed to several key factors driving consumer behavior and market dynamics. Firstly, the increasing adoption of e-commerce platforms and digitalization of retail channels have made online beer shopping more accessible, convenient, and appealing to consumers. Online sales platforms offer a wide variety of beer options, including craft beers, specialty brews, and international brands, catering to diverse consumer preferences and tastes. Additionally, the Past few yearsaccelerated the shift towards online shopping as consumers sought safer and contactless shopping experiences, leading to a surge in online beer sales. Furthermore, online sales channels provide breweries and beer brands with opportunities to reach a broader audience, engage with consumers through targeted marketing campaigns, and offer exclusive promotions and discounts. The convenience of doorstep delivery and the ability to explore new beer experiences online contribute to the segment's fast growth. As a result, the Online Sales segment emerges as the fastest-growing segment within the Bottled Beer Market, presenting significant opportunities for breweries and online retailers to innovate and capitalize on the growing trend of online beer shopping.
Bottled Beer Market Segmentation
By Type
Value Beer
Standard Beer
Premium Beer
By Sales Channel
Online
Offline
Countries Analyzed
North America (US, Canada, Mexico)
Europe (Germany, UK, France, Spain, Italy, Russia, Rest of Europe)
Asia Pacific (China, India, Japan, South Korea, Australia, South East Asia, Rest of Asia)
South America (Brazil, Argentina, Rest of South America)
Middle East and Africa (Saudi Arabia, UAE, Rest of Middle East, South Africa, Egypt, Rest of Africa)
Bottled Beer Companies Profiled in the Study
Anheuser-Busch InBev
Asahi Breweries
Beijing Yanjing Brewery
Carlsberg
Castel Group
China Resources Snow Breweries
Discover Diageo
Heineken
KingStar
KIRIN
Mahou-San Miguel
MolsonCoors
Radeberger
San Miguel Corp
Tsingtao Brewery
Zhujiang Beer
*- List Not Exhaustive
Chapter 1. TABLE OF CONTENTS
Chapter 2. Introduction to Bottled Beer Market
2.1. Market Overview
2.2. Key Statistics and Report Highlights
2.3. Scope of the Comprehensive Study
2.3.1. Market Definition
2.3.2 Countries and Regions Covered
2.3.3 Research Objective
2.3.4 Units, Currency, and Conversions
2.3.5 Industry Value Chain
2.4. Key Market Segments
2.5. Key Companies
2.6. Study Period
Chapter 3. Strategic Analysis Review
3.1. Bottled Beer Pricing Analysis and Forecast
3.2. Porter’s Five Forces
3.3. Market Ecosystem
3.4. SWOT Analysis
3.5. Regulatory Scenario
3.3. Effects of Inflation, Russia-Ukraine War, moderating economic growth, and other macroeconomic factors
Chapter 4. Competitive Landscape
4.1. Market Share Analysis
4.1.1. Global Bottled Beer Market Share by Company, 2023
4.1.2. Product Offerings of Leading Bottled Beer Companies
4.2. Market Entropy
4.2.1. New Product Launches in the Industry
4.2.2. Mergers, Acquisitions, Joint ventures, and Partnerships
4.3. Key Strategies and Best Practices
Chapter 5. Global Market Projections: Best, Reference, and Low Case Scenarios
5.1. Growth Analysis- Case Scenario Definitions
5.2. Low Growth Case Scenario Forecasts
5.3. Reference Growth Case Scenario Forecasts
5.4. High Growth Case Scenario Forecasts
Chapter 6. Market Dynamics
6.1. Bottled Beer Market Drivers
6.2. Bottled Beer Market Challenges
6.6. Bottled Beer Market Opportunities
6.4. Bottled Beer Market Trends
Chapter 7. Global Bottled Beer Market Outlook Trends
7.1. Global Bottled Beer Revenue (USD Million) and CAGR (%) by Type (2021-2032)
7.2. Global Bottled Beer Revenue (USD Million) and CAGR (%) by Application (2021-2032)
7.3. Global Bottled Beer Revenue (USD Million) and CAGR (%) by Product (2021-2032)
By Type
Value Beer
Standard Beer
Premium Beer
By Sales Channel
Online
Offline
Chapter 8. Global Bottled Beer Regional Analysis and Outlook
8.1. Global Bottled Beer Revenue (USD Million) By Regions (2021- 2032)
8.2. North America Bottled Beer Revenue (USD Million) by Country (2021-2032)
8.2.1. United States Bottled Beer Regional Analysis and Outlook
8.2.2. Canada Bottled Beer Regional Analysis and Outlook
8.2.3. Mexico Bottled Beer Regional Analysis and Outlook
8.3. Europe Bottled Beer Revenue (USD Million), by Country (2021-2032)
8.3.1. Germany Bottled Beer Regional Analysis and Outlook
8.3.2. France Bottled Beer Regional Analysis and Outlook
8.3.3. United Kingdom Bottled Beer Regional Analysis and Outlook
8.3.4. Spain Bottled Beer Regional Analysis and Outlook
8.3.5. Italy Bottled Beer Regional Analysis and Outlook
8.3.6. Russia Bottled Beer Regional Analysis and Outlook
8.3.7. Rest of Europe Bottled Beer Regional Analysis and Outlook
8.4. Asia Pacific Bottled Beer Revenue (USD Million) by Country (2021-2032)
8.4.1. China Bottled Beer Regional Analysis and Outlook
8.4.2. Japan Bottled Beer Regional Analysis and Outlook
8.4.3. India Bottled Beer Regional Analysis and Outlook
8.4.4. South Korea Bottled Beer Regional Analysis and Outlook
8.4.5. Australia Bottled Beer Regional Analysis and Outlook
8.4.6. South East Asia Bottled Beer Regional Analysis and Outlook
8.4.7. Rest of Asia Pacific Bottled Beer Regional Analysis and Outlook
8.5. South America Bottled Beer Revenue (USD Million), by Country (2021-2032)
8.5.1. Brazil Bottled Beer Regional Analysis and Outlook
8.5.2. Argentina Bottled Beer Regional Analysis and Outlook
8.5.3. Rest of South America Bottled Beer Regional Analysis and Outlook
8.6. Middle East and Africa Bottled Beer Revenue (USD Million) by Country (2021-2032)
8.6.1. Middle East Bottled Beer Regional Analysis and Outlook
8.6.2. Africa Bottled Beer Regional Analysis and Outlook
Chapter 9. North America Bottled Beer Analysis and Outlook
9.1. North America Bottled Beer Revenue (USD Million) by Segments (2021-2032)
9.1.1. North America Bottled Beer Revenue (USD Million) by Type (2021-2032)
9.1.2. North America Bottled Beer Revenue (USD Million) by Application (2021-2032)
9.1.3. North America Bottled Beer Revenue (USD Million) by Product (2021-2032)
By Type
Value Beer
Standard Beer
Premium Beer
By Sales Channel
Online
Offline
Chapter 10. Europe Bottled Beer Analysis and Outlook
10.1. Europe Bottled Beer Revenue (USD Million), by Segments (USD Million) (2021-2032)
10.1.1. Europe Bottled Beer Revenue (USD Million) by Type (2021-2032)
10.1.2. Europe Bottled Beer Revenue (USD Million) by Application (2021-2032)
10.1.3. Europe Bottled Beer Revenue (USD Million) by Product (2021-2032)
By Type
Value Beer
Standard Beer
Premium Beer
By Sales Channel
Online
Offline
Chapter 11. Asia Pacific Bottled Beer Analysis and Outlook
11.1. Asia Pacific Bottled Beer Revenue (USD Million), and Revenue (USD Million) by Segments (2021-2032)
11.1.1. Asia Pacific Bottled Beer Revenue (USD Million) by Type (2021-2032)
11.1.2. Asia Pacific Bottled Beer Revenue (USD Million) by Application (2021-2032)
11.1.3. Asia Pacific Bottled Beer Revenue (USD Million) by Product (2021-2032)
By Type
Value Beer
Standard Beer
Premium Beer
By Sales Channel
Online
Offline
Chapter 12. South America Bottled Beer Analysis and Outlook
12.1. South America Bottled Beer Revenue (USD Million), by Segments (2021-2032)
12.1.1. South America Bottled Beer Revenue (USD Million) by Type (2021-2032)
12.1.2. South America Bottled Beer Revenue (USD Million) by Application (2021-2032)
12.1.3. South America Bottled Beer Revenue (USD Million) by Product (2021-2032)
By Type
Value Beer
Standard Beer
Premium Beer
By Sales Channel
Online
Offline
Chapter 13. Middle East and Africa Bottled Beer Analysis and Outlook
13.1. Middle East and Africa Bottled Beer Revenue (USD Million), by Segments (2021-2032)
13.1.1. Middle East and Africa Bottled Beer Revenue (USD Million) by Type (2021-2032)
13.1.2. Middle East and Africa Bottled Beer Revenue (USD Million) by Application (2021-2032)
13.1.3. Middle East and Africa Bottled Beer Revenue (USD Million) by Product (2021-2032)
By Type
Value Beer
Standard Beer
Premium Beer
By Sales Channel
Online
Offline
Chapter 14. Bottled Beer Company Profiles
14.1 Business Overview
14.2 Product Profiles
14.3 SWOT Profiles
14.5 Recent Developments
14.6 Financial Profile
List of Companies
Anheuser-Busch InBev
Asahi Breweries
Beijing Yanjing Brewery
Carlsberg
Castel Group
China Resources Snow Breweries
Discover Diageo
Heineken
KingStar
KIRIN
Mahou-San Miguel
MolsonCoors
Radeberger
San Miguel Corp
Tsingtao Brewery
Zhujiang Beer
15. Methodology and Data Sources
15.1 Customization Offerings
15.2 Subscription Services
15.3 Related Reports
15.4 Publisher Expertise
LIST OF TABLES
Table 1 Market Segmentation Analysis
Table 2 Global Bottled Beer Market Share of Leading Companies, 2023
Table 3 Product Offerings of Leading Companies
Table 4 Low Growth Scenario Forecasts
Table 5 Reference Case Growth Scenario
Table 6 High Growth Case Scenario
Table 7 Global Bottled Beer Revenue (USD Million) And CAGR (%) By Type (2021-2032)
Table 8 Global Bottled Beer Revenue (USD Million) And CAGR (%) By Application (2021-2032)
Table 9 Global Bottled Beer Revenue (USD Million) And CAGR (%) By Product (2021-2032)
Table 10 Global Bottled Beer Market Revenue (USD Million) By Regions (2021-2032)
Table 11 Global Bottled Beer Market Share (%) By Regions (2021-2032)
Table 12 North America Bottled Beer Revenue (USD Million) By Country (2021-2032)
Table 13 Europe Bottled Beer Revenue (USD Million) By Country (2021-2032)
Table 14 Asia Pacific Bottled Beer Revenue (USD Million) By Country (2021-2032)
Table 15 South America Bottled Beer Revenue (USD Million) By Country (2021-2032)
Table 16 Middle East and Africa Bottled Beer Revenue (USD Million) By Region (2021-2032)
Table 17 North America Bottled Beer Revenue (USD Million) By Type (2021-2032)
Table 18 North America Bottled Beer Revenue (USD Million) By Application (2021-2032)
Table 19 North America Bottled Beer Revenue (USD Million) By Product (2021-2032)
Table 20 Europe Bottled Beer Revenue (USD Million) By Type (2021-2032)
Table 21 Europe Bottled Beer Revenue (USD Million) By Application (2021-2032)
Table 22 Europe Bottled Beer Revenue (USD Million) By Product (2021-2032)
Table 23 Asia Pacific Bottled Beer Revenue (USD Million) By Type (2021-2032)
Table 24 Asia Pacific Bottled Beer Revenue (USD Million) By Application (2021-2032)
Table 25 Asia Pacific Bottled Beer Revenue (USD Million) By Product (2021-2032)
Table 26 South America Bottled Beer Revenue (USD Million) By Type (2021-2032)
Table 27 South America Bottled Beer Revenue (USD Million) By Application (2021-2032)
Table 28 South America Bottled Beer Revenue (USD Million) By Product (2021-2032)
Table 29 Middle East and Africa Bottled Beer Revenue (USD Million) By Type (2021-2032)
Table 30 Middle East and Africa Bottled Beer Revenue (USD Million) By Application (2021-2032)
Table 31 Middle East and Africa Bottled Beer Revenue (USD Million) By Product (2021-2032)
LIST OF FIGURES
Figure 1. Market Scope
Figure 2. Pricing Forecasts Per Unit, 2023- 2032
Figure 3. Porter’s Five Forces
Figure 4. Global Bottled Beer Market Revenue (USD Million) By Regions (2021-2032)
Figure 5. Global Bottled Beer Market Share (%) By Regions (2023)
Figure 6. North America Bottled Beer Revenue (USD Million) By Country (2021-2032)
Figure 7. United States Bottled Beer Revenue (USD Million) By Country (2021-2032)
Figure 8. Canada Bottled Beer Revenue (USD Million) By Country (2021-2032)
Figure 9. Mexico Bottled Beer Revenue (USD Million) By Country (2021-2032)
Figure 10. Europe Bottled Beer Revenue (USD Million) By Country (2021-2032)
Figure 11. Germany Bottled Beer Revenue (USD Million) By Country (2021-2032)
Figure 12. France Bottled Beer Revenue (USD Million) By Country (2021-2032)
Figure 13. United Kingdom Bottled Beer Revenue (USD Million) By Country (2021-2032)
Figure 14. Spain Bottled Beer Revenue (USD Million) By Country (2021-2032)
Figure 15. Italy Bottled Beer Revenue (USD Million) By Country (2021-2032)
Figure 16. Russia Bottled Beer Revenue (USD Million) By Country (2021-2032)
Figure 17. Rest of Europe Bottled Beer Revenue (USD Million) By Country (2021-2032)
Figure 11. Asia Pacific Bottled Beer Revenue (USD Million) By Country (2021-2032)
Figure 12. China Bottled Beer Revenue (USD Million) By Country (2021-2032)
Figure 13. Japan Bottled Beer Revenue (USD Million) By Country (2021-2032)
Figure 14. India Bottled Beer Revenue (USD Million) By Country (2021-2032)
Figure 15. South Korea Bottled Beer Revenue (USD Million) By Country (2021-2032)
Figure 16. Australia Bottled Beer Revenue (USD Million) By Country (2021-2032)
Figure 17. South East Asia Bottled Beer Revenue (USD Million) By Country (2021-2032)
Figure 18. South America Bottled Beer Revenue (USD Million) By Country (2021-2032)
Figure 19. Brazil Bottled Beer Revenue (USD Million) By Country (2021-2032)
Figure 20. Argentina Bottled Beer Revenue (USD Million) By Country (2021-2032)
Figure 21. Rest of Asia Pacific Bottled Beer Revenue (USD Million) By Country (2021-2032)
Figure 22. Middle East and Africa Bottled Beer Revenue (USD Million) By Region (2021-2032)
Figure 23. Saudi Arabia Bottled Beer Revenue (USD Million) By Region (2021-2032)
Figure 24. The UAE Bottled Beer Revenue (USD Million) By Region (2021-2032)
Figure 25. Rest of Middle East Bottled Beer Revenue (USD Million) By Region (2021-2032)
Figure 26. South Africa Bottled Beer Revenue (USD Million) By Region (2021-2032)
Figure 27. Africa Bottled Beer Revenue (USD Million) By Region (2021-2032)
Figure 28. North America Bottled Beer Revenue (USD Million) By Type (2021-2032)
Figure 29. North America Bottled Beer Revenue (USD Million) By Application (2021-2032)
Figure 30. North America Bottled Beer Revenue (USD Million) By Product (2021-2032)
Figure 31. Europe Bottled Beer Revenue (USD Million) By Type (2021-2032)
Figure 32. Europe Bottled Beer Revenue (USD Million) By Application (2021-2032)
Figure 33. Europe Bottled Beer Revenue (USD Million) By Product (2021-2032)
Figure 34. Asia Pacific Bottled Beer Revenue (USD Million) By Type (2021-2032)
Figure 35. Asia Pacific Bottled Beer Revenue (USD Million) By Application (2021-2032)
Figure 36. Asia Pacific Bottled Beer Revenue (USD Million) By Product (2021-2032)
Figure 37. South America Bottled Beer Revenue (USD Million) By Type (2021-2032)
Figure 38. South America Bottled Beer Revenue (USD Million) By Application (2021-2032)
Figure 39. South America Bottled Beer Revenue (USD Million) By Product (2021-2032)
Figure 40. Middle East and Africa Bottled Beer Revenue (USD Million) By Type (2021-2032)
Figure 41. Middle East and Africa Bottled Beer Revenue (USD Million) By Application (2021-2032)
Figure 42. Middle East and Africa Bottled Beer Revenue (USD Million) By Product (2021-2032)
By Type
Value Beer
Standard Beer
Premium Beer
By Sales Channel
Online
Offline
Countries Analyzed
North America (US, Canada, Mexico)
Europe (Germany, UK, France, Spain, Italy, Russia, Rest of Europe)
Asia Pacific (China, India, Japan, South Korea, Australia, South East Asia, Rest of Asia)
South America (Brazil, Argentina, Rest of South America)
Middle East and Africa (Saudi Arabia, UAE, Rest of Middle East, South Africa, Egypt, Rest of Africa)
