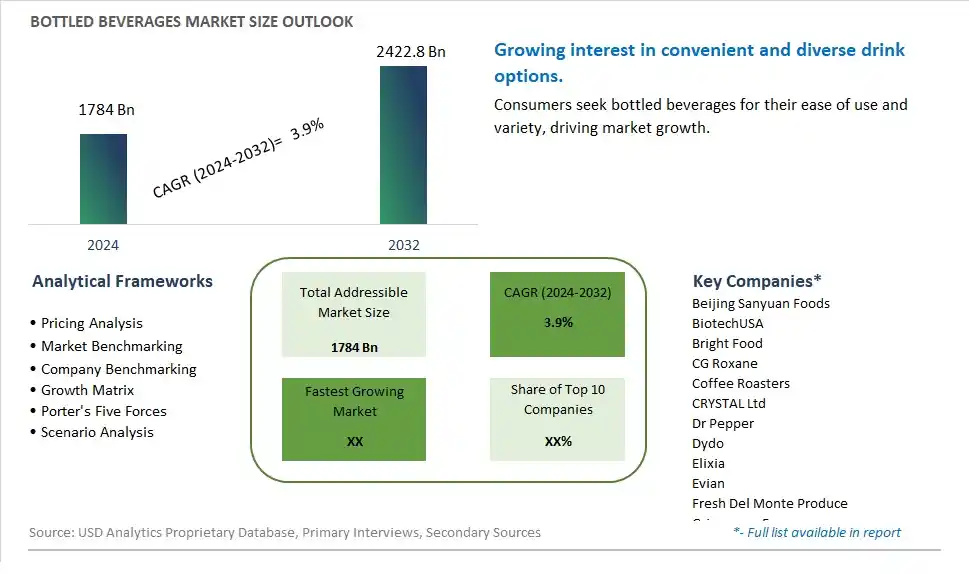
Global Bottled Beverages Market Size is valued at $1784 Billion in 2024 and is forecast to register a growth rate (CAGR) of 3.9% to reach $2422.8 Billion by 2032.
The global Bottled Beverages Market Comprehensive Study analyzes and forecasts the market size across 6 regions and 24 countries for diverse segments -By Type (Alcoholic Beverages, Carbonated Drinks, Fruit and Vegetable Juice Drinks, Functional Drink, Tea Drinks, Milk Drink, Coffee Drink), By Application (Third-party Online Shopping Platform, Fresh E-commerce, Supermarkets/Hypermarkets, Specialty Stores, Restaurant, Convenience Stores, Others)
An Introduction to Bottled Beverages Market
The Bottled Beverages market in 2024 is expanding rapidly, driven by the growing demand for convenient, on-the-go drink options. The market includes a wide range of products, such as water, juices, soft drinks, energy drinks, and functional beverages, all offered in bottled formats. The market is supported by the increasing consumer preference for ready-to-drink (RTD) solutions that fit busy lifestyles. Advances in packaging technology, including sustainable and eco-friendly materials, are enhancing product appeal and market growth. The market is also benefiting from the trend towards health-conscious and fortified beverages that provide added nutritional benefits and cater to diverse dietary needs.
Bottled Beverages Competitive Landscape
The market report analyses the leading companies in the industry including Beijing Sanyuan Foods, BiotechUSA, Bright Food, CG Roxane, Coffee Roasters, CRYSTAL Ltd, Dr Pepper, Dydo, Elixia, Evian, Fresh Del Monte Produce, Grimmway Farms, Guangzhou Xiangxue Asia Beverage, Haitai, Icelandic Glacial, Lotte, Mengniu Dairy, Mountain Valley Spring, Nongfu Spring, Ocean Spray, OKF, Old Orchard Brands, PepsiCo, Perrier, Shanghai Maling Aquarius, Shifu.Kong, Shijiazhuang Junlebao Dairy, Suntory, Tenwow, The Coca-Cola Company, The Hershey Company, Unicer, Uni-President Enterprises Corp, Vichy Catalan, Wahaha, Watsons, Wei Chuan Foods Corp, Welch Food Inc, Yili Industrial Group, and Others.
Bottled Beverages Market Dynamics
Bottled Beverages Market Trend: Health and Wellness Focus
One of the most prominent trends in the Bottled Beverages market is the increasing focus on health and wellness. Consumers are seeking healthier beverage options that are low in sugar, free from artificial additives, and enriched with functional ingredients like vitamins, minerals, antioxidants, and probiotics. This trend has led to a surge in demand for bottled beverages such as herbal teas, infused waters, natural fruit juices, and low-calorie energy drinks that cater to health-conscious consumers.
Bottled Beverages Market Driver: Convenience and On-the-Go Lifestyles
A significant driver of the Bottled Beverages market is the growing demand for convenience and the rise of on-the-go lifestyles. Busy consumers are looking for quick and easy refreshment options that they can consume while commuting, working, or engaging in outdoor activities. Bottled beverages provide portability, freshness, and a wide range of choices, making them a convenient solution for quenching thirst and staying hydrated throughout the day.
Bottled Beverages Market Opportunity: Sustainable Packaging and Eco-Friendly Practices
An opportunity within the Bottled Beverages market lies in embracing sustainable packaging and eco-friendly practices. With increasing environmental concerns, consumers are becoming more conscious of the environmental impact of single-use plastics and packaging waste. Bottled beverage companies can capitalize on this by adopting sustainable packaging solutions such as recyclable, biodegradable, or reusable materials. Additionally, promoting eco-friendly practices throughout the supply chain, including sourcing ingredients responsibly and reducing carbon footprint, can appeal to environmentally conscious consumers and enhance brand reputation.
Bottled Beverages Market Share Analysis: Carbonated Drinks segment generated the highest revenue share in the industry
The Carbonated Drinks segment stands out as the largest within the Bottled Beverages Market, holding a significant share of the overall market. This segment's dominance can be attributed to several key factors driving consumer preferences and market dynamics. Firstly, carbonated drinks have long been popular among consumers worldwide due to their refreshing bubbles, wide variety of flavors, and suitability for various occasions. Consumers often choose carbonated beverages for hydration, as well as for enjoyment and socializing. Additionally, the extensive presence of well-established brands and a diverse range of carbonated drink options contribute to the segment's leadership in the market. Further, innovations in flavor formulations, packaging designs, and marketing strategies continue to attract consumers and drive sales in the carbonated drinks segment. Furthermore, the growing demand for low-sugar or sugar-free carbonated options, along with the introduction of functional and health-oriented variants, further expands the segment's appeal and market reach. As a result, the Carbonated Drinks segment maintains its position as the largest segment in the Bottled Beverages Market, offering opportunities for brands and manufacturers to innovate and meet evolving consumer preferences.
Bottled Beverages Market Share Analysis: -party Online Shopping Platform is the fastest growing segment over the forecast period to 2032
The Third-party Online Shopping Platform segment within the Bottled Beverages Market is experiencing rapid growth and is expected to continue expanding significantly until 2032. This surge can be attributed to several key factors driving consumer behavior and market dynamics. Firstly, the increasing adoption of e-commerce platforms and digitalization of retail channels have transformed the way consumers shop for bottled beverages. Third-party online shopping platforms offer consumers a convenient and accessible way to browse, compare, and purchase a wide variety of bottled beverages from different brands and suppliers. Additionally, the Past few yearsaccelerated the shift towards online shopping as consumers sought safer and contactless shopping experiences, leading to a surge in online beverage sales. Furthermore, third-party online platforms provide a platform for smaller and niche beverage brands to reach a broader audience and compete with larger players in the market. The convenience of doorstep delivery, wide product assortment, and personalized recommendations contribute to the segment's fast growth. As a result, the Third-party Online Shopping Platform segment emerges as the fastest-growing segment within the Bottled Beverages Market, presenting significant opportunities for beverage brands and online retailers to innovate and capitalize on the growing trend of online beverage shopping.
Bottled Beverages Market Segmentation
By Type
Alcoholic Beverages
Carbonated Drinks
Fruit and Vegetable Juice Drinks
Functional Drink
Tea Drinks
Milk Drink
Coffee Drink
By Application
Third-party Online Shopping Platform
Fresh E-commerce
Supermarkets/Hypermarkets
Specialty Stores
Restaurant
Convenience Stores
Others
Countries Analyzed
North America (US, Canada, Mexico)
Europe (Germany, UK, France, Spain, Italy, Russia, Rest of Europe)
Asia Pacific (China, India, Japan, South Korea, Australia, South East Asia, Rest of Asia)
South America (Brazil, Argentina, Rest of South America)
Middle East and Africa (Saudi Arabia, UAE, Rest of Middle East, South Africa, Egypt, Rest of Africa)
Bottled Beverages Companies Profiled in the Study
Beijing Sanyuan Foods
BiotechUSA
Bright Food
CG Roxane
Coffee Roasters
CRYSTAL Ltd
Dr Pepper
Dydo
Elixia
Evian
Fresh Del Monte Produce
Grimmway Farms
Guangzhou Xiangxue Asia Beverage
Haitai
Icelandic Glacial
Lotte
Mengniu Dairy
Mountain Valley Spring
Nongfu Spring
Ocean Spray
OKF
Old Orchard Brands
PepsiCo
Perrier
Shanghai Maling Aquarius
Shifu.Kong
Shijiazhuang Junlebao Dairy
Suntory
Tenwow
The Coca-Cola Company
The Hershey Company
Unicer
Uni-President Enterprises Corp
Vichy Catalan
Wahaha
Watsons
Wei Chuan Foods Corp
Welch Food Inc
Yili Industrial Group
*- List Not Exhaustive
Chapter 1. TABLE OF CONTENTS
Chapter 2. Introduction to Bottled Beverages Market
2.1. Market Overview
2.2. Key Statistics and Report Highlights
2.3. Scope of the Comprehensive Study
2.3.1. Market Definition
2.3.2 Countries and Regions Covered
2.3.3 Research Objective
2.3.4 Units, Currency, and Conversions
2.3.5 Industry Value Chain
2.4. Key Market Segments
2.5. Key Companies
2.6. Study Period
Chapter 3. Strategic Analysis Review
3.1. Bottled Beverages Pricing Analysis and Forecast
3.2. Porter’s Five Forces
3.3. Market Ecosystem
3.4. SWOT Analysis
3.5. Regulatory Scenario
3.3. Effects of Inflation, Russia-Ukraine War, moderating economic growth, and other macroeconomic factors
Chapter 4. Competitive Landscape
4.1. Market Share Analysis
4.1.1. Global Bottled Beverages Market Share by Company, 2023
4.1.2. Product Offerings of Leading Bottled Beverages Companies
4.2. Market Entropy
4.2.1. New Product Launches in the Industry
4.2.2. Mergers, Acquisitions, Joint ventures, and Partnerships
4.3. Key Strategies and Best Practices
Chapter 5. Global Market Projections: Best, Reference, and Low Case Scenarios
5.1. Growth Analysis- Case Scenario Definitions
5.2. Low Growth Case Scenario Forecasts
5.3. Reference Growth Case Scenario Forecasts
5.4. High Growth Case Scenario Forecasts
Chapter 6. Market Dynamics
6.1. Bottled Beverages Market Drivers
6.2. Bottled Beverages Market Challenges
6.6. Bottled Beverages Market Opportunities
6.4. Bottled Beverages Market Trends
Chapter 7. Global Bottled Beverages Market Outlook Trends
7.1. Global Bottled Beverages Revenue (USD Million) and CAGR (%) by Type (2021-2032)
7.2. Global Bottled Beverages Revenue (USD Million) and CAGR (%) by Application (2021-2032)
7.3. Global Bottled Beverages Revenue (USD Million) and CAGR (%) by Product (2021-2032)
By Type
Alcoholic Beverages
Carbonated Drinks
Fruit and Vegetable Juice Drinks
Functional Drink
Tea Drinks
Milk Drink
Coffee Drink
By Application
Third-party Online Shopping Platform
Fresh E-commerce
Supermarkets/Hypermarkets
Specialty Stores
Restaurant
Convenience Stores
Others
Chapter 8. Global Bottled Beverages Regional Analysis and Outlook
8.1. Global Bottled Beverages Revenue (USD Million) By Regions (2021- 2032)
8.2. North America Bottled Beverages Revenue (USD Million) by Country (2021-2032)
8.2.1. United States Bottled Beverages Regional Analysis and Outlook
8.2.2. Canada Bottled Beverages Regional Analysis and Outlook
8.2.3. Mexico Bottled Beverages Regional Analysis and Outlook
8.3. Europe Bottled Beverages Revenue (USD Million), by Country (2021-2032)
8.3.1. Germany Bottled Beverages Regional Analysis and Outlook
8.3.2. France Bottled Beverages Regional Analysis and Outlook
8.3.3. United Kingdom Bottled Beverages Regional Analysis and Outlook
8.3.4. Spain Bottled Beverages Regional Analysis and Outlook
8.3.5. Italy Bottled Beverages Regional Analysis and Outlook
8.3.6. Russia Bottled Beverages Regional Analysis and Outlook
8.3.7. Rest of Europe Bottled Beverages Regional Analysis and Outlook
8.4. Asia Pacific Bottled Beverages Revenue (USD Million) by Country (2021-2032)
8.4.1. China Bottled Beverages Regional Analysis and Outlook
8.4.2. Japan Bottled Beverages Regional Analysis and Outlook
8.4.3. India Bottled Beverages Regional Analysis and Outlook
8.4.4. South Korea Bottled Beverages Regional Analysis and Outlook
8.4.5. Australia Bottled Beverages Regional Analysis and Outlook
8.4.6. South East Asia Bottled Beverages Regional Analysis and Outlook
8.4.7. Rest of Asia Pacific Bottled Beverages Regional Analysis and Outlook
8.5. South America Bottled Beverages Revenue (USD Million), by Country (2021-2032)
8.5.1. Brazil Bottled Beverages Regional Analysis and Outlook
8.5.2. Argentina Bottled Beverages Regional Analysis and Outlook
8.5.3. Rest of South America Bottled Beverages Regional Analysis and Outlook
8.6. Middle East and Africa Bottled Beverages Revenue (USD Million) by Country (2021-2032)
8.6.1. Middle East Bottled Beverages Regional Analysis and Outlook
8.6.2. Africa Bottled Beverages Regional Analysis and Outlook
Chapter 9. North America Bottled Beverages Analysis and Outlook
9.1. North America Bottled Beverages Revenue (USD Million) by Segments (2021-2032)
9.1.1. North America Bottled Beverages Revenue (USD Million) by Type (2021-2032)
9.1.2. North America Bottled Beverages Revenue (USD Million) by Application (2021-2032)
9.1.3. North America Bottled Beverages Revenue (USD Million) by Product (2021-2032)
By Type
Alcoholic Beverages
Carbonated Drinks
Fruit and Vegetable Juice Drinks
Functional Drink
Tea Drinks
Milk Drink
Coffee Drink
By Application
Third-party Online Shopping Platform
Fresh E-commerce
Supermarkets/Hypermarkets
Specialty Stores
Restaurant
Convenience Stores
Others
Chapter 10. Europe Bottled Beverages Analysis and Outlook
10.1. Europe Bottled Beverages Revenue (USD Million), by Segments (USD Million) (2021-2032)
10.1.1. Europe Bottled Beverages Revenue (USD Million) by Type (2021-2032)
10.1.2. Europe Bottled Beverages Revenue (USD Million) by Application (2021-2032)
10.1.3. Europe Bottled Beverages Revenue (USD Million) by Product (2021-2032)
By Type
Alcoholic Beverages
Carbonated Drinks
Fruit and Vegetable Juice Drinks
Functional Drink
Tea Drinks
Milk Drink
Coffee Drink
By Application
Third-party Online Shopping Platform
Fresh E-commerce
Supermarkets/Hypermarkets
Specialty Stores
Restaurant
Convenience Stores
Others
Chapter 11. Asia Pacific Bottled Beverages Analysis and Outlook
11.1. Asia Pacific Bottled Beverages Revenue (USD Million), and Revenue (USD Million) by Segments (2021-2032)
11.1.1. Asia Pacific Bottled Beverages Revenue (USD Million) by Type (2021-2032)
11.1.2. Asia Pacific Bottled Beverages Revenue (USD Million) by Application (2021-2032)
11.1.3. Asia Pacific Bottled Beverages Revenue (USD Million) by Product (2021-2032)
By Type
Alcoholic Beverages
Carbonated Drinks
Fruit and Vegetable Juice Drinks
Functional Drink
Tea Drinks
Milk Drink
Coffee Drink
By Application
Third-party Online Shopping Platform
Fresh E-commerce
Supermarkets/Hypermarkets
Specialty Stores
Restaurant
Convenience Stores
Others
Chapter 12. South America Bottled Beverages Analysis and Outlook
12.1. South America Bottled Beverages Revenue (USD Million), by Segments (2021-2032)
12.1.1. South America Bottled Beverages Revenue (USD Million) by Type (2021-2032)
12.1.2. South America Bottled Beverages Revenue (USD Million) by Application (2021-2032)
12.1.3. South America Bottled Beverages Revenue (USD Million) by Product (2021-2032)
By Type
Alcoholic Beverages
Carbonated Drinks
Fruit and Vegetable Juice Drinks
Functional Drink
Tea Drinks
Milk Drink
Coffee Drink
By Application
Third-party Online Shopping Platform
Fresh E-commerce
Supermarkets/Hypermarkets
Specialty Stores
Restaurant
Convenience Stores
Others
Chapter 13. Middle East and Africa Bottled Beverages Analysis and Outlook
13.1. Middle East and Africa Bottled Beverages Revenue (USD Million), by Segments (2021-2032)
13.1.1. Middle East and Africa Bottled Beverages Revenue (USD Million) by Type (2021-2032)
13.1.2. Middle East and Africa Bottled Beverages Revenue (USD Million) by Application (2021-2032)
13.1.3. Middle East and Africa Bottled Beverages Revenue (USD Million) by Product (2021-2032)
By Type
Alcoholic Beverages
Carbonated Drinks
Fruit and Vegetable Juice Drinks
Functional Drink
Tea Drinks
Milk Drink
Coffee Drink
By Application
Third-party Online Shopping Platform
Fresh E-commerce
Supermarkets/Hypermarkets
Specialty Stores
Restaurant
Convenience Stores
Others
Chapter 14. Bottled Beverages Company Profiles
14.1 Business Overview
14.2 Product Profiles
14.3 SWOT Profiles
14.5 Recent Developments
14.6 Financial Profile
List of Companies
Beijing Sanyuan Foods
BiotechUSA
Bright Food
CG Roxane
Coffee Roasters
CRYSTAL Ltd
Dr Pepper
Dydo
Elixia
Evian
Fresh Del Monte Produce
Grimmway Farms
Guangzhou Xiangxue Asia Beverage
Haitai
Icelandic Glacial
Lotte
Mengniu Dairy
Mountain Valley Spring
Nongfu Spring
Ocean Spray
OKF
Old Orchard Brands
PepsiCo
Perrier
Shanghai Maling Aquarius
Shifu.Kong
Shijiazhuang Junlebao Dairy
Suntory
Tenwow
The Coca-Cola Company
The Hershey Company
Unicer
Uni-President Enterprises Corp
Vichy Catalan
Wahaha
Watsons
Wei Chuan Foods Corp
Welch Food Inc
Yili Industrial Group
15. Methodology and Data Sources
15.1 Customization Offerings
15.2 Subscription Services
15.3 Related Reports
15.4 Publisher Expertise
LIST OF TABLES
Table 1 Market Segmentation Analysis
Table 2 Global Bottled Beverages Market Share of Leading Companies, 2023
Table 3 Product Offerings of Leading Companies
Table 4 Low Growth Scenario Forecasts
Table 5 Reference Case Growth Scenario
Table 6 High Growth Case Scenario
Table 7 Global Bottled Beverages Revenue (USD Million) And CAGR (%) By Type (2021-2032)
Table 8 Global Bottled Beverages Revenue (USD Million) And CAGR (%) By Application (2021-2032)
Table 9 Global Bottled Beverages Revenue (USD Million) And CAGR (%) By Product (2021-2032)
Table 10 Global Bottled Beverages Market Revenue (USD Million) By Regions (2021-2032)
Table 11 Global Bottled Beverages Market Share (%) By Regions (2021-2032)
Table 12 North America Bottled Beverages Revenue (USD Million) By Country (2021-2032)
Table 13 Europe Bottled Beverages Revenue (USD Million) By Country (2021-2032)
Table 14 Asia Pacific Bottled Beverages Revenue (USD Million) By Country (2021-2032)
Table 15 South America Bottled Beverages Revenue (USD Million) By Country (2021-2032)
Table 16 Middle East and Africa Bottled Beverages Revenue (USD Million) By Region (2021-2032)
Table 17 North America Bottled Beverages Revenue (USD Million) By Type (2021-2032)
Table 18 North America Bottled Beverages Revenue (USD Million) By Application (2021-2032)
Table 19 North America Bottled Beverages Revenue (USD Million) By Product (2021-2032)
Table 20 Europe Bottled Beverages Revenue (USD Million) By Type (2021-2032)
Table 21 Europe Bottled Beverages Revenue (USD Million) By Application (2021-2032)
Table 22 Europe Bottled Beverages Revenue (USD Million) By Product (2021-2032)
Table 23 Asia Pacific Bottled Beverages Revenue (USD Million) By Type (2021-2032)
Table 24 Asia Pacific Bottled Beverages Revenue (USD Million) By Application (2021-2032)
Table 25 Asia Pacific Bottled Beverages Revenue (USD Million) By Product (2021-2032)
Table 26 South America Bottled Beverages Revenue (USD Million) By Type (2021-2032)
Table 27 South America Bottled Beverages Revenue (USD Million) By Application (2021-2032)
Table 28 South America Bottled Beverages Revenue (USD Million) By Product (2021-2032)
Table 29 Middle East and Africa Bottled Beverages Revenue (USD Million) By Type (2021-2032)
Table 30 Middle East and Africa Bottled Beverages Revenue (USD Million) By Application (2021-2032)
Table 31 Middle East and Africa Bottled Beverages Revenue (USD Million) By Product (2021-2032)
LIST OF FIGURES
Figure 1. Market Scope
Figure 2. Pricing Forecasts Per Unit, 2023- 2032
Figure 3. Porter’s Five Forces
Figure 4. Global Bottled Beverages Market Revenue (USD Million) By Regions (2021-2032)
Figure 5. Global Bottled Beverages Market Share (%) By Regions (2023)
Figure 6. North America Bottled Beverages Revenue (USD Million) By Country (2021-2032)
Figure 7. United States Bottled Beverages Revenue (USD Million) By Country (2021-2032)
Figure 8. Canada Bottled Beverages Revenue (USD Million) By Country (2021-2032)
Figure 9. Mexico Bottled Beverages Revenue (USD Million) By Country (2021-2032)
Figure 10. Europe Bottled Beverages Revenue (USD Million) By Country (2021-2032)
Figure 11. Germany Bottled Beverages Revenue (USD Million) By Country (2021-2032)
Figure 12. France Bottled Beverages Revenue (USD Million) By Country (2021-2032)
Figure 13. United Kingdom Bottled Beverages Revenue (USD Million) By Country (2021-2032)
Figure 14. Spain Bottled Beverages Revenue (USD Million) By Country (2021-2032)
Figure 15. Italy Bottled Beverages Revenue (USD Million) By Country (2021-2032)
Figure 16. Russia Bottled Beverages Revenue (USD Million) By Country (2021-2032)
Figure 17. Rest of Europe Bottled Beverages Revenue (USD Million) By Country (2021-2032)
Figure 11. Asia Pacific Bottled Beverages Revenue (USD Million) By Country (2021-2032)
Figure 12. China Bottled Beverages Revenue (USD Million) By Country (2021-2032)
Figure 13. Japan Bottled Beverages Revenue (USD Million) By Country (2021-2032)
Figure 14. India Bottled Beverages Revenue (USD Million) By Country (2021-2032)
Figure 15. South Korea Bottled Beverages Revenue (USD Million) By Country (2021-2032)
Figure 16. Australia Bottled Beverages Revenue (USD Million) By Country (2021-2032)
Figure 17. South East Asia Bottled Beverages Revenue (USD Million) By Country (2021-2032)
Figure 18. South America Bottled Beverages Revenue (USD Million) By Country (2021-2032)
Figure 19. Brazil Bottled Beverages Revenue (USD Million) By Country (2021-2032)
Figure 20. Argentina Bottled Beverages Revenue (USD Million) By Country (2021-2032)
Figure 21. Rest of Asia Pacific Bottled Beverages Revenue (USD Million) By Country (2021-2032)
Figure 22. Middle East and Africa Bottled Beverages Revenue (USD Million) By Region (2021-2032)
Figure 23. Saudi Arabia Bottled Beverages Revenue (USD Million) By Region (2021-2032)
Figure 24. The UAE Bottled Beverages Revenue (USD Million) By Region (2021-2032)
Figure 25. Rest of Middle East Bottled Beverages Revenue (USD Million) By Region (2021-2032)
Figure 26. South Africa Bottled Beverages Revenue (USD Million) By Region (2021-2032)
Figure 27. Africa Bottled Beverages Revenue (USD Million) By Region (2021-2032)
Figure 28. North America Bottled Beverages Revenue (USD Million) By Type (2021-2032)
Figure 29. North America Bottled Beverages Revenue (USD Million) By Application (2021-2032)
Figure 30. North America Bottled Beverages Revenue (USD Million) By Product (2021-2032)
Figure 31. Europe Bottled Beverages Revenue (USD Million) By Type (2021-2032)
Figure 32. Europe Bottled Beverages Revenue (USD Million) By Application (2021-2032)
Figure 33. Europe Bottled Beverages Revenue (USD Million) By Product (2021-2032)
Figure 34. Asia Pacific Bottled Beverages Revenue (USD Million) By Type (2021-2032)
Figure 35. Asia Pacific Bottled Beverages Revenue (USD Million) By Application (2021-2032)
Figure 36. Asia Pacific Bottled Beverages Revenue (USD Million) By Product (2021-2032)
Figure 37. South America Bottled Beverages Revenue (USD Million) By Type (2021-2032)
Figure 38. South America Bottled Beverages Revenue (USD Million) By Application (2021-2032)
Figure 39. South America Bottled Beverages Revenue (USD Million) By Product (2021-2032)
Figure 40. Middle East and Africa Bottled Beverages Revenue (USD Million) By Type (2021-2032)
Figure 41. Middle East and Africa Bottled Beverages Revenue (USD Million) By Application (2021-2032)
Figure 42. Middle East and Africa Bottled Beverages Revenue (USD Million) By Product (2021-2032)
By Type
Alcoholic Beverages
Carbonated Drinks
Fruit and Vegetable Juice Drinks
Functional Drink
Tea Drinks
Milk Drink
Coffee Drink
By Application
Third-party Online Shopping Platform
Fresh E-commerce
Supermarkets/Hypermarkets
Specialty Stores
Restaurant
Convenience Stores
Others
Countries Analyzed
North America (US, Canada, Mexico)
Europe (Germany, UK, France, Spain, Italy, Russia, Rest of Europe)
Asia Pacific (China, India, Japan, South Korea, Australia, South East Asia, Rest of Asia)
South America (Brazil, Argentina, Rest of South America)
Middle East and Africa (Saudi Arabia, UAE, Rest of Middle East, South Africa, Egypt, Rest of Africa)
