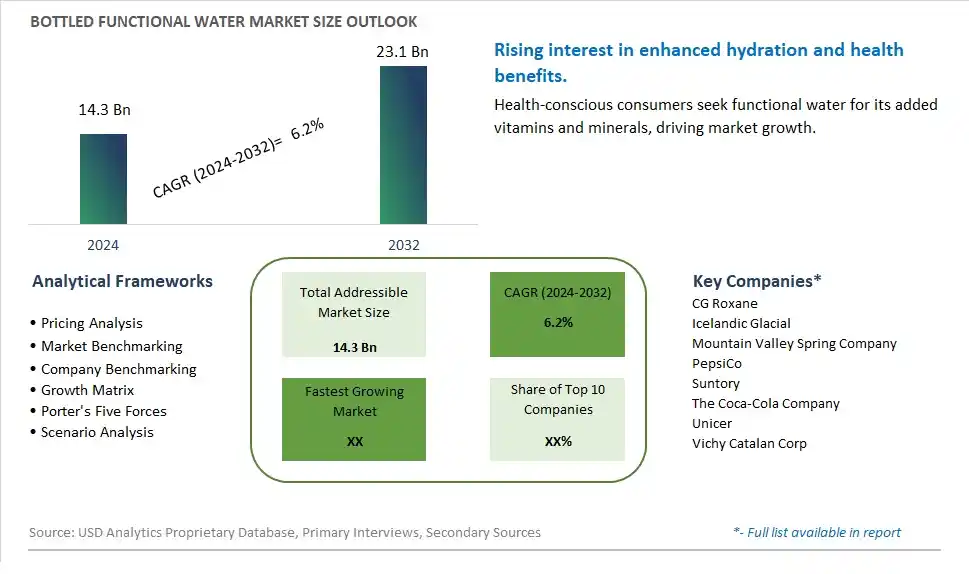
Global Bottled Functional Water Market Size is valued at $14.3 Billion in 2024 and is forecast to register a growth rate (CAGR) of 6.2% to reach $23.1 Billion by 2032.
The global Bottled Functional Water Market Comprehensive Study analyzes and forecasts the market size across 6 regions and 24 countries for diverse segments -By Type (PET Bottles, Stand-Up Pouches, Glass Bottles, Others), By Application (Retail Stores, Supermarkets, E-retailers)
An Introduction to Bottled Functional Water Market
The Bottled Functional Water market in 2024 is expanding rapidly, driven by the increasing consumer demand for hydration solutions that offer additional health benefits. Bottled functional water, which includes water enhanced with vitamins, minerals, electrolytes, and other beneficial ingredients, is popular among health-conscious consumers seeking convenient and effective hydration. The market is supported by the growing trend towards wellness and functional beverages that provide more than just basic hydration. Advances in formulation and packaging technologies are enhancing the efficacy, taste, and convenience of functional waters. The market is also benefiting from the rising awareness of the importance of hydration for overall health and well-being.
Bottled Functional Water Competitive Landscape
The market report analyses the leading companies in the industry including CG Roxane, Icelandic Glacial, Mountain Valley Spring Company, PepsiCo, Suntory, The Coca-Cola Company, Unicer, Vichy Catalan Corp, and Others.
Bottled Functional Water Market Dynamics
Bottled Functional Water Market Trend: Growing Demand for Functional Beverages
One of the most prominent trends in the Bottled Functional Water market is the growing demand for functional beverages among health-conscious consumers. Functional waters are gaining popularity due to their added health benefits, such as hydration, vitamins, minerals, and other bioactive ingredients. Consumers are increasingly seeking beverages that offer not just hydration but also specific functional advantages to support their well-being.
Bottled Functional Water Market Driver: Health and Wellness Trends
A significant driver of the Bottled Functional Water market is the prevailing health and wellness trends. As consumers become more health-conscious and proactive about their well-being, they are turning to functional beverages like bottled functional water as an alternative to sugary sodas or artificially flavored drinks. The emphasis on hydration, nutrition, and functional benefits is propelling the growth of this market segment.
Bottled Functional Water Market Opportunity: Innovation in Ingredients and Packaging
An opportunity within the Bottled Functional Water market lies in innovation, particularly in ingredients and packaging. Companies can capitalize on consumer preferences for specific health benefits by introducing new functional water variants with ingredients like vitamins, antioxidants, probiotics, or electrolytes. Moreover, exploring innovative and sustainable packaging solutions, such as eco-friendly materials or convenient portable formats, can enhance the appeal of bottled functional water and cater to evolving consumer needs.
Bottled Functional Water Market Share Analysis: PET Bottles segment generated the highest revenue share in the industry
The PET Bottles segment stands out as the largest within the Bottled Functional Water Market, holding a substantial share of the overall market. This segment's dominance can be attributed to several key factors driving consumer preferences and market dynamics. Firstly, PET bottles offer convenience, portability, and durability, making them a preferred packaging choice for functional water products. Consumers appreciate the lightweight and shatter-resistant nature of PET bottles, which makes them suitable for on-the-go consumption and outdoor activities. Additionally, the widespread availability of PET bottles in various sizes and shapes caters to different consumer needs and usage occasions. Further, the transparency of PET bottles allows consumers to see the product inside, instilling trust and confidence in the quality and freshness of the functional water. Furthermore, advancements in PET bottle technology, such as improved recyclability and environmental sustainability, align with consumer preferences for eco-friendly packaging solutions. As a result, the PET Bottles segment continues to lead the Bottled Functional Water Market, offering opportunities for brands and manufacturers to innovate and meet evolving consumer demands for functional hydration solutions.
Bottled Functional Water Market Share Analysis: E-retailers is the fastest growing segment over the forecast period to 2032
The E-retailers segment within the Bottled Functional Water Market is experiencing rapid growth and is anticipated to continue expanding significantly until 2032. This surge can be attributed to several key factors driving consumer behavior and market dynamics. Firstly, the increasing adoption of e-commerce platforms and digitalization of retail channels have transformed the way consumers purchase bottled functional water. E-retailers offer consumers a convenient and accessible way to explore, compare, and purchase a wide variety of functional water products from different brands and suppliers. Additionally, the Past few yearsaccelerated the shift towards online shopping as consumers sought safer and contactless shopping experiences, leading to a surge in online beverage sales. Furthermore, e-retailers provide a platform for smaller and niche functional water brands to reach a broader audience and compete with larger players in the market. The convenience of doorstep delivery, wide product assortment, and personalized recommendations contribute to the segment's fast growth. As a result, the E-retailers segment emerges as the fastest-growing segment within the Bottled Functional Water Market, presenting significant opportunities for brands and online retailers to innovate and capitalize on the growing trend of online beverage shopping.
Bottled Functional Water Market Segmentation
By Type
PET Bottles
Stand-Up Pouches
Glass Bottles
Others
By Application
Retail Stores
Supermarkets
E-retailers
Countries Analyzed
North America (US, Canada, Mexico)
Europe (Germany, UK, France, Spain, Italy, Russia, Rest of Europe)
Asia Pacific (China, India, Japan, South Korea, Australia, South East Asia, Rest of Asia)
South America (Brazil, Argentina, Rest of South America)
Middle East and Africa (Saudi Arabia, UAE, Rest of Middle East, South Africa, Egypt, Rest of Africa)
Bottled Functional Water Companies Profiled in the Study
CG Roxane
Icelandic Glacial
Mountain Valley Spring Company
PepsiCo
Suntory
The Coca-Cola Company
Unicer
Vichy Catalan Corp
*- List Not Exhaustive
Chapter 1. TABLE OF CONTENTS
Chapter 2. Introduction to Bottled Functional Water Market
2.1. Market Overview
2.2. Key Statistics and Report Highlights
2.3. Scope of the Comprehensive Study
2.3.1. Market Definition
2.3.2 Countries and Regions Covered
2.3.3 Research Objective
2.3.4 Units, Currency, and Conversions
2.3.5 Industry Value Chain
2.4. Key Market Segments
2.5. Key Companies
2.6. Study Period
Chapter 3. Strategic Analysis Review
3.1. Bottled Functional Water Pricing Analysis and Forecast
3.2. Porter’s Five Forces
3.3. Market Ecosystem
3.4. SWOT Analysis
3.5. Regulatory Scenario
3.3. Effects of Inflation, Russia-Ukraine War, moderating economic growth, and other macroeconomic factors
Chapter 4. Competitive Landscape
4.1. Market Share Analysis
4.1.1. Global Bottled Functional Water Market Share by Company, 2023
4.1.2. Product Offerings of Leading Bottled Functional Water Companies
4.2. Market Entropy
4.2.1. New Product Launches in the Industry
4.2.2. Mergers, Acquisitions, Joint ventures, and Partnerships
4.3. Key Strategies and Best Practices
Chapter 5. Global Market Projections: Best, Reference, and Low Case Scenarios
5.1. Growth Analysis- Case Scenario Definitions
5.2. Low Growth Case Scenario Forecasts
5.3. Reference Growth Case Scenario Forecasts
5.4. High Growth Case Scenario Forecasts
Chapter 6. Market Dynamics
6.1. Bottled Functional Water Market Drivers
6.2. Bottled Functional Water Market Challenges
6.6. Bottled Functional Water Market Opportunities
6.4. Bottled Functional Water Market Trends
Chapter 7. Global Bottled Functional Water Market Outlook Trends
7.1. Global Bottled Functional Water Revenue (USD Million) and CAGR (%) by Type (2021-2032)
7.2. Global Bottled Functional Water Revenue (USD Million) and CAGR (%) by Application (2021-2032)
7.3. Global Bottled Functional Water Revenue (USD Million) and CAGR (%) by Product (2021-2032)
By Type
PET Bottles
Stand-Up Pouches
Glass Bottles
Others
By Application
Retail Stores
Supermarkets
E-retailers
Chapter 8. Global Bottled Functional Water Regional Analysis and Outlook
8.1. Global Bottled Functional Water Revenue (USD Million) By Regions (2021- 2032)
8.2. North America Bottled Functional Water Revenue (USD Million) by Country (2021-2032)
8.2.1. United States Bottled Functional Water Regional Analysis and Outlook
8.2.2. Canada Bottled Functional Water Regional Analysis and Outlook
8.2.3. Mexico Bottled Functional Water Regional Analysis and Outlook
8.3. Europe Bottled Functional Water Revenue (USD Million), by Country (2021-2032)
8.3.1. Germany Bottled Functional Water Regional Analysis and Outlook
8.3.2. France Bottled Functional Water Regional Analysis and Outlook
8.3.3. United Kingdom Bottled Functional Water Regional Analysis and Outlook
8.3.4. Spain Bottled Functional Water Regional Analysis and Outlook
8.3.5. Italy Bottled Functional Water Regional Analysis and Outlook
8.3.6. Russia Bottled Functional Water Regional Analysis and Outlook
8.3.7. Rest of Europe Bottled Functional Water Regional Analysis and Outlook
8.4. Asia Pacific Bottled Functional Water Revenue (USD Million) by Country (2021-2032)
8.4.1. China Bottled Functional Water Regional Analysis and Outlook
8.4.2. Japan Bottled Functional Water Regional Analysis and Outlook
8.4.3. India Bottled Functional Water Regional Analysis and Outlook
8.4.4. South Korea Bottled Functional Water Regional Analysis and Outlook
8.4.5. Australia Bottled Functional Water Regional Analysis and Outlook
8.4.6. South East Asia Bottled Functional Water Regional Analysis and Outlook
8.4.7. Rest of Asia Pacific Bottled Functional Water Regional Analysis and Outlook
8.5. South America Bottled Functional Water Revenue (USD Million), by Country (2021-2032)
8.5.1. Brazil Bottled Functional Water Regional Analysis and Outlook
8.5.2. Argentina Bottled Functional Water Regional Analysis and Outlook
8.5.3. Rest of South America Bottled Functional Water Regional Analysis and Outlook
8.6. Middle East and Africa Bottled Functional Water Revenue (USD Million) by Country (2021-2032)
8.6.1. Middle East Bottled Functional Water Regional Analysis and Outlook
8.6.2. Africa Bottled Functional Water Regional Analysis and Outlook
Chapter 9. North America Bottled Functional Water Analysis and Outlook
9.1. North America Bottled Functional Water Revenue (USD Million) by Segments (2021-2032)
9.1.1. North America Bottled Functional Water Revenue (USD Million) by Type (2021-2032)
9.1.2. North America Bottled Functional Water Revenue (USD Million) by Application (2021-2032)
9.1.3. North America Bottled Functional Water Revenue (USD Million) by Product (2021-2032)
By Type
PET Bottles
Stand-Up Pouches
Glass Bottles
Others
By Application
Retail Stores
Supermarkets
E-retailers
Chapter 10. Europe Bottled Functional Water Analysis and Outlook
10.1. Europe Bottled Functional Water Revenue (USD Million), by Segments (USD Million) (2021-2032)
10.1.1. Europe Bottled Functional Water Revenue (USD Million) by Type (2021-2032)
10.1.2. Europe Bottled Functional Water Revenue (USD Million) by Application (2021-2032)
10.1.3. Europe Bottled Functional Water Revenue (USD Million) by Product (2021-2032)
By Type
PET Bottles
Stand-Up Pouches
Glass Bottles
Others
By Application
Retail Stores
Supermarkets
E-retailers
Chapter 11. Asia Pacific Bottled Functional Water Analysis and Outlook
11.1. Asia Pacific Bottled Functional Water Revenue (USD Million), and Revenue (USD Million) by Segments (2021-2032)
11.1.1. Asia Pacific Bottled Functional Water Revenue (USD Million) by Type (2021-2032)
11.1.2. Asia Pacific Bottled Functional Water Revenue (USD Million) by Application (2021-2032)
11.1.3. Asia Pacific Bottled Functional Water Revenue (USD Million) by Product (2021-2032)
By Type
PET Bottles
Stand-Up Pouches
Glass Bottles
Others
By Application
Retail Stores
Supermarkets
E-retailers
Chapter 12. South America Bottled Functional Water Analysis and Outlook
12.1. South America Bottled Functional Water Revenue (USD Million), by Segments (2021-2032)
12.1.1. South America Bottled Functional Water Revenue (USD Million) by Type (2021-2032)
12.1.2. South America Bottled Functional Water Revenue (USD Million) by Application (2021-2032)
12.1.3. South America Bottled Functional Water Revenue (USD Million) by Product (2021-2032)
By Type
PET Bottles
Stand-Up Pouches
Glass Bottles
Others
By Application
Retail Stores
Supermarkets
E-retailers
Chapter 13. Middle East and Africa Bottled Functional Water Analysis and Outlook
13.1. Middle East and Africa Bottled Functional Water Revenue (USD Million), by Segments (2021-2032)
13.1.1. Middle East and Africa Bottled Functional Water Revenue (USD Million) by Type (2021-2032)
13.1.2. Middle East and Africa Bottled Functional Water Revenue (USD Million) by Application (2021-2032)
13.1.3. Middle East and Africa Bottled Functional Water Revenue (USD Million) by Product (2021-2032)
By Type
PET Bottles
Stand-Up Pouches
Glass Bottles
Others
By Application
Retail Stores
Supermarkets
E-retailers
Chapter 14. Bottled Functional Water Company Profiles
14.1 Business Overview
14.2 Product Profiles
14.3 SWOT Profiles
14.5 Recent Developments
14.6 Financial Profile
List of Companies
CG Roxane
Icelandic Glacial
Mountain Valley Spring Company
PepsiCo
Suntory
The Coca-Cola Company
Unicer
Vichy Catalan Corp
15. Methodology and Data Sources
15.1 Customization Offerings
15.2 Subscription Services
15.3 Related Reports
15.4 Publisher Expertise
LIST OF TABLES
Table 1 Market Segmentation Analysis
Table 2 Global Bottled Functional Water Market Share of Leading Companies, 2023
Table 3 Product Offerings of Leading Companies
Table 4 Low Growth Scenario Forecasts
Table 5 Reference Case Growth Scenario
Table 6 High Growth Case Scenario
Table 7 Global Bottled Functional Water Revenue (USD Million) And CAGR (%) By Type (2021-2032)
Table 8 Global Bottled Functional Water Revenue (USD Million) And CAGR (%) By Application (2021-2032)
Table 9 Global Bottled Functional Water Revenue (USD Million) And CAGR (%) By Product (2021-2032)
Table 10 Global Bottled Functional Water Market Revenue (USD Million) By Regions (2021-2032)
Table 11 Global Bottled Functional Water Market Share (%) By Regions (2021-2032)
Table 12 North America Bottled Functional Water Revenue (USD Million) By Country (2021-2032)
Table 13 Europe Bottled Functional Water Revenue (USD Million) By Country (2021-2032)
Table 14 Asia Pacific Bottled Functional Water Revenue (USD Million) By Country (2021-2032)
Table 15 South America Bottled Functional Water Revenue (USD Million) By Country (2021-2032)
Table 16 Middle East and Africa Bottled Functional Water Revenue (USD Million) By Region (2021-2032)
Table 17 North America Bottled Functional Water Revenue (USD Million) By Type (2021-2032)
Table 18 North America Bottled Functional Water Revenue (USD Million) By Application (2021-2032)
Table 19 North America Bottled Functional Water Revenue (USD Million) By Product (2021-2032)
Table 20 Europe Bottled Functional Water Revenue (USD Million) By Type (2021-2032)
Table 21 Europe Bottled Functional Water Revenue (USD Million) By Application (2021-2032)
Table 22 Europe Bottled Functional Water Revenue (USD Million) By Product (2021-2032)
Table 23 Asia Pacific Bottled Functional Water Revenue (USD Million) By Type (2021-2032)
Table 24 Asia Pacific Bottled Functional Water Revenue (USD Million) By Application (2021-2032)
Table 25 Asia Pacific Bottled Functional Water Revenue (USD Million) By Product (2021-2032)
Table 26 South America Bottled Functional Water Revenue (USD Million) By Type (2021-2032)
Table 27 South America Bottled Functional Water Revenue (USD Million) By Application (2021-2032)
Table 28 South America Bottled Functional Water Revenue (USD Million) By Product (2021-2032)
Table 29 Middle East and Africa Bottled Functional Water Revenue (USD Million) By Type (2021-2032)
Table 30 Middle East and Africa Bottled Functional Water Revenue (USD Million) By Application (2021-2032)
Table 31 Middle East and Africa Bottled Functional Water Revenue (USD Million) By Product (2021-2032)
LIST OF FIGURES
Figure 1. Market Scope
Figure 2. Pricing Forecasts Per Unit, 2023- 2032
Figure 3. Porter’s Five Forces
Figure 4. Global Bottled Functional Water Market Revenue (USD Million) By Regions (2021-2032)
Figure 5. Global Bottled Functional Water Market Share (%) By Regions (2023)
Figure 6. North America Bottled Functional Water Revenue (USD Million) By Country (2021-2032)
Figure 7. United States Bottled Functional Water Revenue (USD Million) By Country (2021-2032)
Figure 8. Canada Bottled Functional Water Revenue (USD Million) By Country (2021-2032)
Figure 9. Mexico Bottled Functional Water Revenue (USD Million) By Country (2021-2032)
Figure 10. Europe Bottled Functional Water Revenue (USD Million) By Country (2021-2032)
Figure 11. Germany Bottled Functional Water Revenue (USD Million) By Country (2021-2032)
Figure 12. France Bottled Functional Water Revenue (USD Million) By Country (2021-2032)
Figure 13. United Kingdom Bottled Functional Water Revenue (USD Million) By Country (2021-2032)
Figure 14. Spain Bottled Functional Water Revenue (USD Million) By Country (2021-2032)
Figure 15. Italy Bottled Functional Water Revenue (USD Million) By Country (2021-2032)
Figure 16. Russia Bottled Functional Water Revenue (USD Million) By Country (2021-2032)
Figure 17. Rest of Europe Bottled Functional Water Revenue (USD Million) By Country (2021-2032)
Figure 11. Asia Pacific Bottled Functional Water Revenue (USD Million) By Country (2021-2032)
Figure 12. China Bottled Functional Water Revenue (USD Million) By Country (2021-2032)
Figure 13. Japan Bottled Functional Water Revenue (USD Million) By Country (2021-2032)
Figure 14. India Bottled Functional Water Revenue (USD Million) By Country (2021-2032)
Figure 15. South Korea Bottled Functional Water Revenue (USD Million) By Country (2021-2032)
Figure 16. Australia Bottled Functional Water Revenue (USD Million) By Country (2021-2032)
Figure 17. South East Asia Bottled Functional Water Revenue (USD Million) By Country (2021-2032)
Figure 18. South America Bottled Functional Water Revenue (USD Million) By Country (2021-2032)
Figure 19. Brazil Bottled Functional Water Revenue (USD Million) By Country (2021-2032)
Figure 20. Argentina Bottled Functional Water Revenue (USD Million) By Country (2021-2032)
Figure 21. Rest of Asia Pacific Bottled Functional Water Revenue (USD Million) By Country (2021-2032)
Figure 22. Middle East and Africa Bottled Functional Water Revenue (USD Million) By Region (2021-2032)
Figure 23. Saudi Arabia Bottled Functional Water Revenue (USD Million) By Region (2021-2032)
Figure 24. The UAE Bottled Functional Water Revenue (USD Million) By Region (2021-2032)
Figure 25. Rest of Middle East Bottled Functional Water Revenue (USD Million) By Region (2021-2032)
Figure 26. South Africa Bottled Functional Water Revenue (USD Million) By Region (2021-2032)
Figure 27. Africa Bottled Functional Water Revenue (USD Million) By Region (2021-2032)
Figure 28. North America Bottled Functional Water Revenue (USD Million) By Type (2021-2032)
Figure 29. North America Bottled Functional Water Revenue (USD Million) By Application (2021-2032)
Figure 30. North America Bottled Functional Water Revenue (USD Million) By Product (2021-2032)
Figure 31. Europe Bottled Functional Water Revenue (USD Million) By Type (2021-2032)
Figure 32. Europe Bottled Functional Water Revenue (USD Million) By Application (2021-2032)
Figure 33. Europe Bottled Functional Water Revenue (USD Million) By Product (2021-2032)
Figure 34. Asia Pacific Bottled Functional Water Revenue (USD Million) By Type (2021-2032)
Figure 35. Asia Pacific Bottled Functional Water Revenue (USD Million) By Application (2021-2032)
Figure 36. Asia Pacific Bottled Functional Water Revenue (USD Million) By Product (2021-2032)
Figure 37. South America Bottled Functional Water Revenue (USD Million) By Type (2021-2032)
Figure 38. South America Bottled Functional Water Revenue (USD Million) By Application (2021-2032)
Figure 39. South America Bottled Functional Water Revenue (USD Million) By Product (2021-2032)
Figure 40. Middle East and Africa Bottled Functional Water Revenue (USD Million) By Type (2021-2032)
Figure 41. Middle East and Africa Bottled Functional Water Revenue (USD Million) By Application (2021-2032)
Figure 42. Middle East and Africa Bottled Functional Water Revenue (USD Million) By Product (2021-2032)
By Type
PET Bottles
Stand-Up Pouches
Glass Bottles
Others
By Application
Retail Stores
Supermarkets
E-retailers
Countries Analyzed
North America (US, Canada, Mexico)
Europe (Germany, UK, France, Spain, Italy, Russia, Rest of Europe)
Asia Pacific (China, India, Japan, South Korea, Australia, South East Asia, Rest of Asia)
South America (Brazil, Argentina, Rest of South America)
Middle East and Africa (Saudi Arabia, UAE, Rest of Middle East, South Africa, Egypt, Rest of Africa)
