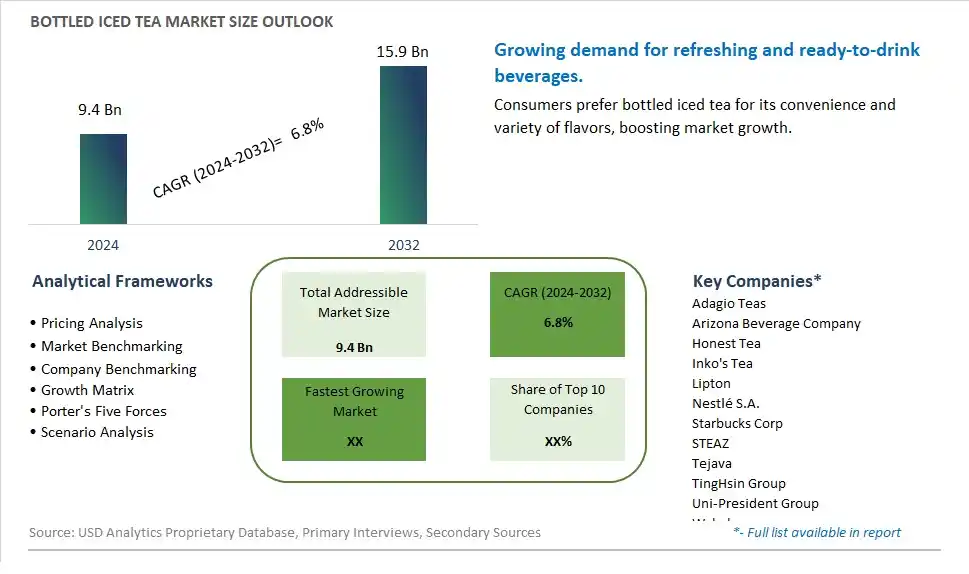
Global Bottled Iced Tea Market Size is valued at $9.4 Billion in 2024 and is forecast to register a growth rate (CAGR) of 6.8% to reach $15.9 Billion by 2032.
The global Bottled Iced Tea Market Comprehensive Study analyzes and forecasts the market size across 6 regions and 24 countries for diverse segments -By Type (Black, Green, Herbal, Rooibos, White), By Application (Commercial, Residential)
An Introduction to Bottled Iced Tea Market
The Bottled Iced Tea market in 2024 is witnessing significant growth, driven by the increasing demand for refreshing and healthful beverage options. Bottled iced tea, available in a variety of flavors and formulations, is popular for its convenience, natural ingredients, and potential health benefits. The market is supported by the growing consumer preference for natural and low-sugar beverages as alternatives to sugary soft drinks. Advances in tea extraction and brewing technologies are enhancing the flavor, nutritional content, and shelf life of bottled iced tea. The market is also benefiting from the trend towards premium and specialty teas, including organic and functional varieties that cater to diverse consumer preferences.
Bottled Iced Tea Competitive Landscape
The market report analyses the leading companies in the industry including Adagio Teas, Arizona Beverage Company, Honest Tea, Inko's Tea, Lipton, Nestlé S.A., Starbucks Corp, STEAZ, Tejava, TingHsin Group, Uni-President Group, Wahaha, and Others.
Bottled Iced Tea Market Dynamics
Bottled Iced Tea Market Trend: Shift Towards Healthier Beverage Choices
One of the most prominent trends in the Bottled Iced Tea market is the shift towards healthier beverage choices. Consumers are increasingly opting for drinks that offer natural ingredients, lower sugar content, and functional benefits such as antioxidants and vitamins. This trend is driving the demand for bottled iced teas that are perceived as healthier alternatives to sugary sodas and artificially flavored drinks.
Bottled Iced Tea Market Driver: Convenience and On-the-Go Consumption
A significant driver of the Bottled Iced Tea market is the convenience it offers to consumers for on-the-go consumption. Bottled iced teas provide a ready-to-drink solution that can be easily carried and consumed anytime, anywhere. This convenience factor appeals to busy lifestyles and drives the purchase of bottled iced teas among consumers looking for refreshing beverages without the need for preparation.
Bottled Iced Tea Market Opportunity: Diversification of Flavor Profiles
An opportunity within the Bottled Iced Tea market lies in the diversification of flavor profiles. Companies can capitalize on consumer preferences for unique and innovative flavors by introducing new variants of bottled iced teas. Experimenting with exotic fruit flavors, herbal infusions, and tea blends can attract new consumers and cater to diverse taste preferences, thereby expanding market share and driving growth in the bottled iced tea segment.
Bottled Iced Tea Market Share Analysis: Black Tea segment generated the highest revenue share in the industry
The Black Tea segment emerges as the largest within the Bottled Iced Tea Market, holding a significant share of the overall market. This segment's dominance can be attributed to several key factors driving consumer preferences and market dynamics. Firstly, black tea is a widely consumed and well-established beverage globally, known for its robust flavor profile and caffeine content. Consumers often prefer black tea for its familiar taste, energizing properties, and versatility in serving as a refreshing iced beverage. Additionally, the popularity of ready-to-drink bottled black tea products has surged due to their convenience and availability in various packaging formats, catering to different consumption preferences. Further, the extensive distribution networks of major beverage companies and the presence of established black tea brands contribute to the segment's market leadership. Furthermore, the growing trend of health-consciousness among consumers has led to the introduction of innovative black tea blends with added functional benefits, such as antioxidants and vitamins, further boosting the segment's appeal. As a result, the Black Tea segment continues to lead the Bottled Iced Tea Market, offering opportunities for brands to innovate and meet evolving consumer demands for flavorful and functional iced tea options.
Bottled Iced Tea Market Share Analysis: Commercial is the fastest growing segment over the forecast period to 2032
The Commercial segment within the Bottled Iced Tea Market is experiencing rapid growth and is projected to continue expanding significantly until 2032. This surge can be attributed to several key factors driving market dynamics and consumer behavior. Firstly, the increasing demand for convenient and on-the-go beverage options in commercial settings, such as offices, restaurants, cafes, and hospitality establishments, has fueled the growth of bottled iced tea in the commercial segment. Consumers in these settings often seek refreshing and ready-to-drink beverages to quench their thirst and enjoy a flavorful beverage experience. Additionally, the rising trend of health-consciousness and the preference for natural and low-calorie beverage alternatives have contributed to the popularity of bottled iced tea among health-conscious consumers frequenting commercial establishments. Further, partnerships between bottled iced tea manufacturers and commercial vendors, coupled with strategic marketing initiatives and promotional activities, have expanded the availability and visibility of bottled iced tea products in commercial settings. Furthermore, the convenience of single-serve packaging and the introduction of innovative flavors and functional formulations further drive the growth of the Commercial segment in the Bottled Iced Tea Market. As a result, the Commercial segment emerges as the fastest-growing segment, presenting significant opportunities for brands to cater to the evolving needs and preferences of consumers in commercial environments.
Bottled Iced Tea Market Segmentation
By Type
Black
Green
Herbal
Rooibos
White
By Application
Commercial
Residential
Countries Analyzed
North America (US, Canada, Mexico)
Europe (Germany, UK, France, Spain, Italy, Russia, Rest of Europe)
Asia Pacific (China, India, Japan, South Korea, Australia, South East Asia, Rest of Asia)
South America (Brazil, Argentina, Rest of South America)
Middle East and Africa (Saudi Arabia, UAE, Rest of Middle East, South Africa, Egypt, Rest of Africa)
Bottled Iced Tea Companies Profiled in the Study
Adagio Teas
Arizona Beverage Company
Honest Tea
Inko's Tea
Lipton
Nestlé S.A.
Starbucks Corp
STEAZ
Tejava
TingHsin Group
Uni-President Group
Wahaha
*- List Not Exhaustive
Chapter 1. TABLE OF CONTENTS
Chapter 2. Introduction to Bottled Iced Tea Market
2.1. Market Overview
2.2. Key Statistics and Report Highlights
2.3. Scope of the Comprehensive Study
2.3.1. Market Definition
2.3.2 Countries and Regions Covered
2.3.3 Research Objective
2.3.4 Units, Currency, and Conversions
2.3.5 Industry Value Chain
2.4. Key Market Segments
2.5. Key Companies
2.6. Study Period
Chapter 3. Strategic Analysis Review
3.1. Bottled Iced Tea Pricing Analysis and Forecast
3.2. Porter’s Five Forces
3.3. Market Ecosystem
3.4. SWOT Analysis
3.5. Regulatory Scenario
3.3. Effects of Inflation, Russia-Ukraine War, moderating economic growth, and other macroeconomic factors
Chapter 4. Competitive Landscape
4.1. Market Share Analysis
4.1.1. Global Bottled Iced Tea Market Share by Company, 2023
4.1.2. Product Offerings of Leading Bottled Iced Tea Companies
4.2. Market Entropy
4.2.1. New Product Launches in the Industry
4.2.2. Mergers, Acquisitions, Joint ventures, and Partnerships
4.3. Key Strategies and Best Practices
Chapter 5. Global Market Projections: Best, Reference, and Low Case Scenarios
5.1. Growth Analysis- Case Scenario Definitions
5.2. Low Growth Case Scenario Forecasts
5.3. Reference Growth Case Scenario Forecasts
5.4. High Growth Case Scenario Forecasts
Chapter 6. Market Dynamics
6.1. Bottled Iced Tea Market Drivers
6.2. Bottled Iced Tea Market Challenges
6.6. Bottled Iced Tea Market Opportunities
6.4. Bottled Iced Tea Market Trends
Chapter 7. Global Bottled Iced Tea Market Outlook Trends
7.1. Global Bottled Iced Tea Revenue (USD Million) and CAGR (%) by Type (2021-2032)
7.2. Global Bottled Iced Tea Revenue (USD Million) and CAGR (%) by Application (2021-2032)
7.3. Global Bottled Iced Tea Revenue (USD Million) and CAGR (%) by Product (2021-2032)
By Type
Black
Green
Herbal
Rooibos
White
By Application
Commercial
Residential
Chapter 8. Global Bottled Iced Tea Regional Analysis and Outlook
8.1. Global Bottled Iced Tea Revenue (USD Million) By Regions (2021- 2032)
8.2. North America Bottled Iced Tea Revenue (USD Million) by Country (2021-2032)
8.2.1. United States Bottled Iced Tea Regional Analysis and Outlook
8.2.2. Canada Bottled Iced Tea Regional Analysis and Outlook
8.2.3. Mexico Bottled Iced Tea Regional Analysis and Outlook
8.3. Europe Bottled Iced Tea Revenue (USD Million), by Country (2021-2032)
8.3.1. Germany Bottled Iced Tea Regional Analysis and Outlook
8.3.2. France Bottled Iced Tea Regional Analysis and Outlook
8.3.3. United Kingdom Bottled Iced Tea Regional Analysis and Outlook
8.3.4. Spain Bottled Iced Tea Regional Analysis and Outlook
8.3.5. Italy Bottled Iced Tea Regional Analysis and Outlook
8.3.6. Russia Bottled Iced Tea Regional Analysis and Outlook
8.3.7. Rest of Europe Bottled Iced Tea Regional Analysis and Outlook
8.4. Asia Pacific Bottled Iced Tea Revenue (USD Million) by Country (2021-2032)
8.4.1. China Bottled Iced Tea Regional Analysis and Outlook
8.4.2. Japan Bottled Iced Tea Regional Analysis and Outlook
8.4.3. India Bottled Iced Tea Regional Analysis and Outlook
8.4.4. South Korea Bottled Iced Tea Regional Analysis and Outlook
8.4.5. Australia Bottled Iced Tea Regional Analysis and Outlook
8.4.6. South East Asia Bottled Iced Tea Regional Analysis and Outlook
8.4.7. Rest of Asia Pacific Bottled Iced Tea Regional Analysis and Outlook
8.5. South America Bottled Iced Tea Revenue (USD Million), by Country (2021-2032)
8.5.1. Brazil Bottled Iced Tea Regional Analysis and Outlook
8.5.2. Argentina Bottled Iced Tea Regional Analysis and Outlook
8.5.3. Rest of South America Bottled Iced Tea Regional Analysis and Outlook
8.6. Middle East and Africa Bottled Iced Tea Revenue (USD Million) by Country (2021-2032)
8.6.1. Middle East Bottled Iced Tea Regional Analysis and Outlook
8.6.2. Africa Bottled Iced Tea Regional Analysis and Outlook
Chapter 9. North America Bottled Iced Tea Analysis and Outlook
9.1. North America Bottled Iced Tea Revenue (USD Million) by Segments (2021-2032)
9.1.1. North America Bottled Iced Tea Revenue (USD Million) by Type (2021-2032)
9.1.2. North America Bottled Iced Tea Revenue (USD Million) by Application (2021-2032)
9.1.3. North America Bottled Iced Tea Revenue (USD Million) by Product (2021-2032)
By Type
Black
Green
Herbal
Rooibos
White
By Application
Commercial
Residential
Chapter 10. Europe Bottled Iced Tea Analysis and Outlook
10.1. Europe Bottled Iced Tea Revenue (USD Million), by Segments (USD Million) (2021-2032)
10.1.1. Europe Bottled Iced Tea Revenue (USD Million) by Type (2021-2032)
10.1.2. Europe Bottled Iced Tea Revenue (USD Million) by Application (2021-2032)
10.1.3. Europe Bottled Iced Tea Revenue (USD Million) by Product (2021-2032)
By Type
Black
Green
Herbal
Rooibos
White
By Application
Commercial
Residential
Chapter 11. Asia Pacific Bottled Iced Tea Analysis and Outlook
11.1. Asia Pacific Bottled Iced Tea Revenue (USD Million), and Revenue (USD Million) by Segments (2021-2032)
11.1.1. Asia Pacific Bottled Iced Tea Revenue (USD Million) by Type (2021-2032)
11.1.2. Asia Pacific Bottled Iced Tea Revenue (USD Million) by Application (2021-2032)
11.1.3. Asia Pacific Bottled Iced Tea Revenue (USD Million) by Product (2021-2032)
By Type
Black
Green
Herbal
Rooibos
White
By Application
Commercial
Residential
Chapter 12. South America Bottled Iced Tea Analysis and Outlook
12.1. South America Bottled Iced Tea Revenue (USD Million), by Segments (2021-2032)
12.1.1. South America Bottled Iced Tea Revenue (USD Million) by Type (2021-2032)
12.1.2. South America Bottled Iced Tea Revenue (USD Million) by Application (2021-2032)
12.1.3. South America Bottled Iced Tea Revenue (USD Million) by Product (2021-2032)
By Type
Black
Green
Herbal
Rooibos
White
By Application
Commercial
Residential
Chapter 13. Middle East and Africa Bottled Iced Tea Analysis and Outlook
13.1. Middle East and Africa Bottled Iced Tea Revenue (USD Million), by Segments (2021-2032)
13.1.1. Middle East and Africa Bottled Iced Tea Revenue (USD Million) by Type (2021-2032)
13.1.2. Middle East and Africa Bottled Iced Tea Revenue (USD Million) by Application (2021-2032)
13.1.3. Middle East and Africa Bottled Iced Tea Revenue (USD Million) by Product (2021-2032)
By Type
Black
Green
Herbal
Rooibos
White
By Application
Commercial
Residential
Chapter 14. Bottled Iced Tea Company Profiles
14.1 Business Overview
14.2 Product Profiles
14.3 SWOT Profiles
14.5 Recent Developments
14.6 Financial Profile
List of Companies
Adagio Teas
Arizona Beverage Company
Honest Tea
Inko's Tea
Lipton
Nestlé S.A.
Starbucks Corp
STEAZ
Tejava
TingHsin Group
Uni-President Group
Wahaha
15. Methodology and Data Sources
15.1 Customization Offerings
15.2 Subscription Services
15.3 Related Reports
15.4 Publisher Expertise
LIST OF TABLES
Table 1 Market Segmentation Analysis
Table 2 Global Bottled Iced Tea Market Share of Leading Companies, 2023
Table 3 Product Offerings of Leading Companies
Table 4 Low Growth Scenario Forecasts
Table 5 Reference Case Growth Scenario
Table 6 High Growth Case Scenario
Table 7 Global Bottled Iced Tea Revenue (USD Million) And CAGR (%) By Type (2021-2032)
Table 8 Global Bottled Iced Tea Revenue (USD Million) And CAGR (%) By Application (2021-2032)
Table 9 Global Bottled Iced Tea Revenue (USD Million) And CAGR (%) By Product (2021-2032)
Table 10 Global Bottled Iced Tea Market Revenue (USD Million) By Regions (2021-2032)
Table 11 Global Bottled Iced Tea Market Share (%) By Regions (2021-2032)
Table 12 North America Bottled Iced Tea Revenue (USD Million) By Country (2021-2032)
Table 13 Europe Bottled Iced Tea Revenue (USD Million) By Country (2021-2032)
Table 14 Asia Pacific Bottled Iced Tea Revenue (USD Million) By Country (2021-2032)
Table 15 South America Bottled Iced Tea Revenue (USD Million) By Country (2021-2032)
Table 16 Middle East and Africa Bottled Iced Tea Revenue (USD Million) By Region (2021-2032)
Table 17 North America Bottled Iced Tea Revenue (USD Million) By Type (2021-2032)
Table 18 North America Bottled Iced Tea Revenue (USD Million) By Application (2021-2032)
Table 19 North America Bottled Iced Tea Revenue (USD Million) By Product (2021-2032)
Table 20 Europe Bottled Iced Tea Revenue (USD Million) By Type (2021-2032)
Table 21 Europe Bottled Iced Tea Revenue (USD Million) By Application (2021-2032)
Table 22 Europe Bottled Iced Tea Revenue (USD Million) By Product (2021-2032)
Table 23 Asia Pacific Bottled Iced Tea Revenue (USD Million) By Type (2021-2032)
Table 24 Asia Pacific Bottled Iced Tea Revenue (USD Million) By Application (2021-2032)
Table 25 Asia Pacific Bottled Iced Tea Revenue (USD Million) By Product (2021-2032)
Table 26 South America Bottled Iced Tea Revenue (USD Million) By Type (2021-2032)
Table 27 South America Bottled Iced Tea Revenue (USD Million) By Application (2021-2032)
Table 28 South America Bottled Iced Tea Revenue (USD Million) By Product (2021-2032)
Table 29 Middle East and Africa Bottled Iced Tea Revenue (USD Million) By Type (2021-2032)
Table 30 Middle East and Africa Bottled Iced Tea Revenue (USD Million) By Application (2021-2032)
Table 31 Middle East and Africa Bottled Iced Tea Revenue (USD Million) By Product (2021-2032)
LIST OF FIGURES
Figure 1. Market Scope
Figure 2. Pricing Forecasts Per Unit, 2023- 2032
Figure 3. Porter’s Five Forces
Figure 4. Global Bottled Iced Tea Market Revenue (USD Million) By Regions (2021-2032)
Figure 5. Global Bottled Iced Tea Market Share (%) By Regions (2023)
Figure 6. North America Bottled Iced Tea Revenue (USD Million) By Country (2021-2032)
Figure 7. United States Bottled Iced Tea Revenue (USD Million) By Country (2021-2032)
Figure 8. Canada Bottled Iced Tea Revenue (USD Million) By Country (2021-2032)
Figure 9. Mexico Bottled Iced Tea Revenue (USD Million) By Country (2021-2032)
Figure 10. Europe Bottled Iced Tea Revenue (USD Million) By Country (2021-2032)
Figure 11. Germany Bottled Iced Tea Revenue (USD Million) By Country (2021-2032)
Figure 12. France Bottled Iced Tea Revenue (USD Million) By Country (2021-2032)
Figure 13. United Kingdom Bottled Iced Tea Revenue (USD Million) By Country (2021-2032)
Figure 14. Spain Bottled Iced Tea Revenue (USD Million) By Country (2021-2032)
Figure 15. Italy Bottled Iced Tea Revenue (USD Million) By Country (2021-2032)
Figure 16. Russia Bottled Iced Tea Revenue (USD Million) By Country (2021-2032)
Figure 17. Rest of Europe Bottled Iced Tea Revenue (USD Million) By Country (2021-2032)
Figure 11. Asia Pacific Bottled Iced Tea Revenue (USD Million) By Country (2021-2032)
Figure 12. China Bottled Iced Tea Revenue (USD Million) By Country (2021-2032)
Figure 13. Japan Bottled Iced Tea Revenue (USD Million) By Country (2021-2032)
Figure 14. India Bottled Iced Tea Revenue (USD Million) By Country (2021-2032)
Figure 15. South Korea Bottled Iced Tea Revenue (USD Million) By Country (2021-2032)
Figure 16. Australia Bottled Iced Tea Revenue (USD Million) By Country (2021-2032)
Figure 17. South East Asia Bottled Iced Tea Revenue (USD Million) By Country (2021-2032)
Figure 18. South America Bottled Iced Tea Revenue (USD Million) By Country (2021-2032)
Figure 19. Brazil Bottled Iced Tea Revenue (USD Million) By Country (2021-2032)
Figure 20. Argentina Bottled Iced Tea Revenue (USD Million) By Country (2021-2032)
Figure 21. Rest of Asia Pacific Bottled Iced Tea Revenue (USD Million) By Country (2021-2032)
Figure 22. Middle East and Africa Bottled Iced Tea Revenue (USD Million) By Region (2021-2032)
Figure 23. Saudi Arabia Bottled Iced Tea Revenue (USD Million) By Region (2021-2032)
Figure 24. The UAE Bottled Iced Tea Revenue (USD Million) By Region (2021-2032)
Figure 25. Rest of Middle East Bottled Iced Tea Revenue (USD Million) By Region (2021-2032)
Figure 26. South Africa Bottled Iced Tea Revenue (USD Million) By Region (2021-2032)
Figure 27. Africa Bottled Iced Tea Revenue (USD Million) By Region (2021-2032)
Figure 28. North America Bottled Iced Tea Revenue (USD Million) By Type (2021-2032)
Figure 29. North America Bottled Iced Tea Revenue (USD Million) By Application (2021-2032)
Figure 30. North America Bottled Iced Tea Revenue (USD Million) By Product (2021-2032)
Figure 31. Europe Bottled Iced Tea Revenue (USD Million) By Type (2021-2032)
Figure 32. Europe Bottled Iced Tea Revenue (USD Million) By Application (2021-2032)
Figure 33. Europe Bottled Iced Tea Revenue (USD Million) By Product (2021-2032)
Figure 34. Asia Pacific Bottled Iced Tea Revenue (USD Million) By Type (2021-2032)
Figure 35. Asia Pacific Bottled Iced Tea Revenue (USD Million) By Application (2021-2032)
Figure 36. Asia Pacific Bottled Iced Tea Revenue (USD Million) By Product (2021-2032)
Figure 37. South America Bottled Iced Tea Revenue (USD Million) By Type (2021-2032)
Figure 38. South America Bottled Iced Tea Revenue (USD Million) By Application (2021-2032)
Figure 39. South America Bottled Iced Tea Revenue (USD Million) By Product (2021-2032)
Figure 40. Middle East and Africa Bottled Iced Tea Revenue (USD Million) By Type (2021-2032)
Figure 41. Middle East and Africa Bottled Iced Tea Revenue (USD Million) By Application (2021-2032)
Figure 42. Middle East and Africa Bottled Iced Tea Revenue (USD Million) By Product (2021-2032)
By Type
Black
Green
Herbal
Rooibos
White
By Application
Commercial
Residential
Countries Analyzed
North America (US, Canada, Mexico)
Europe (Germany, UK, France, Spain, Italy, Russia, Rest of Europe)
Asia Pacific (China, India, Japan, South Korea, Australia, South East Asia, Rest of Asia)
South America (Brazil, Argentina, Rest of South America)
Middle East and Africa (Saudi Arabia, UAE, Rest of Middle East, South Africa, Egypt, Rest of Africa)
