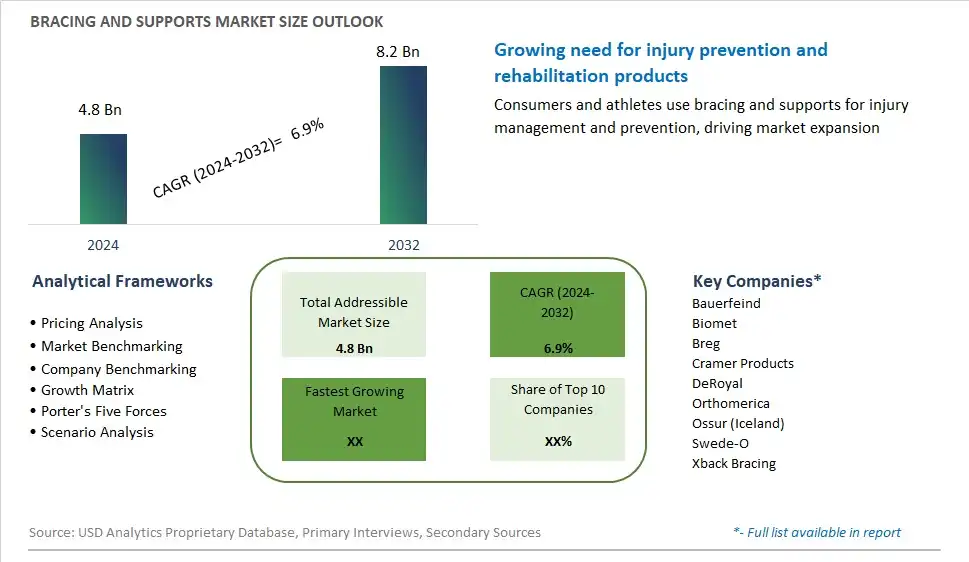
Global Bracing and Supports Market Size is valued at $4.8 Billion in 2024 and is forecast to register a growth rate (CAGR) of 6.9% to reach $8.2 Billion by 2032.
The global Bracing and Supports Market Comprehensive Study analyzes and forecasts the market size across 6 regions and 24 countries for diverse segments -By Type (Knee Braces & Supports, Foot and Ankle Braces & Supports, Spinal Orthoses, Upper Extremity Braces & Supports), By Channel (Direct Sales, Distributor)
An Introduction to Bracing and Supports Market
Bracing and supports play a crucial role in providing stability and relief for individuals with musculoskeletal injuries or conditions, as well as athletes seeking to prevent injury and optimize performance. In 2024, advancements in materials and design have led to a diverse range of braces and supports tailored to specific body parts and activities. From compression sleeves and wraps to orthotic inserts and immobilizers, these products offer targeted support and compression, promoting healing and facilitating mobility. With an aging population and growing emphasis on active lifestyles, bracing and supports continue to be essential tools for maintaining health, mobility, and quality of life across diverse demographics.
Bracing and Supports Competitive Landscape
The market report analyses the leading companies in the industry including Bauerfeind, Biomet, Breg, Cramer Products, DeRoyal, Orthomerica, Ossur (Iceland), Swede-O, Xback Bracing, and Others.
Bracing and Supports Market Dynamics
Bracing and Supports Market Trend: Rising Demand for Injury Prevention and Rehabilitation
The market trend for Bracing and Supports reflects the rising demand for injury prevention and rehabilitation solutions among consumers. With an increasing emphasis on active lifestyles and sports participation, there's a growing awareness of the importance of protecting and supporting the body during physical activities. Braces and supports offer stability, compression, and alignment to injured or vulnerable body parts, aiding in injury prevention and promoting faster recovery. This trend is driven by the desire to maintain optimal physical performance and minimize the risk of injuries, particularly among athletes, fitness enthusiasts, and individuals engaged in physically demanding occupations.
Market Driver: Aging Population and Chronic Conditions Management
A significant driver of the Bracing and Supports market is the aging population and the management of chronic conditions such as arthritis, osteoporosis, and joint pain. As the population ages, there's a higher prevalence of age-related musculoskeletal issues and chronic conditions that require supportive interventions. Braces and supports provide relief from pain, stiffness, and instability associated with these conditions, allowing individuals to maintain mobility and quality of life. The growing incidence of chronic conditions, coupled with the desire for non-invasive and cost-effective treatment options, drives the demand for braces and supports as essential tools for managing symptoms and improving functional outcomes.
Market Opportunity: Integration of Technology and Personalization in Product Offerings
An opportunity in the Bracing and Supports market lies in the integration of technology and personalization in product offerings. Advances in wearable technology, such as smart sensors, adjustable straps, and pressure sensors, present opportunities to enhance the functionality and effectiveness of braces and supports. Incorporating features such as temperature control, moisture-wicking fabrics, and remote monitoring capabilities can improve user comfort and compliance while providing valuable data for healthcare professionals. Additionally, offering personalized solutions through custom-fit braces and supports tailored to individual anatomy and biomechanics can optimize therapeutic outcomes and customer satisfaction. By leveraging technology and customization, companies can differentiate their products in a competitive market landscape and meet the diverse needs of consumers seeking personalized and innovative bracing solutions.
Bracing and Supports Market Share Analysis: Knee Braces & Supports held the dominant market share in 2024
Among the segments in the Bracing and Supports market, knee braces & supports emerge as the largest segment, primarily due to their widespread applicability, prevalence of knee-related injuries, and aging population demographics. Knee braces & supports are designed to provide stability, compression, and protection to the knee joint, addressing a range of conditions such as arthritis, ligament injuries, and post-operative recovery. With an increasing emphasis on sports participation and physical activity, the risk of knee injuries has surged, leading to greater adoption of preventive and rehabilitative measures such as knee braces & supports. Further, the aging population is prone to degenerative knee conditions, driving the demand for supportive devices to maintain mobility and alleviate discomfort. Additionally, advancements in material technology and design innovation have led to the development of lightweight, breathable, and customizable knee braces & supports, enhancing comfort and efficacy. The extensive availability of knee braces & supports across medical supply stores, pharmacies, and online retailers further contributes to their dominance in the market. With their essential role in injury prevention, rehabilitation, and mobility support, knee braces & supports continue to dominate the Bracing and Supports market, meeting the diverse needs of consumers seeking orthopedic solutions for knee-related issues.
Bracing and Supports Market Share Analysis: Direct Sales market is poised to register the fastest growth rae over the forecast period to 2032
Among the channels in the Bracing and Supports market, direct sales emerge as the fastest-growing segment, driven by several key factors. Direct sales involve manufacturers selling their products directly to consumers through various channels such as company-owned stores, e-commerce platforms, and direct-to-consumer marketing initiatives. This approach eliminates the need for intermediaries like distributors, resulting in cost savings for both manufacturers and consumers. Further, direct sales enable manufacturers to establish direct relationships with consumers, gather feedback, and tailor products to meet specific needs, enhancing customer satisfaction and loyalty. The rise of e-commerce platforms has further accelerated the growth of direct sales, providing consumers with convenient access to a wide range of bracing and support products from the comfort of their homes. Additionally, the COVID-19 pandemic has underscored the importance of online shopping, as consumers prioritize safety and social distancing measures, driving the shift towards digital channels. With their cost-effectiveness, consumer-centric approach, and digital capabilities, direct sales continue to spearhead growth in the Bracing and Supports market, meeting the evolving needs and preferences of consumers seeking orthopedic solutions.
Bracing and Supports Market Segmentation
By Type
Knee Braces & Supports
Foot and Ankle Braces & Supports
Spinal Orthoses
Upper Extremity Braces & Supports
By Channel
Direct Sales
Distributor
Countries Analyzed
North America (US, Canada, Mexico)
Europe (Germany, UK, France, Spain, Italy, Russia, Rest of Europe)
Asia Pacific (China, India, Japan, South Korea, Australia, South East Asia, Rest of Asia)
South America (Brazil, Argentina, Rest of South America)
Middle East and Africa (Saudi Arabia, UAE, Rest of Middle East, South Africa, Egypt, Rest of Africa)
Bracing and Supports Companies Profiled in the Study
Bauerfeind
Biomet
Breg
Cramer Products
DeRoyal
Orthomerica
Ossur (Iceland)
Swede-O
Xback Bracing
*- List Not Exhaustive
Chapter 1. TABLE OF CONTENTS
Chapter 2. Introduction to Bracing and Supports Market
2.1. Market Overview
2.2. Key Statistics and Report Highlights
2.3. Scope of the Comprehensive Study
2.3.1. Market Definition
2.3.2 Countries and Regions Covered
2.3.3 Research Objective
2.3.4 Units, Currency, and Conversions
2.3.5 Industry Value Chain
2.4. Key Market Segments
2.5. Key Companies
2.6. Study Period
Chapter 3. Strategic Analysis Review
3.1. Bracing and Supports Pricing Analysis and Forecast
3.2. Porter’s Five Forces
3.3. Market Ecosystem
3.4. SWOT Analysis
3.5. Regulatory Scenario
3.3. Effects of Inflation, Russia-Ukraine War, moderating economic growth, and other macroeconomic factors
Chapter 4. Competitive Landscape
4.1. Market Share Analysis
4.1.1. Global Bracing and Supports Market Share by Company, 2023
4.1.2. Product Offerings of Leading Bracing and Supports Companies
4.2. Market Entropy
4.2.1. New Product Launches in the Industry
4.2.2. Mergers, Acquisitions, Joint ventures, and Partnerships
4.3. Key Strategies and Best Practices
Chapter 5. Global Market Projections: Best, Reference, and Low Case Scenarios
5.1. Growth Analysis- Case Scenario Definitions
5.2. Low Growth Case Scenario Forecasts
5.3. Reference Growth Case Scenario Forecasts
5.4. High Growth Case Scenario Forecasts
Chapter 6. Market Dynamics
6.1. Bracing and Supports Market Drivers
6.2. Bracing and Supports Market Challenges
6.6. Bracing and Supports Market Opportunities
6.4. Bracing and Supports Market Trends
Chapter 7. Global Bracing and Supports Market Outlook Trends
7.1. Global Bracing and Supports Revenue (USD Million) and CAGR (%) by Type (2021-2032)
7.2. Global Bracing and Supports Revenue (USD Million) and CAGR (%) by Application (2021-2032)
7.3. Global Bracing and Supports Revenue (USD Million) and CAGR (%) by Product (2021-2032)
By Type
Knee Braces & Supports
Foot and Ankle Braces & Supports
Spinal Orthoses
Upper Extremity Braces & Supports
By Channel
Direct Sales
Distributor
Chapter 8. Global Bracing and Supports Regional Analysis and Outlook
8.1. Global Bracing and Supports Revenue (USD Million) By Regions (2021- 2032)
8.2. North America Bracing and Supports Revenue (USD Million) by Country (2021-2032)
8.2.1. United States Bracing and Supports Regional Analysis and Outlook
8.2.2. Canada Bracing and Supports Regional Analysis and Outlook
8.2.3. Mexico Bracing and Supports Regional Analysis and Outlook
8.3. Europe Bracing and Supports Revenue (USD Million), by Country (2021-2032)
8.3.1. Germany Bracing and Supports Regional Analysis and Outlook
8.3.2. France Bracing and Supports Regional Analysis and Outlook
8.3.3. United Kingdom Bracing and Supports Regional Analysis and Outlook
8.3.4. Spain Bracing and Supports Regional Analysis and Outlook
8.3.5. Italy Bracing and Supports Regional Analysis and Outlook
8.3.6. Russia Bracing and Supports Regional Analysis and Outlook
8.3.7. Rest of Europe Bracing and Supports Regional Analysis and Outlook
8.4. Asia Pacific Bracing and Supports Revenue (USD Million) by Country (2021-2032)
8.4.1. China Bracing and Supports Regional Analysis and Outlook
8.4.2. Japan Bracing and Supports Regional Analysis and Outlook
8.4.3. India Bracing and Supports Regional Analysis and Outlook
8.4.4. South Korea Bracing and Supports Regional Analysis and Outlook
8.4.5. Australia Bracing and Supports Regional Analysis and Outlook
8.4.6. South East Asia Bracing and Supports Regional Analysis and Outlook
8.4.7. Rest of Asia Pacific Bracing and Supports Regional Analysis and Outlook
8.5. South America Bracing and Supports Revenue (USD Million), by Country (2021-2032)
8.5.1. Brazil Bracing and Supports Regional Analysis and Outlook
8.5.2. Argentina Bracing and Supports Regional Analysis and Outlook
8.5.3. Rest of South America Bracing and Supports Regional Analysis and Outlook
8.6. Middle East and Africa Bracing and Supports Revenue (USD Million) by Country (2021-2032)
8.6.1. Middle East Bracing and Supports Regional Analysis and Outlook
8.6.2. Africa Bracing and Supports Regional Analysis and Outlook
Chapter 9. North America Bracing and Supports Analysis and Outlook
9.1. North America Bracing and Supports Revenue (USD Million) by Segments (2021-2032)
9.1.1. North America Bracing and Supports Revenue (USD Million) by Type (2021-2032)
9.1.2. North America Bracing and Supports Revenue (USD Million) by Application (2021-2032)
9.1.3. North America Bracing and Supports Revenue (USD Million) by Product (2021-2032)
By Type
Knee Braces & Supports
Foot and Ankle Braces & Supports
Spinal Orthoses
Upper Extremity Braces & Supports
By Channel
Direct Sales
Distributor
Chapter 10. Europe Bracing and Supports Analysis and Outlook
10.1. Europe Bracing and Supports Revenue (USD Million), by Segments (USD Million) (2021-2032)
10.1.1. Europe Bracing and Supports Revenue (USD Million) by Type (2021-2032)
10.1.2. Europe Bracing and Supports Revenue (USD Million) by Application (2021-2032)
10.1.3. Europe Bracing and Supports Revenue (USD Million) by Product (2021-2032)
By Type
Knee Braces & Supports
Foot and Ankle Braces & Supports
Spinal Orthoses
Upper Extremity Braces & Supports
By Channel
Direct Sales
Distributor
Chapter 11. Asia Pacific Bracing and Supports Analysis and Outlook
11.1. Asia Pacific Bracing and Supports Revenue (USD Million), and Revenue (USD Million) by Segments (2021-2032)
11.1.1. Asia Pacific Bracing and Supports Revenue (USD Million) by Type (2021-2032)
11.1.2. Asia Pacific Bracing and Supports Revenue (USD Million) by Application (2021-2032)
11.1.3. Asia Pacific Bracing and Supports Revenue (USD Million) by Product (2021-2032)
By Type
Knee Braces & Supports
Foot and Ankle Braces & Supports
Spinal Orthoses
Upper Extremity Braces & Supports
By Channel
Direct Sales
Distributor
Chapter 12. South America Bracing and Supports Analysis and Outlook
12.1. South America Bracing and Supports Revenue (USD Million), by Segments (2021-2032)
12.1.1. South America Bracing and Supports Revenue (USD Million) by Type (2021-2032)
12.1.2. South America Bracing and Supports Revenue (USD Million) by Application (2021-2032)
12.1.3. South America Bracing and Supports Revenue (USD Million) by Product (2021-2032)
By Type
Knee Braces & Supports
Foot and Ankle Braces & Supports
Spinal Orthoses
Upper Extremity Braces & Supports
By Channel
Direct Sales
Distributor
Chapter 13. Middle East and Africa Bracing and Supports Analysis and Outlook
13.1. Middle East and Africa Bracing and Supports Revenue (USD Million), by Segments (2021-2032)
13.1.1. Middle East and Africa Bracing and Supports Revenue (USD Million) by Type (2021-2032)
13.1.2. Middle East and Africa Bracing and Supports Revenue (USD Million) by Application (2021-2032)
13.1.3. Middle East and Africa Bracing and Supports Revenue (USD Million) by Product (2021-2032)
By Type
Knee Braces & Supports
Foot and Ankle Braces & Supports
Spinal Orthoses
Upper Extremity Braces & Supports
By Channel
Direct Sales
Distributor
Chapter 14. Bracing and Supports Company Profiles
14.1 Business Overview
14.2 Product Profiles
14.3 SWOT Profiles
14.5 Recent Developments
14.6 Financial Profile
List of Companies
Bauerfeind
Biomet
Breg
Cramer Products
DeRoyal
Orthomerica
Ossur (Iceland)
Swede-O
Xback Bracing
15. Methodology and Data Sources
15.1 Customization Offerings
15.2 Subscription Services
15.3 Related Reports
15.4 Publisher Expertise
LIST OF TABLES
Table 1 Market Segmentation Analysis
Table 2 Global Bracing and Supports Market Share of Leading Companies, 2023
Table 3 Product Offerings of Leading Companies
Table 4 Low Growth Scenario Forecasts
Table 5 Reference Case Growth Scenario
Table 6 High Growth Case Scenario
Table 7 Global Bracing and Supports Revenue (USD Million) And CAGR (%) By Type (2021-2032)
Table 8 Global Bracing and Supports Revenue (USD Million) And CAGR (%) By Application (2021-2032)
Table 9 Global Bracing and Supports Revenue (USD Million) And CAGR (%) By Product (2021-2032)
Table 10 Global Bracing and Supports Market Revenue (USD Million) By Regions (2021-2032)
Table 11 Global Bracing and Supports Market Share (%) By Regions (2021-2032)
Table 12 North America Bracing and Supports Revenue (USD Million) By Country (2021-2032)
Table 13 Europe Bracing and Supports Revenue (USD Million) By Country (2021-2032)
Table 14 Asia Pacific Bracing and Supports Revenue (USD Million) By Country (2021-2032)
Table 15 South America Bracing and Supports Revenue (USD Million) By Country (2021-2032)
Table 16 Middle East and Africa Bracing and Supports Revenue (USD Million) By Region (2021-2032)
Table 17 North America Bracing and Supports Revenue (USD Million) By Type (2021-2032)
Table 18 North America Bracing and Supports Revenue (USD Million) By Application (2021-2032)
Table 19 North America Bracing and Supports Revenue (USD Million) By Product (2021-2032)
Table 20 Europe Bracing and Supports Revenue (USD Million) By Type (2021-2032)
Table 21 Europe Bracing and Supports Revenue (USD Million) By Application (2021-2032)
Table 22 Europe Bracing and Supports Revenue (USD Million) By Product (2021-2032)
Table 23 Asia Pacific Bracing and Supports Revenue (USD Million) By Type (2021-2032)
Table 24 Asia Pacific Bracing and Supports Revenue (USD Million) By Application (2021-2032)
Table 25 Asia Pacific Bracing and Supports Revenue (USD Million) By Product (2021-2032)
Table 26 South America Bracing and Supports Revenue (USD Million) By Type (2021-2032)
Table 27 South America Bracing and Supports Revenue (USD Million) By Application (2021-2032)
Table 28 South America Bracing and Supports Revenue (USD Million) By Product (2021-2032)
Table 29 Middle East and Africa Bracing and Supports Revenue (USD Million) By Type (2021-2032)
Table 30 Middle East and Africa Bracing and Supports Revenue (USD Million) By Application (2021-2032)
Table 31 Middle East and Africa Bracing and Supports Revenue (USD Million) By Product (2021-2032)
LIST OF FIGURES
Figure 1. Market Scope
Figure 2. Pricing Forecasts Per Unit, 2023- 2032
Figure 3. Porter’s Five Forces
Figure 4. Global Bracing and Supports Market Revenue (USD Million) By Regions (2021-2032)
Figure 5. Global Bracing and Supports Market Share (%) By Regions (2023)
Figure 6. North America Bracing and Supports Revenue (USD Million) By Country (2021-2032)
Figure 7. United States Bracing and Supports Revenue (USD Million) By Country (2021-2032)
Figure 8. Canada Bracing and Supports Revenue (USD Million) By Country (2021-2032)
Figure 9. Mexico Bracing and Supports Revenue (USD Million) By Country (2021-2032)
Figure 10. Europe Bracing and Supports Revenue (USD Million) By Country (2021-2032)
Figure 11. Germany Bracing and Supports Revenue (USD Million) By Country (2021-2032)
Figure 12. France Bracing and Supports Revenue (USD Million) By Country (2021-2032)
Figure 13. United Kingdom Bracing and Supports Revenue (USD Million) By Country (2021-2032)
Figure 14. Spain Bracing and Supports Revenue (USD Million) By Country (2021-2032)
Figure 15. Italy Bracing and Supports Revenue (USD Million) By Country (2021-2032)
Figure 16. Russia Bracing and Supports Revenue (USD Million) By Country (2021-2032)
Figure 17. Rest of Europe Bracing and Supports Revenue (USD Million) By Country (2021-2032)
Figure 11. Asia Pacific Bracing and Supports Revenue (USD Million) By Country (2021-2032)
Figure 12. China Bracing and Supports Revenue (USD Million) By Country (2021-2032)
Figure 13. Japan Bracing and Supports Revenue (USD Million) By Country (2021-2032)
Figure 14. India Bracing and Supports Revenue (USD Million) By Country (2021-2032)
Figure 15. South Korea Bracing and Supports Revenue (USD Million) By Country (2021-2032)
Figure 16. Australia Bracing and Supports Revenue (USD Million) By Country (2021-2032)
Figure 17. South East Asia Bracing and Supports Revenue (USD Million) By Country (2021-2032)
Figure 18. South America Bracing and Supports Revenue (USD Million) By Country (2021-2032)
Figure 19. Brazil Bracing and Supports Revenue (USD Million) By Country (2021-2032)
Figure 20. Argentina Bracing and Supports Revenue (USD Million) By Country (2021-2032)
Figure 21. Rest of Asia Pacific Bracing and Supports Revenue (USD Million) By Country (2021-2032)
Figure 22. Middle East and Africa Bracing and Supports Revenue (USD Million) By Region (2021-2032)
Figure 23. Saudi Arabia Bracing and Supports Revenue (USD Million) By Region (2021-2032)
Figure 24. The UAE Bracing and Supports Revenue (USD Million) By Region (2021-2032)
Figure 25. Rest of Middle East Bracing and Supports Revenue (USD Million) By Region (2021-2032)
Figure 26. South Africa Bracing and Supports Revenue (USD Million) By Region (2021-2032)
Figure 27. Africa Bracing and Supports Revenue (USD Million) By Region (2021-2032)
Figure 28. North America Bracing and Supports Revenue (USD Million) By Type (2021-2032)
Figure 29. North America Bracing and Supports Revenue (USD Million) By Application (2021-2032)
Figure 30. North America Bracing and Supports Revenue (USD Million) By Product (2021-2032)
Figure 31. Europe Bracing and Supports Revenue (USD Million) By Type (2021-2032)
Figure 32. Europe Bracing and Supports Revenue (USD Million) By Application (2021-2032)
Figure 33. Europe Bracing and Supports Revenue (USD Million) By Product (2021-2032)
Figure 34. Asia Pacific Bracing and Supports Revenue (USD Million) By Type (2021-2032)
Figure 35. Asia Pacific Bracing and Supports Revenue (USD Million) By Application (2021-2032)
Figure 36. Asia Pacific Bracing and Supports Revenue (USD Million) By Product (2021-2032)
Figure 37. South America Bracing and Supports Revenue (USD Million) By Type (2021-2032)
Figure 38. South America Bracing and Supports Revenue (USD Million) By Application (2021-2032)
Figure 39. South America Bracing and Supports Revenue (USD Million) By Product (2021-2032)
Figure 40. Middle East and Africa Bracing and Supports Revenue (USD Million) By Type (2021-2032)
Figure 41. Middle East and Africa Bracing and Supports Revenue (USD Million) By Application (2021-2032)
Figure 42. Middle East and Africa Bracing and Supports Revenue (USD Million) By Product (2021-2032)
By Type
Knee Braces & Supports
Foot and Ankle Braces & Supports
Spinal Orthoses
Upper Extremity Braces & Supports
By Channel
Direct Sales
Distributor
Countries Analyzed
North America (US, Canada, Mexico)
Europe (Germany, UK, France, Spain, Italy, Russia, Rest of Europe)
Asia Pacific (China, India, Japan, South Korea, Australia, South East Asia, Rest of Asia)
South America (Brazil, Argentina, Rest of South America)
Middle East and Africa (Saudi Arabia, UAE, Rest of Middle East, South Africa, Egypt, Rest of Africa)
