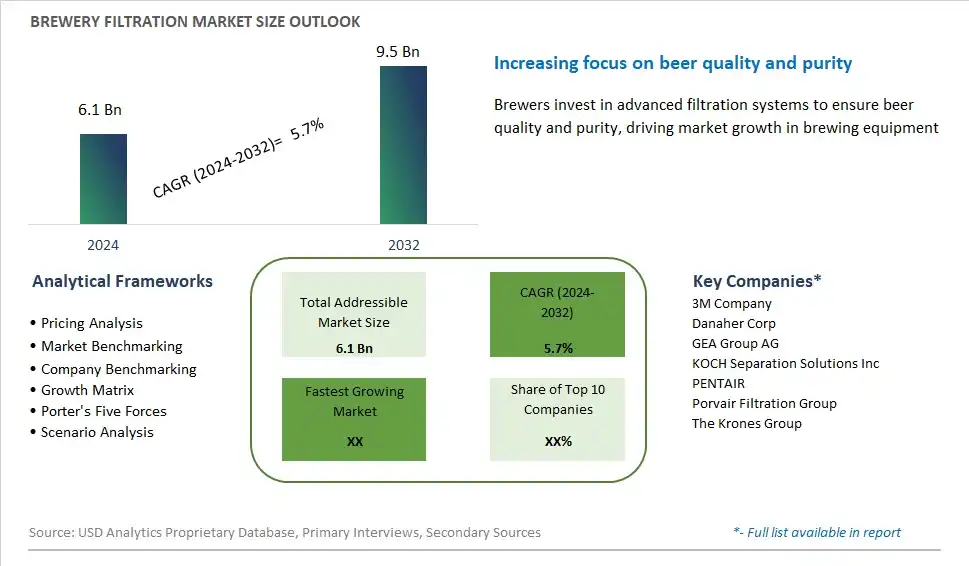
Global Brewery Filtration Market Size is valued at $6.1 Billion in 2024 and is forecast to register a growth rate (CAGR) of 5.7% to reach $9.5 Billion by 2032.
The global Brewery Filtration Market Comprehensive Study analyzes and forecasts the market size across 6 regions and 24 countries for diverse segments -By Type (First Fit, Aftermarket), By Customer Type (Breweries Under 100,000hl, Breweries Above 100,000hl), By Filtration Type (Microfiltration, Ultra-Filtration, Nano Filtration, Reverse Osmosis, Others)
An Introduction to Brewery Filtration Market
Brewery filtration is the process of removing undesirable particles, microorganisms, and impurities from beer to improve clarity, stability, and flavor in 2024. Filtration is a critical step in the beer production process, ensuring that the final product meets quality standards and consumer expectations for appearance, taste, and shelf life. Common filtration methods used in breweries include mechanical filtration, such as depth filtration and membrane filtration, as well as fining agents and centrifugation techniques. Filtration can target specific components such as yeast cells, protein haze, and hop residues, depending on the desired beer style and clarity requirements. With the growing demand for craft beer, quality assurance, and product consistency, the market for brewery filtration is expanding, driven by investments in filtration equipment, process optimization, and quality control measures that enable brewers to achieve desired beer characteristics and meet regulatory standards.
Brewery Filtration Competitive Landscape
The market report analyses the leading companies in the industry including 3M Company, Danaher Corp, GEA Group AG, KOCH Separation Solutions Inc, PENTAIR, Porvair Filtration Group, The Krones Group, and Others.
Brewery Filtration Market Dynamics
Brewery Filtration Market Trend: Growing Demand for Quality and Consistency in Beer Production
The market for brewery filtration is experiencing a prominent trend driven by the growing demand for quality and consistency in beer production. Consumers have increasingly high expectations for the taste, clarity, and stability of their beer, prompting breweries to invest in advanced filtration systems to achieve desired quality standards. This trend is fueled by the rising popularity of craft beer and the competitive nature of the beer industry, where breweries strive to differentiate themselves based on the excellence of their products. As a result, there is a growing demand for brewery filtration equipment and technologies that can efficiently remove impurities, haze, and off-flavors from beer, ensuring a consistent and premium drinking experience for consumers.
Market Driver: Regulatory Compliance and Quality Assurance Standards
A significant driver of the brewery filtration market is the need for regulatory compliance and quality assurance standards in beer production. Breweries are subject to stringent regulations and industry standards governing food safety, product quality, and consistency, necessitating the implementation of effective filtration processes to meet compliance requirements. Additionally, breweries must adhere to consumer expectations for beer clarity, flavor stability, and shelf-life, driving the adoption of filtration technologies to ensure product integrity and consistency. The increasing emphasis on quality assurance and regulatory compliance is driving breweries to invest in state-of-the-art filtration equipment and systems that can meet or exceed industry standards while optimizing production efficiency and minimizing operational risks.
Market Opportunity: Expansion into Sustainable Filtration Solutions
An opportunity for the brewery filtration market lies in expansion into sustainable filtration solutions. With growing concerns about environmental sustainability and resource conservation, breweries are seeking filtration technologies that not only deliver high-quality results but also minimize water usage, energy consumption, and waste generation. There is a growing demand for eco-friendly filtration systems that incorporate innovative technologies such as membrane filtration, cross-flow filtration, and biofiltration to achieve efficient separation and purification with minimal environmental impact. Moreover, breweries are exploring opportunities to implement water reuse and recycling initiatives, where advanced filtration plays a key role in treating and purifying wastewater for reuse in brewing processes. By offering sustainable filtration solutions, filtration equipment manufacturers can address the sustainability priorities of breweries and position themselves as partners in the industry's efforts to reduce its environmental footprint while maintaining product quality and integrity.
Brewery Filtration Market Share Analysis: Aftermarket held the dominant market share in 2024
The aftermarket segment commands the largest share in the brewery filtration market due to the continuous demand for maintenance, replacement, and upgrade services for existing filtration equipment in breweries. Aftermarket filtration solutions encompass a wide range of products and services, including filter cartridges, membranes, filter aids, spare parts, and technical support, tailored to meet the specific needs of brewery operations. Breweries rely on aftermarket filtration solutions to ensure the consistent quality and efficiency of their production processes, prolong the lifespan of filtration equipment, and adapt to changing brewing requirements. Additionally, the aftermarket segment offers opportunities for suppliers and service providers to offer customized solutions, value-added services, and ongoing support to brewery customers, fostering long-term relationships and customer loyalty. As a result, the aftermarket segment remains the largest in the brewery filtration market, reflecting the importance of ongoing maintenance and support services in the brewing industry.
Brewery Filtration Market Share Analysis: Breweries Under 100,000hl market is poised to register the fastest growth rae over the forecast period to 2032
The segment comprising breweries under 100,000 hectoliters (hl) is experiencing the fastest growth in the brewery filtration market due to the increasing trend of microbreweries, craft breweries, and boutique beer producers entering the market. Breweries operating on a smaller scale are investing in filtration equipment to improve the quality and consistency of their beer products, enhance shelf life, and meet the evolving tastes and preferences of consumers. Additionally, the growing popularity of artisanal and specialty beers drives the demand for filtration solutions that can accommodate a wide range of beer styles, flavors, and ingredients. Further, advancements in filtration technology, coupled with the availability of compact and cost-effective filtration systems tailored for small-scale breweries, make it easier for them to invest in filtration equipment and integrate it into their production processes. As a result, the segment of breweries under 100,000hl is the fastest-growing in the brewery filtration market, reflecting the dynamic landscape and opportunities for innovation in the craft brewing industry.
Brewery Filtration Market Share Analysis: Microfiltration held the dominant market share in 2024
The microfiltration segment commands the largest share in the brewery filtration market owing to its widespread adoption and effectiveness in beer production processes. Microfiltration plays a pivotal role in breweries by removing suspended solids, yeast cells, bacteria, and other impurities from the beer, ensuring clarity, stability, and microbial stability. This filtration method is crucial for achieving the desired flavor profile, aroma, and visual appearance of the final product. Additionally, microfiltration allows breweries to produce a wide range of beer styles while maintaining consistent quality and taste. Its versatility, reliability, and efficiency make it the preferred choice for breweries of all sizes, from small craft breweries to large-scale commercial operations. Further, advancements in microfiltration technology, coupled with the availability of high-performance filtration membranes and systems, further contribute to its dominance in the brewery filtration market. As a result, the microfiltration segment retains its position as the largest in the market, meeting the stringent quality standards and production requirements of breweries worldwide.
Brewery Filtration Market Segmentation
By Type
First Fit
Aftermarket
By Customer Type
Breweries Under 100,000hl
Breweries Above 100,000hl
By Filtration Type
Microfiltration
Ultra-Filtration
Nano Filtration
Reverse Osmosis
Others
Countries Analyzed
North America (US, Canada, Mexico)
Europe (Germany, UK, France, Spain, Italy, Russia, Rest of Europe)
Asia Pacific (China, India, Japan, South Korea, Australia, South East Asia, Rest of Asia)
South America (Brazil, Argentina, Rest of South America)
Middle East and Africa (Saudi Arabia, UAE, Rest of Middle East, South Africa, Egypt, Rest of Africa)
Brewery Filtration Companies Profiled in the Study
3M Company
Danaher Corp
GEA Group AG
KOCH Separation Solutions Inc
PENTAIR
Porvair Filtration Group
The Krones Group
*- List Not Exhaustive
Chapter 1. TABLE OF CONTENTS
Chapter 2. Introduction to Brewery Filtration Market
2.1. Market Overview
2.2. Key Statistics and Report Highlights
2.3. Scope of the Comprehensive Study
2.3.1. Market Definition
2.3.2 Countries and Regions Covered
2.3.3 Research Objective
2.3.4 Units, Currency, and Conversions
2.3.5 Industry Value Chain
2.4. Key Market Segments
2.5. Key Companies
2.6. Study Period
Chapter 3. Strategic Analysis Review
3.1. Brewery Filtration Pricing Analysis and Forecast
3.2. Porter’s Five Forces
3.3. Market Ecosystem
3.4. SWOT Analysis
3.5. Regulatory Scenario
3.3. Effects of Inflation, Russia-Ukraine War, moderating economic growth, and other macroeconomic factors
Chapter 4. Competitive Landscape
4.1. Market Share Analysis
4.1.1. Global Brewery Filtration Market Share by Company, 2023
4.1.2. Product Offerings of Leading Brewery Filtration Companies
4.2. Market Entropy
4.2.1. New Product Launches in the Industry
4.2.2. Mergers, Acquisitions, Joint ventures, and Partnerships
4.3. Key Strategies and Best Practices
Chapter 5. Global Market Projections: Best, Reference, and Low Case Scenarios
5.1. Growth Analysis- Case Scenario Definitions
5.2. Low Growth Case Scenario Forecasts
5.3. Reference Growth Case Scenario Forecasts
5.4. High Growth Case Scenario Forecasts
Chapter 6. Market Dynamics
6.1. Brewery Filtration Market Drivers
6.2. Brewery Filtration Market Challenges
6.6. Brewery Filtration Market Opportunities
6.4. Brewery Filtration Market Trends
Chapter 7. Global Brewery Filtration Market Outlook Trends
7.1. Global Brewery Filtration Revenue (USD Million) and CAGR (%) by Type (2021-2032)
7.2. Global Brewery Filtration Revenue (USD Million) and CAGR (%) by Application (2021-2032)
7.3. Global Brewery Filtration Revenue (USD Million) and CAGR (%) by Product (2021-2032)
By Type
First Fit
Aftermarket
By Customer Type
Breweries Under 100,000hl
Breweries Above 100,000hl
By Filtration Type
Microfiltration
Ultra-Filtration
Nano Filtration
Reverse Osmosis
Others
Chapter 8. Global Brewery Filtration Regional Analysis and Outlook
8.1. Global Brewery Filtration Revenue (USD Million) By Regions (2021- 2032)
8.2. North America Brewery Filtration Revenue (USD Million) by Country (2021-2032)
8.2.1. United States Brewery Filtration Regional Analysis and Outlook
8.2.2. Canada Brewery Filtration Regional Analysis and Outlook
8.2.3. Mexico Brewery Filtration Regional Analysis and Outlook
8.3. Europe Brewery Filtration Revenue (USD Million), by Country (2021-2032)
8.3.1. Germany Brewery Filtration Regional Analysis and Outlook
8.3.2. France Brewery Filtration Regional Analysis and Outlook
8.3.3. United Kingdom Brewery Filtration Regional Analysis and Outlook
8.3.4. Spain Brewery Filtration Regional Analysis and Outlook
8.3.5. Italy Brewery Filtration Regional Analysis and Outlook
8.3.6. Russia Brewery Filtration Regional Analysis and Outlook
8.3.7. Rest of Europe Brewery Filtration Regional Analysis and Outlook
8.4. Asia Pacific Brewery Filtration Revenue (USD Million) by Country (2021-2032)
8.4.1. China Brewery Filtration Regional Analysis and Outlook
8.4.2. Japan Brewery Filtration Regional Analysis and Outlook
8.4.3. India Brewery Filtration Regional Analysis and Outlook
8.4.4. South Korea Brewery Filtration Regional Analysis and Outlook
8.4.5. Australia Brewery Filtration Regional Analysis and Outlook
8.4.6. South East Asia Brewery Filtration Regional Analysis and Outlook
8.4.7. Rest of Asia Pacific Brewery Filtration Regional Analysis and Outlook
8.5. South America Brewery Filtration Revenue (USD Million), by Country (2021-2032)
8.5.1. Brazil Brewery Filtration Regional Analysis and Outlook
8.5.2. Argentina Brewery Filtration Regional Analysis and Outlook
8.5.3. Rest of South America Brewery Filtration Regional Analysis and Outlook
8.6. Middle East and Africa Brewery Filtration Revenue (USD Million) by Country (2021-2032)
8.6.1. Middle East Brewery Filtration Regional Analysis and Outlook
8.6.2. Africa Brewery Filtration Regional Analysis and Outlook
Chapter 9. North America Brewery Filtration Analysis and Outlook
9.1. North America Brewery Filtration Revenue (USD Million) by Segments (2021-2032)
9.1.1. North America Brewery Filtration Revenue (USD Million) by Type (2021-2032)
9.1.2. North America Brewery Filtration Revenue (USD Million) by Application (2021-2032)
9.1.3. North America Brewery Filtration Revenue (USD Million) by Product (2021-2032)
By Type
First Fit
Aftermarket
By Customer Type
Breweries Under 100,000hl
Breweries Above 100,000hl
By Filtration Type
Microfiltration
Ultra-Filtration
Nano Filtration
Reverse Osmosis
Others
Chapter 10. Europe Brewery Filtration Analysis and Outlook
10.1. Europe Brewery Filtration Revenue (USD Million), by Segments (USD Million) (2021-2032)
10.1.1. Europe Brewery Filtration Revenue (USD Million) by Type (2021-2032)
10.1.2. Europe Brewery Filtration Revenue (USD Million) by Application (2021-2032)
10.1.3. Europe Brewery Filtration Revenue (USD Million) by Product (2021-2032)
By Type
First Fit
Aftermarket
By Customer Type
Breweries Under 100,000hl
Breweries Above 100,000hl
By Filtration Type
Microfiltration
Ultra-Filtration
Nano Filtration
Reverse Osmosis
Others
Chapter 11. Asia Pacific Brewery Filtration Analysis and Outlook
11.1. Asia Pacific Brewery Filtration Revenue (USD Million), and Revenue (USD Million) by Segments (2021-2032)
11.1.1. Asia Pacific Brewery Filtration Revenue (USD Million) by Type (2021-2032)
11.1.2. Asia Pacific Brewery Filtration Revenue (USD Million) by Application (2021-2032)
11.1.3. Asia Pacific Brewery Filtration Revenue (USD Million) by Product (2021-2032)
By Type
First Fit
Aftermarket
By Customer Type
Breweries Under 100,000hl
Breweries Above 100,000hl
By Filtration Type
Microfiltration
Ultra-Filtration
Nano Filtration
Reverse Osmosis
Others
Chapter 12. South America Brewery Filtration Analysis and Outlook
12.1. South America Brewery Filtration Revenue (USD Million), by Segments (2021-2032)
12.1.1. South America Brewery Filtration Revenue (USD Million) by Type (2021-2032)
12.1.2. South America Brewery Filtration Revenue (USD Million) by Application (2021-2032)
12.1.3. South America Brewery Filtration Revenue (USD Million) by Product (2021-2032)
By Type
First Fit
Aftermarket
By Customer Type
Breweries Under 100,000hl
Breweries Above 100,000hl
By Filtration Type
Microfiltration
Ultra-Filtration
Nano Filtration
Reverse Osmosis
Others
Chapter 13. Middle East and Africa Brewery Filtration Analysis and Outlook
13.1. Middle East and Africa Brewery Filtration Revenue (USD Million), by Segments (2021-2032)
13.1.1. Middle East and Africa Brewery Filtration Revenue (USD Million) by Type (2021-2032)
13.1.2. Middle East and Africa Brewery Filtration Revenue (USD Million) by Application (2021-2032)
13.1.3. Middle East and Africa Brewery Filtration Revenue (USD Million) by Product (2021-2032)
By Type
First Fit
Aftermarket
By Customer Type
Breweries Under 100,000hl
Breweries Above 100,000hl
By Filtration Type
Microfiltration
Ultra-Filtration
Nano Filtration
Reverse Osmosis
Others
Chapter 14. Brewery Filtration Company Profiles
14.1 Business Overview
14.2 Product Profiles
14.3 SWOT Profiles
14.5 Recent Developments
14.6 Financial Profile
List of Companies
3M Company
Danaher Corp
GEA Group AG
KOCH Separation Solutions Inc
PENTAIR
Porvair Filtration Group
The Krones Group
15. Methodology and Data Sources
15.1 Customization Offerings
15.2 Subscription Services
15.3 Related Reports
15.4 Publisher Expertise
LIST OF TABLES
Table 1 Market Segmentation Analysis
Table 2 Global Brewery Filtration Market Share of Leading Companies, 2023
Table 3 Product Offerings of Leading Companies
Table 4 Low Growth Scenario Forecasts
Table 5 Reference Case Growth Scenario
Table 6 High Growth Case Scenario
Table 7 Global Brewery Filtration Revenue (USD Million) And CAGR (%) By Type (2021-2032)
Table 8 Global Brewery Filtration Revenue (USD Million) And CAGR (%) By Application (2021-2032)
Table 9 Global Brewery Filtration Revenue (USD Million) And CAGR (%) By Product (2021-2032)
Table 10 Global Brewery Filtration Market Revenue (USD Million) By Regions (2021-2032)
Table 11 Global Brewery Filtration Market Share (%) By Regions (2021-2032)
Table 12 North America Brewery Filtration Revenue (USD Million) By Country (2021-2032)
Table 13 Europe Brewery Filtration Revenue (USD Million) By Country (2021-2032)
Table 14 Asia Pacific Brewery Filtration Revenue (USD Million) By Country (2021-2032)
Table 15 South America Brewery Filtration Revenue (USD Million) By Country (2021-2032)
Table 16 Middle East and Africa Brewery Filtration Revenue (USD Million) By Region (2021-2032)
Table 17 North America Brewery Filtration Revenue (USD Million) By Type (2021-2032)
Table 18 North America Brewery Filtration Revenue (USD Million) By Application (2021-2032)
Table 19 North America Brewery Filtration Revenue (USD Million) By Product (2021-2032)
Table 20 Europe Brewery Filtration Revenue (USD Million) By Type (2021-2032)
Table 21 Europe Brewery Filtration Revenue (USD Million) By Application (2021-2032)
Table 22 Europe Brewery Filtration Revenue (USD Million) By Product (2021-2032)
Table 23 Asia Pacific Brewery Filtration Revenue (USD Million) By Type (2021-2032)
Table 24 Asia Pacific Brewery Filtration Revenue (USD Million) By Application (2021-2032)
Table 25 Asia Pacific Brewery Filtration Revenue (USD Million) By Product (2021-2032)
Table 26 South America Brewery Filtration Revenue (USD Million) By Type (2021-2032)
Table 27 South America Brewery Filtration Revenue (USD Million) By Application (2021-2032)
Table 28 South America Brewery Filtration Revenue (USD Million) By Product (2021-2032)
Table 29 Middle East and Africa Brewery Filtration Revenue (USD Million) By Type (2021-2032)
Table 30 Middle East and Africa Brewery Filtration Revenue (USD Million) By Application (2021-2032)
Table 31 Middle East and Africa Brewery Filtration Revenue (USD Million) By Product (2021-2032)
LIST OF FIGURES
Figure 1. Market Scope
Figure 2. Pricing Forecasts Per Unit, 2023- 2032
Figure 3. Porter’s Five Forces
Figure 4. Global Brewery Filtration Market Revenue (USD Million) By Regions (2021-2032)
Figure 5. Global Brewery Filtration Market Share (%) By Regions (2023)
Figure 6. North America Brewery Filtration Revenue (USD Million) By Country (2021-2032)
Figure 7. United States Brewery Filtration Revenue (USD Million) By Country (2021-2032)
Figure 8. Canada Brewery Filtration Revenue (USD Million) By Country (2021-2032)
Figure 9. Mexico Brewery Filtration Revenue (USD Million) By Country (2021-2032)
Figure 10. Europe Brewery Filtration Revenue (USD Million) By Country (2021-2032)
Figure 11. Germany Brewery Filtration Revenue (USD Million) By Country (2021-2032)
Figure 12. France Brewery Filtration Revenue (USD Million) By Country (2021-2032)
Figure 13. United Kingdom Brewery Filtration Revenue (USD Million) By Country (2021-2032)
Figure 14. Spain Brewery Filtration Revenue (USD Million) By Country (2021-2032)
Figure 15. Italy Brewery Filtration Revenue (USD Million) By Country (2021-2032)
Figure 16. Russia Brewery Filtration Revenue (USD Million) By Country (2021-2032)
Figure 17. Rest of Europe Brewery Filtration Revenue (USD Million) By Country (2021-2032)
Figure 11. Asia Pacific Brewery Filtration Revenue (USD Million) By Country (2021-2032)
Figure 12. China Brewery Filtration Revenue (USD Million) By Country (2021-2032)
Figure 13. Japan Brewery Filtration Revenue (USD Million) By Country (2021-2032)
Figure 14. India Brewery Filtration Revenue (USD Million) By Country (2021-2032)
Figure 15. South Korea Brewery Filtration Revenue (USD Million) By Country (2021-2032)
Figure 16. Australia Brewery Filtration Revenue (USD Million) By Country (2021-2032)
Figure 17. South East Asia Brewery Filtration Revenue (USD Million) By Country (2021-2032)
Figure 18. South America Brewery Filtration Revenue (USD Million) By Country (2021-2032)
Figure 19. Brazil Brewery Filtration Revenue (USD Million) By Country (2021-2032)
Figure 20. Argentina Brewery Filtration Revenue (USD Million) By Country (2021-2032)
Figure 21. Rest of Asia Pacific Brewery Filtration Revenue (USD Million) By Country (2021-2032)
Figure 22. Middle East and Africa Brewery Filtration Revenue (USD Million) By Region (2021-2032)
Figure 23. Saudi Arabia Brewery Filtration Revenue (USD Million) By Region (2021-2032)
Figure 24. The UAE Brewery Filtration Revenue (USD Million) By Region (2021-2032)
Figure 25. Rest of Middle East Brewery Filtration Revenue (USD Million) By Region (2021-2032)
Figure 26. South Africa Brewery Filtration Revenue (USD Million) By Region (2021-2032)
Figure 27. Africa Brewery Filtration Revenue (USD Million) By Region (2021-2032)
Figure 28. North America Brewery Filtration Revenue (USD Million) By Type (2021-2032)
Figure 29. North America Brewery Filtration Revenue (USD Million) By Application (2021-2032)
Figure 30. North America Brewery Filtration Revenue (USD Million) By Product (2021-2032)
Figure 31. Europe Brewery Filtration Revenue (USD Million) By Type (2021-2032)
Figure 32. Europe Brewery Filtration Revenue (USD Million) By Application (2021-2032)
Figure 33. Europe Brewery Filtration Revenue (USD Million) By Product (2021-2032)
Figure 34. Asia Pacific Brewery Filtration Revenue (USD Million) By Type (2021-2032)
Figure 35. Asia Pacific Brewery Filtration Revenue (USD Million) By Application (2021-2032)
Figure 36. Asia Pacific Brewery Filtration Revenue (USD Million) By Product (2021-2032)
Figure 37. South America Brewery Filtration Revenue (USD Million) By Type (2021-2032)
Figure 38. South America Brewery Filtration Revenue (USD Million) By Application (2021-2032)
Figure 39. South America Brewery Filtration Revenue (USD Million) By Product (2021-2032)
Figure 40. Middle East and Africa Brewery Filtration Revenue (USD Million) By Type (2021-2032)
Figure 41. Middle East and Africa Brewery Filtration Revenue (USD Million) By Application (2021-2032)
Figure 42. Middle East and Africa Brewery Filtration Revenue (USD Million) By Product (2021-2032)
By Type
First Fit
Aftermarket
By Customer Type
Breweries Under 100,000hl
Breweries Above 100,000hl
By Filtration Type
Microfiltration
Ultra-Filtration
Nano Filtration
Reverse Osmosis
Others
Countries Analyzed
North America (US, Canada, Mexico)
Europe (Germany, UK, France, Spain, Italy, Russia, Rest of Europe)
Asia Pacific (China, India, Japan, South Korea, Australia, South East Asia, Rest of Asia)
South America (Brazil, Argentina, Rest of South America)
Middle East and Africa (Saudi Arabia, UAE, Rest of Middle East, South Africa, Egypt, Rest of Africa)
