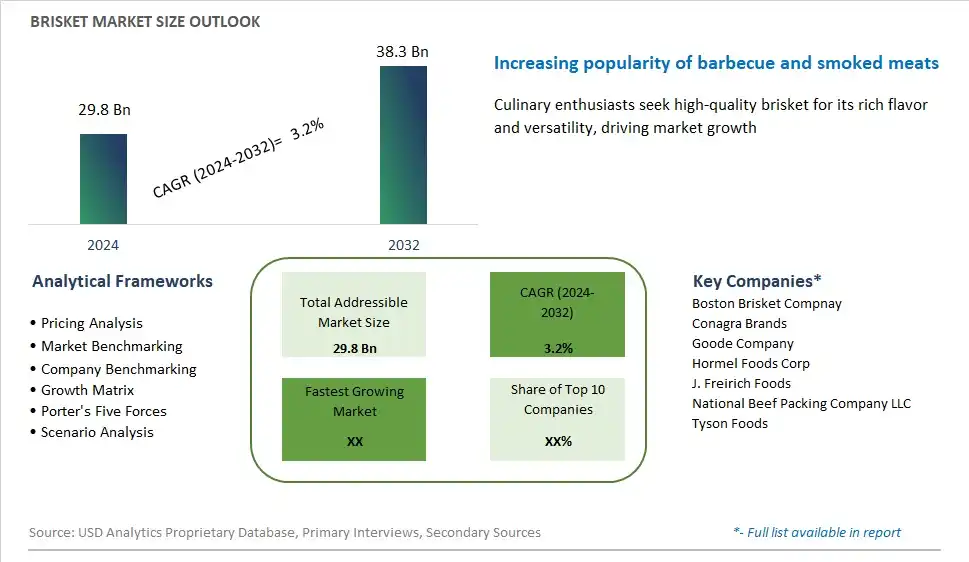
Global Brisket Market Size is valued at $29.8 Billion in 2024 and is forecast to register a growth rate (CAGR) of 3.2% to reach $38.3 Billion by 2032.
The global Brisket Market Comprehensive Study analyzes and forecasts the market size across 6 regions and 24 countries for diverse segments -By Type (Point Cut, Flat Cut), By Product (Conventional brisket, Organic brisket)
An Introduction to Brisket Market
Brisket, a flavorful and versatile cut of beef known for its rich marbling and tender texture, remains a beloved favorite in the culinary landscape of 2024. Whether slow-smoked to perfection, braised until meltingly tender, or grilled for a charred crust, brisket offers endless possibilities for delicious and satisfying meals. From traditional barbecue joints to upscale steakhouses and global fusion restaurants, brisket takes center stage on menus, appealing to meat lovers and food enthusiasts alike. With an emphasis on quality sourcing and artisanal preparation methods, brisket continues to inspire culinary creativity and gastronomic delight, solidifying its status as a timeless classic in the world of meat-centric cuisine.
Brisket Competitive Landscape
The market report analyses the leading companies in the industry including Boston Brisket Compnay, Conagra Brands, Goode Company, Hormel Foods Corp, J. Freirich Foods, National Beef Packing Company LLC, Tyson Foods, and Others.
Brisket Market Dynamics
Brisket Market Trend: Surge in Demand for Barbecue and Smoked Meat
The market trend for Brisket reflects a surge in demand for barbecue and smoked meat products. Brisket, known for its rich flavor and tender texture when cooked low and slow, has become a staple in barbecue culture and culinary traditions worldwide. This trend is driven by the growing popularity of outdoor cooking, backyard grilling, and barbecue competitions, where brisket is often featured as a star attraction. Additionally, the rise of food tourism and the proliferation of barbecue restaurants and food trucks have contributed to the increasing demand for brisket as a favorite menu item among meat enthusiasts.
Market Driver: Rise of Foodservice and Restaurant Industry
A significant driver of the Brisket market is the rise of the foodservice and restaurant industry. As consumers increasingly dine out or order food for takeout and delivery, there's a growing demand for menu options that offer indulgent and flavorful experiences. Brisket's versatility and ability to be incorporated into a wide range of dishes, from sandwiches and tacos to hearty platters and gourmet entrees, make it a popular choice for restaurants seeking to attract meat-loving patrons. The driver is fueled by consumer preferences for restaurant-quality meals, convenience, and social dining experiences, driving the demand for brisket as a menu staple in various foodservice establishments.
Market Opportunity: Expansion into Retail and Home Cooking Markets
An opportunity in the Brisket market lies in the expansion into retail and home cooking markets. While brisket has long been associated with restaurant dining and barbecue events, there's potential to tap into the retail sector and home cooking market. Retailers can capitalize on consumer interest in cooking at home by offering pre-packaged brisket cuts, marinated brisket kits, or ready-to-cook brisket meals that allow consumers to recreate restaurant-quality dishes in their own kitchens. Additionally, providing educational resources, recipe ideas, and cooking tips can empower consumers to experiment with brisket cooking techniques and flavor profiles, expanding the market beyond traditional barbecue enthusiasts to a broader audience of home cooks.
Brisket Market Share Analysis: Flat Cut held the dominant market share in 2024
In the diverse landscape of the brisket market, the Flat Cut is the largest segment, commanding prominence due to its versatility, tenderness, and widespread culinary appeal. The Flat Cut, also known as the "first cut," boasts a uniform thickness and a generous marbling of fat, making it ideal for smoking, braising, or slow-cooking to perfection. Its relatively even thickness ensures consistent cooking results and tender, succulent meat, making it a favorite among barbecue enthusiasts and chefs alike. Further, the Flat Cut's popularity extends beyond traditional barbecue dishes, as it serves as a versatile ingredient in various cuisines, including Jewish and Texan culinary traditions. The Flat Cut's culinary versatility, combined with its superior texture and flavor, solidifies its dominance in the brisket market, shaping consumption patterns and culinary preferences.
Brisket Market Share Analysis: Organic Brisket market is poised to register the fastest growth rae over the forecast period to 2032
Among the segments of the brisket market, Organic Brisket is the fastest-growing segment, fueled by increasing consumer demand for ethically sourced, sustainable, and higher quality meat products. Organic brisket, sourced from animals raised without synthetic pesticides, hormones, or antibiotics, resonates with health-conscious consumers seeking clean, natural food options. The rising awareness about the environmental impact of conventional meat production methods and concerns regarding animal welfare drive the preference for organic brisket among conscientious consumers. Additionally, the growing popularity of organic and sustainable food movements, coupled with the expansion of organic food offerings in supermarkets and specialty stores, further accelerates the growth of this segment. As consumers prioritize health, sustainability, and ethical considerations in their food choices, Organic Brisket stands poised for continued expansion, reshaping the landscape of the brisket market.
Brisket Market Segmentation
By Type
Point Cut
Flat Cut
By Product
Conventional brisket
Organic brisket
Countries Analyzed
North America (US, Canada, Mexico)
Europe (Germany, UK, France, Spain, Italy, Russia, Rest of Europe)
Asia Pacific (China, India, Japan, South Korea, Australia, South East Asia, Rest of Asia)
South America (Brazil, Argentina, Rest of South America)
Middle East and Africa (Saudi Arabia, UAE, Rest of Middle East, South Africa, Egypt, Rest of Africa)
Brisket Companies Profiled in the Study
Boston Brisket Compnay
Conagra Brands
Goode Company
Hormel Foods Corp
J. Freirich Foods
National Beef Packing Company LLC
Tyson Foods
*- List Not Exhaustive
Chapter 1. TABLE OF CONTENTS
Chapter 2. Introduction to Brisket Market
2.1. Market Overview
2.2. Key Statistics and Report Highlights
2.3. Scope of the Comprehensive Study
2.3.1. Market Definition
2.3.2 Countries and Regions Covered
2.3.3 Research Objective
2.3.4 Units, Currency, and Conversions
2.3.5 Industry Value Chain
2.4. Key Market Segments
2.5. Key Companies
2.6. Study Period
Chapter 3. Strategic Analysis Review
3.1. Brisket Pricing Analysis and Forecast
3.2. Porter’s Five Forces
3.3. Market Ecosystem
3.4. SWOT Analysis
3.5. Regulatory Scenario
3.3. Effects of Inflation, Russia-Ukraine War, moderating economic growth, and other macroeconomic factors
Chapter 4. Competitive Landscape
4.1. Market Share Analysis
4.1.1. Global Brisket Market Share by Company, 2023
4.1.2. Product Offerings of Leading Brisket Companies
4.2. Market Entropy
4.2.1. New Product Launches in the Industry
4.2.2. Mergers, Acquisitions, Joint ventures, and Partnerships
4.3. Key Strategies and Best Practices
Chapter 5. Global Market Projections: Best, Reference, and Low Case Scenarios
5.1. Growth Analysis- Case Scenario Definitions
5.2. Low Growth Case Scenario Forecasts
5.3. Reference Growth Case Scenario Forecasts
5.4. High Growth Case Scenario Forecasts
Chapter 6. Market Dynamics
6.1. Brisket Market Drivers
6.2. Brisket Market Challenges
6.6. Brisket Market Opportunities
6.4. Brisket Market Trends
Chapter 7. Global Brisket Market Outlook Trends
7.1. Global Brisket Revenue (USD Million) and CAGR (%) by Type (2021-2032)
7.2. Global Brisket Revenue (USD Million) and CAGR (%) by Application (2021-2032)
7.3. Global Brisket Revenue (USD Million) and CAGR (%) by Product (2021-2032)
By Type
Point Cut
Flat Cut
By Product
Conventional brisket
Organic brisket
Chapter 8. Global Brisket Regional Analysis and Outlook
8.1. Global Brisket Revenue (USD Million) By Regions (2021- 2032)
8.2. North America Brisket Revenue (USD Million) by Country (2021-2032)
8.2.1. United States Brisket Regional Analysis and Outlook
8.2.2. Canada Brisket Regional Analysis and Outlook
8.2.3. Mexico Brisket Regional Analysis and Outlook
8.3. Europe Brisket Revenue (USD Million), by Country (2021-2032)
8.3.1. Germany Brisket Regional Analysis and Outlook
8.3.2. France Brisket Regional Analysis and Outlook
8.3.3. United Kingdom Brisket Regional Analysis and Outlook
8.3.4. Spain Brisket Regional Analysis and Outlook
8.3.5. Italy Brisket Regional Analysis and Outlook
8.3.6. Russia Brisket Regional Analysis and Outlook
8.3.7. Rest of Europe Brisket Regional Analysis and Outlook
8.4. Asia Pacific Brisket Revenue (USD Million) by Country (2021-2032)
8.4.1. China Brisket Regional Analysis and Outlook
8.4.2. Japan Brisket Regional Analysis and Outlook
8.4.3. India Brisket Regional Analysis and Outlook
8.4.4. South Korea Brisket Regional Analysis and Outlook
8.4.5. Australia Brisket Regional Analysis and Outlook
8.4.6. South East Asia Brisket Regional Analysis and Outlook
8.4.7. Rest of Asia Pacific Brisket Regional Analysis and Outlook
8.5. South America Brisket Revenue (USD Million), by Country (2021-2032)
8.5.1. Brazil Brisket Regional Analysis and Outlook
8.5.2. Argentina Brisket Regional Analysis and Outlook
8.5.3. Rest of South America Brisket Regional Analysis and Outlook
8.6. Middle East and Africa Brisket Revenue (USD Million) by Country (2021-2032)
8.6.1. Middle East Brisket Regional Analysis and Outlook
8.6.2. Africa Brisket Regional Analysis and Outlook
Chapter 9. North America Brisket Analysis and Outlook
9.1. North America Brisket Revenue (USD Million) by Segments (2021-2032)
9.1.1. North America Brisket Revenue (USD Million) by Type (2021-2032)
9.1.2. North America Brisket Revenue (USD Million) by Application (2021-2032)
9.1.3. North America Brisket Revenue (USD Million) by Product (2021-2032)
By Type
Point Cut
Flat Cut
By Product
Conventional brisket
Organic brisket
Chapter 10. Europe Brisket Analysis and Outlook
10.1. Europe Brisket Revenue (USD Million), by Segments (USD Million) (2021-2032)
10.1.1. Europe Brisket Revenue (USD Million) by Type (2021-2032)
10.1.2. Europe Brisket Revenue (USD Million) by Application (2021-2032)
10.1.3. Europe Brisket Revenue (USD Million) by Product (2021-2032)
By Type
Point Cut
Flat Cut
By Product
Conventional brisket
Organic brisket
Chapter 11. Asia Pacific Brisket Analysis and Outlook
11.1. Asia Pacific Brisket Revenue (USD Million), and Revenue (USD Million) by Segments (2021-2032)
11.1.1. Asia Pacific Brisket Revenue (USD Million) by Type (2021-2032)
11.1.2. Asia Pacific Brisket Revenue (USD Million) by Application (2021-2032)
11.1.3. Asia Pacific Brisket Revenue (USD Million) by Product (2021-2032)
By Type
Point Cut
Flat Cut
By Product
Conventional brisket
Organic brisket
Chapter 12. South America Brisket Analysis and Outlook
12.1. South America Brisket Revenue (USD Million), by Segments (2021-2032)
12.1.1. South America Brisket Revenue (USD Million) by Type (2021-2032)
12.1.2. South America Brisket Revenue (USD Million) by Application (2021-2032)
12.1.3. South America Brisket Revenue (USD Million) by Product (2021-2032)
By Type
Point Cut
Flat Cut
By Product
Conventional brisket
Organic brisket
Chapter 13. Middle East and Africa Brisket Analysis and Outlook
13.1. Middle East and Africa Brisket Revenue (USD Million), by Segments (2021-2032)
13.1.1. Middle East and Africa Brisket Revenue (USD Million) by Type (2021-2032)
13.1.2. Middle East and Africa Brisket Revenue (USD Million) by Application (2021-2032)
13.1.3. Middle East and Africa Brisket Revenue (USD Million) by Product (2021-2032)
By Type
Point Cut
Flat Cut
By Product
Conventional brisket
Organic brisket
Chapter 14. Brisket Company Profiles
14.1 Business Overview
14.2 Product Profiles
14.3 SWOT Profiles
14.5 Recent Developments
14.6 Financial Profile
List of Companies
Boston Brisket Compnay
Conagra Brands
Goode Company
Hormel Foods Corp
J. Freirich Foods
National Beef Packing Company LLC
Tyson Foods
15. Methodology and Data Sources
15.1 Customization Offerings
15.2 Subscription Services
15.3 Related Reports
15.4 Publisher Expertise
LIST OF TABLES
Table 1 Market Segmentation Analysis
Table 2 Global Brisket Market Share of Leading Companies, 2023
Table 3 Product Offerings of Leading Companies
Table 4 Low Growth Scenario Forecasts
Table 5 Reference Case Growth Scenario
Table 6 High Growth Case Scenario
Table 7 Global Brisket Revenue (USD Million) And CAGR (%) By Type (2021-2032)
Table 8 Global Brisket Revenue (USD Million) And CAGR (%) By Application (2021-2032)
Table 9 Global Brisket Revenue (USD Million) And CAGR (%) By Product (2021-2032)
Table 10 Global Brisket Market Revenue (USD Million) By Regions (2021-2032)
Table 11 Global Brisket Market Share (%) By Regions (2021-2032)
Table 12 North America Brisket Revenue (USD Million) By Country (2021-2032)
Table 13 Europe Brisket Revenue (USD Million) By Country (2021-2032)
Table 14 Asia Pacific Brisket Revenue (USD Million) By Country (2021-2032)
Table 15 South America Brisket Revenue (USD Million) By Country (2021-2032)
Table 16 Middle East and Africa Brisket Revenue (USD Million) By Region (2021-2032)
Table 17 North America Brisket Revenue (USD Million) By Type (2021-2032)
Table 18 North America Brisket Revenue (USD Million) By Application (2021-2032)
Table 19 North America Brisket Revenue (USD Million) By Product (2021-2032)
Table 20 Europe Brisket Revenue (USD Million) By Type (2021-2032)
Table 21 Europe Brisket Revenue (USD Million) By Application (2021-2032)
Table 22 Europe Brisket Revenue (USD Million) By Product (2021-2032)
Table 23 Asia Pacific Brisket Revenue (USD Million) By Type (2021-2032)
Table 24 Asia Pacific Brisket Revenue (USD Million) By Application (2021-2032)
Table 25 Asia Pacific Brisket Revenue (USD Million) By Product (2021-2032)
Table 26 South America Brisket Revenue (USD Million) By Type (2021-2032)
Table 27 South America Brisket Revenue (USD Million) By Application (2021-2032)
Table 28 South America Brisket Revenue (USD Million) By Product (2021-2032)
Table 29 Middle East and Africa Brisket Revenue (USD Million) By Type (2021-2032)
Table 30 Middle East and Africa Brisket Revenue (USD Million) By Application (2021-2032)
Table 31 Middle East and Africa Brisket Revenue (USD Million) By Product (2021-2032)
LIST OF FIGURES
Figure 1. Market Scope
Figure 2. Pricing Forecasts Per Unit, 2023- 2032
Figure 3. Porter’s Five Forces
Figure 4. Global Brisket Market Revenue (USD Million) By Regions (2021-2032)
Figure 5. Global Brisket Market Share (%) By Regions (2023)
Figure 6. North America Brisket Revenue (USD Million) By Country (2021-2032)
Figure 7. United States Brisket Revenue (USD Million) By Country (2021-2032)
Figure 8. Canada Brisket Revenue (USD Million) By Country (2021-2032)
Figure 9. Mexico Brisket Revenue (USD Million) By Country (2021-2032)
Figure 10. Europe Brisket Revenue (USD Million) By Country (2021-2032)
Figure 11. Germany Brisket Revenue (USD Million) By Country (2021-2032)
Figure 12. France Brisket Revenue (USD Million) By Country (2021-2032)
Figure 13. United Kingdom Brisket Revenue (USD Million) By Country (2021-2032)
Figure 14. Spain Brisket Revenue (USD Million) By Country (2021-2032)
Figure 15. Italy Brisket Revenue (USD Million) By Country (2021-2032)
Figure 16. Russia Brisket Revenue (USD Million) By Country (2021-2032)
Figure 17. Rest of Europe Brisket Revenue (USD Million) By Country (2021-2032)
Figure 11. Asia Pacific Brisket Revenue (USD Million) By Country (2021-2032)
Figure 12. China Brisket Revenue (USD Million) By Country (2021-2032)
Figure 13. Japan Brisket Revenue (USD Million) By Country (2021-2032)
Figure 14. India Brisket Revenue (USD Million) By Country (2021-2032)
Figure 15. South Korea Brisket Revenue (USD Million) By Country (2021-2032)
Figure 16. Australia Brisket Revenue (USD Million) By Country (2021-2032)
Figure 17. South East Asia Brisket Revenue (USD Million) By Country (2021-2032)
Figure 18. South America Brisket Revenue (USD Million) By Country (2021-2032)
Figure 19. Brazil Brisket Revenue (USD Million) By Country (2021-2032)
Figure 20. Argentina Brisket Revenue (USD Million) By Country (2021-2032)
Figure 21. Rest of Asia Pacific Brisket Revenue (USD Million) By Country (2021-2032)
Figure 22. Middle East and Africa Brisket Revenue (USD Million) By Region (2021-2032)
Figure 23. Saudi Arabia Brisket Revenue (USD Million) By Region (2021-2032)
Figure 24. The UAE Brisket Revenue (USD Million) By Region (2021-2032)
Figure 25. Rest of Middle East Brisket Revenue (USD Million) By Region (2021-2032)
Figure 26. South Africa Brisket Revenue (USD Million) By Region (2021-2032)
Figure 27. Africa Brisket Revenue (USD Million) By Region (2021-2032)
Figure 28. North America Brisket Revenue (USD Million) By Type (2021-2032)
Figure 29. North America Brisket Revenue (USD Million) By Application (2021-2032)
Figure 30. North America Brisket Revenue (USD Million) By Product (2021-2032)
Figure 31. Europe Brisket Revenue (USD Million) By Type (2021-2032)
Figure 32. Europe Brisket Revenue (USD Million) By Application (2021-2032)
Figure 33. Europe Brisket Revenue (USD Million) By Product (2021-2032)
Figure 34. Asia Pacific Brisket Revenue (USD Million) By Type (2021-2032)
Figure 35. Asia Pacific Brisket Revenue (USD Million) By Application (2021-2032)
Figure 36. Asia Pacific Brisket Revenue (USD Million) By Product (2021-2032)
Figure 37. South America Brisket Revenue (USD Million) By Type (2021-2032)
Figure 38. South America Brisket Revenue (USD Million) By Application (2021-2032)
Figure 39. South America Brisket Revenue (USD Million) By Product (2021-2032)
Figure 40. Middle East and Africa Brisket Revenue (USD Million) By Type (2021-2032)
Figure 41. Middle East and Africa Brisket Revenue (USD Million) By Application (2021-2032)
Figure 42. Middle East and Africa Brisket Revenue (USD Million) By Product (2021-2032)
By Type
Point Cut
Flat Cut
By Product
Conventional brisket
Organic brisket
Countries Analyzed
North America (US, Canada, Mexico)
Europe (Germany, UK, France, Spain, Italy, Russia, Rest of Europe)
Asia Pacific (China, India, Japan, South Korea, Australia, South East Asia, Rest of Asia)
South America (Brazil, Argentina, Rest of South America)
Middle East and Africa (Saudi Arabia, UAE, Rest of Middle East, South Africa, Egypt, Rest of Africa)
