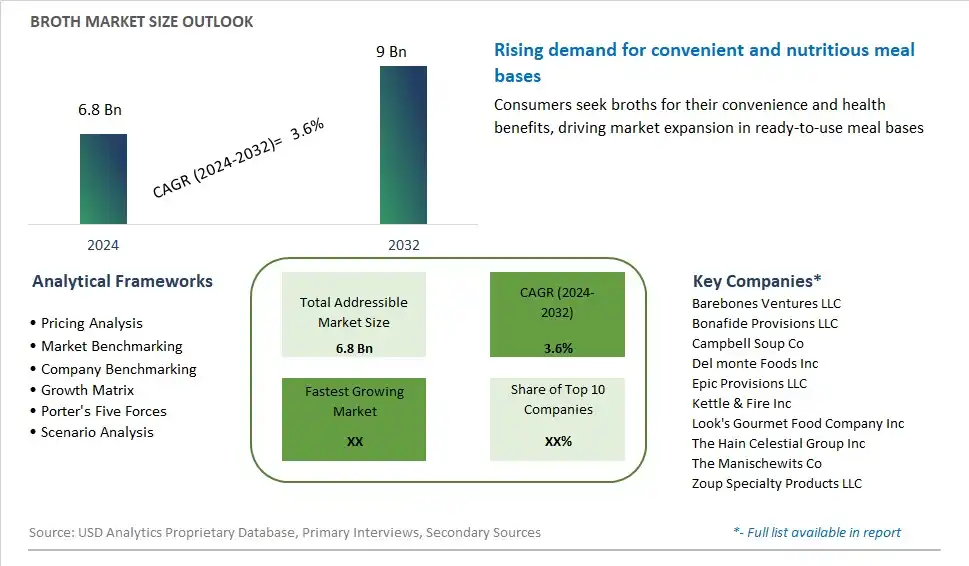
Global Broth Market Size is valued at $6.8 Billion in 2024 and is forecast to register a growth rate (CAGR) of 3.6% to reach $9 Billion by 2032.
The global Broth Market Comprehensive Study analyzes and forecasts the market size across 6 regions and 24 countries for diverse segments -By Type (Chicken Broth, Beef Broth, Seafood Broth, Vegetable Broth, Others), By Category (Organic, Conventional), By Distribution Channel (Supermarkets/Hypermarkets, Convenience Stores, Online Retail, Others)
An Introduction to Broth Market
Broth is a savory liquid made by simmering meat, bones, vegetables, and aromatics in water, used as a base for soups, stews, sauces, and other culinary applications in 2024. Broth is prized for its rich flavor, aroma, and nutritional content, as well as its versatility in enhancing the taste of various dishes. It can be made from poultry, beef, fish, or vegetables, with each type imparting its unique flavor profile and nutritional benefits. Broth is often seasoned with herbs, spices, and salt to enhance its taste, and can be consumed on its own as a comforting beverage or used as a cooking liquid to add depth and complexity to recipes. With the growing popularity of homemade cooking, wellness trends, and convenience-driven lifestyles, the market for broth is expanding, driven by demand for high-quality, natural products that offer convenience, flavor, and health benefits to consumers seeking wholesome and flavorful meal solutions.
Broth Competitive Landscape
The market report analyses the leading companies in the industry including Barebones Ventures LLC, Bonafide Provisions LLC, Campbell Soup Co, Del monte Foods Inc, Epic Provisions LLC, Kettle & Fire Inc, Look's Gourmet Food Company Inc, The Hain Celestial Group Inc, The Manischewits Co, Zoup Specialty Products LLC, and Others.
Broth Market Dynamics
Broth Market Trend: Rising Demand for Healthy and Convenient Food Options
The market for broth is experiencing a prominent trend driven by the rising demand for healthy and convenient food options among consumers. Broth, particularly bone broth, has gained popularity due to its perceived health benefits, including improved gut health, joint support, and immune system boost. Additionally, broth is valued for its versatility and convenience, serving as a nutritious base for soups, stews, sauces, and other culinary applications. This trend is fueled by increasing consumer awareness of the importance of wholesome nutrition and the desire for convenient meal solutions that offer both health and flavor benefits. As a result, there is a growing demand for high-quality, ready-to-use broth products made from natural ingredients, driving market growth and innovation in the broth segment.
Market Driver: Shift Towards Clean Label and Natural Ingredients
A significant driver of the broth market is the shift towards clean label and natural ingredients in food products. As consumers become more mindful of their food choices and ingredient lists, there is a preference for broth products made with simple, recognizable ingredients and free from artificial additives, preservatives, and flavor enhancers. Manufacturers are responding to this demand by formulating broths using natural and minimally processed ingredients such as bones, vegetables, herbs, and spices, without compromising on taste or nutritional value. Additionally, the popularity of clean eating and whole food diets has propelled the growth of broth as a wholesome and nourishing pantry staple, driving market expansion and adoption among health-conscious consumers seeking clean label alternatives to traditional packaged soups and broths.
Market Opportunity: Diversification into Functional and Flavored Broths
An opportunity for the broth market lies in diversification into functional and flavored broth products. With consumers increasingly seeking beverages and foods that offer functional benefits beyond basic nutrition, there is potential to innovate and differentiate broth offerings by incorporating functional ingredients and unique flavor profiles. Functional broth varieties fortified with ingredients such as collagen, turmeric, ginger, or adaptogenic herbs can cater to specific health and wellness trends, offering targeted benefits such as skin support, inflammation reduction, or stress relief. Additionally, flavored broth options infused with bold spices, aromatic herbs, or ethnic-inspired seasonings can appeal to adventurous palates and provide versatile culinary bases for a variety of global cuisines. By tapping into the growing demand for functional and flavored broth products, manufacturers can capitalize on consumer preferences for convenient, nutrient-rich foods that promote overall well-being and culinary creativity.
Broth Market Share Analysis: Chicken Broth held the dominant market share in 2024
The chicken broth segment commands the largest share in the broth market due to its versatility, widespread usage, and popularity among consumers. Chicken broth, made by simmering chicken bones, vegetables, and seasonings, is a staple ingredient in various cuisines worldwide and serves as the base for many soups, stews, sauces, and gravies. Its rich flavor profile, savory aroma, and comforting qualities make it a go-to choice for home cooks and professional chefs alike. Additionally, chicken broth is perceived as a wholesome and nourishing food product, valued for its potential health benefits, including aiding digestion, boosting immunity, and providing essential nutrients. The widespread availability of chicken broth in both homemade and packaged forms further contributes to its dominance in the market. As a result, the chicken broth segment remains the largest in the broth market, meeting the diverse culinary needs and preferences of consumers across different regions.
Broth Market Share Analysis: Organic market is poised to register the fastest growth rae over the forecast period to 2032
The organic segment is experiencing the fastest growth in the broth market as consumers increasingly prioritize health, sustainability, and transparency in their food choices. Organic broth, made from ingredients grown without synthetic pesticides, fertilizers, or genetically modified organisms (GMOs), appeals to health-conscious consumers seeking wholesome and clean-label products. Additionally, organic broth is perceived as more environmentally friendly, supporting sustainable farming practices and animal welfare standards. With rising awareness about the potential health risks associated with synthetic additives and pesticides, consumers are turning to organic options for safer and more nutritious food alternatives. Further, the expanding availability of organic broth in mainstream retail outlets and the growing demand for organic products across demographic groups contribute to the rapid growth of the organic segment in the broth market. As a result, organic broth is the fastest-growing segment, reflecting the evolving consumer preferences towards natural and sustainable food options.
Broth Market Share Analysis: Supermarkets/Hypermarkets held the dominant market share in 2024
The supermarkets/hypermarkets segment commands the largest share in the broth market due to its extensive reach, diverse product offerings, and consumer convenience. Supermarkets and hypermarkets serve as primary destinations for consumers to purchase grocery items, including broth, offering a wide selection of brands, flavors, and packaging options under one roof. These retail outlets leverage their spacious layouts, strategic locations, and promotional activities to attract shoppers and drive sales of broth products. Additionally, supermarkets and hypermarkets provide a platform for manufacturers to showcase their products through prominent shelf placements, promotional displays, and marketing campaigns, influencing consumer purchasing decisions. Furthermore, the convenience of one-stop shopping, competitive pricing, and the availability of bulk purchasing options further solidify the dominance of supermarkets/hypermarkets in the broth market. As a result, this distribution channel remains the largest, catering to the diverse needs and preferences of consumers seeking convenience and variety in their broth purchases.
Broth Market Segmentation
By Type
Chicken Broth
Beef Broth
Seafood Broth
Vegetable Broth
Others
By Category
Organic
Conventional
By Distribution Channel
Supermarkets/Hypermarkets
Convenience Stores
Online Retail
Others
Countries Analyzed
North America (US, Canada, Mexico)
Europe (Germany, UK, France, Spain, Italy, Russia, Rest of Europe)
Asia Pacific (China, India, Japan, South Korea, Australia, South East Asia, Rest of Asia)
South America (Brazil, Argentina, Rest of South America)
Middle East and Africa (Saudi Arabia, UAE, Rest of Middle East, South Africa, Egypt, Rest of Africa)
Broth Companies Profiled in the Study
Barebones Ventures LLC
Bonafide Provisions LLC
Campbell Soup Co
Del monte Foods Inc
Epic Provisions LLC
Kettle & Fire Inc
Look's Gourmet Food Company Inc
The Hain Celestial Group Inc
The Manischewits Co
Zoup Specialty Products LLC
*- List Not Exhaustive
Chapter 1. TABLE OF CONTENTS
Chapter 2. Introduction to Broth Market
2.1. Market Overview
2.2. Key Statistics and Report Highlights
2.3. Scope of the Comprehensive Study
2.3.1. Market Definition
2.3.2 Countries and Regions Covered
2.3.3 Research Objective
2.3.4 Units, Currency, and Conversions
2.3.5 Industry Value Chain
2.4. Key Market Segments
2.5. Key Companies
2.6. Study Period
Chapter 3. Strategic Analysis Review
3.1. Broth Pricing Analysis and Forecast
3.2. Porter’s Five Forces
3.3. Market Ecosystem
3.4. SWOT Analysis
3.5. Regulatory Scenario
3.3. Effects of Inflation, Russia-Ukraine War, moderating economic growth, and other macroeconomic factors
Chapter 4. Competitive Landscape
4.1. Market Share Analysis
4.1.1. Global Broth Market Share by Company, 2023
4.1.2. Product Offerings of Leading Broth Companies
4.2. Market Entropy
4.2.1. New Product Launches in the Industry
4.2.2. Mergers, Acquisitions, Joint ventures, and Partnerships
4.3. Key Strategies and Best Practices
Chapter 5. Global Market Projections: Best, Reference, and Low Case Scenarios
5.1. Growth Analysis- Case Scenario Definitions
5.2. Low Growth Case Scenario Forecasts
5.3. Reference Growth Case Scenario Forecasts
5.4. High Growth Case Scenario Forecasts
Chapter 6. Market Dynamics
6.1. Broth Market Drivers
6.2. Broth Market Challenges
6.6. Broth Market Opportunities
6.4. Broth Market Trends
Chapter 7. Global Broth Market Outlook Trends
7.1. Global Broth Revenue (USD Million) and CAGR (%) by Type (2021-2032)
7.2. Global Broth Revenue (USD Million) and CAGR (%) by Application (2021-2032)
7.3. Global Broth Revenue (USD Million) and CAGR (%) by Product (2021-2032)
By Type
Chicken Broth
Beef Broth
Seafood Broth
Vegetable Broth
Others
By Category
Organic
Conventional
By Distribution Channel
Supermarkets/Hypermarkets
Convenience Stores
Online Retail
Others
Chapter 8. Global Broth Regional Analysis and Outlook
8.1. Global Broth Revenue (USD Million) By Regions (2021- 2032)
8.2. North America Broth Revenue (USD Million) by Country (2021-2032)
8.2.1. United States Broth Regional Analysis and Outlook
8.2.2. Canada Broth Regional Analysis and Outlook
8.2.3. Mexico Broth Regional Analysis and Outlook
8.3. Europe Broth Revenue (USD Million), by Country (2021-2032)
8.3.1. Germany Broth Regional Analysis and Outlook
8.3.2. France Broth Regional Analysis and Outlook
8.3.3. United Kingdom Broth Regional Analysis and Outlook
8.3.4. Spain Broth Regional Analysis and Outlook
8.3.5. Italy Broth Regional Analysis and Outlook
8.3.6. Russia Broth Regional Analysis and Outlook
8.3.7. Rest of Europe Broth Regional Analysis and Outlook
8.4. Asia Pacific Broth Revenue (USD Million) by Country (2021-2032)
8.4.1. China Broth Regional Analysis and Outlook
8.4.2. Japan Broth Regional Analysis and Outlook
8.4.3. India Broth Regional Analysis and Outlook
8.4.4. South Korea Broth Regional Analysis and Outlook
8.4.5. Australia Broth Regional Analysis and Outlook
8.4.6. South East Asia Broth Regional Analysis and Outlook
8.4.7. Rest of Asia Pacific Broth Regional Analysis and Outlook
8.5. South America Broth Revenue (USD Million), by Country (2021-2032)
8.5.1. Brazil Broth Regional Analysis and Outlook
8.5.2. Argentina Broth Regional Analysis and Outlook
8.5.3. Rest of South America Broth Regional Analysis and Outlook
8.6. Middle East and Africa Broth Revenue (USD Million) by Country (2021-2032)
8.6.1. Middle East Broth Regional Analysis and Outlook
8.6.2. Africa Broth Regional Analysis and Outlook
Chapter 9. North America Broth Analysis and Outlook
9.1. North America Broth Revenue (USD Million) by Segments (2021-2032)
9.1.1. North America Broth Revenue (USD Million) by Type (2021-2032)
9.1.2. North America Broth Revenue (USD Million) by Application (2021-2032)
9.1.3. North America Broth Revenue (USD Million) by Product (2021-2032)
By Type
Chicken Broth
Beef Broth
Seafood Broth
Vegetable Broth
Others
By Category
Organic
Conventional
By Distribution Channel
Supermarkets/Hypermarkets
Convenience Stores
Online Retail
Others
Chapter 10. Europe Broth Analysis and Outlook
10.1. Europe Broth Revenue (USD Million), by Segments (USD Million) (2021-2032)
10.1.1. Europe Broth Revenue (USD Million) by Type (2021-2032)
10.1.2. Europe Broth Revenue (USD Million) by Application (2021-2032)
10.1.3. Europe Broth Revenue (USD Million) by Product (2021-2032)
By Type
Chicken Broth
Beef Broth
Seafood Broth
Vegetable Broth
Others
By Category
Organic
Conventional
By Distribution Channel
Supermarkets/Hypermarkets
Convenience Stores
Online Retail
Others
Chapter 11. Asia Pacific Broth Analysis and Outlook
11.1. Asia Pacific Broth Revenue (USD Million), and Revenue (USD Million) by Segments (2021-2032)
11.1.1. Asia Pacific Broth Revenue (USD Million) by Type (2021-2032)
11.1.2. Asia Pacific Broth Revenue (USD Million) by Application (2021-2032)
11.1.3. Asia Pacific Broth Revenue (USD Million) by Product (2021-2032)
By Type
Chicken Broth
Beef Broth
Seafood Broth
Vegetable Broth
Others
By Category
Organic
Conventional
By Distribution Channel
Supermarkets/Hypermarkets
Convenience Stores
Online Retail
Others
Chapter 12. South America Broth Analysis and Outlook
12.1. South America Broth Revenue (USD Million), by Segments (2021-2032)
12.1.1. South America Broth Revenue (USD Million) by Type (2021-2032)
12.1.2. South America Broth Revenue (USD Million) by Application (2021-2032)
12.1.3. South America Broth Revenue (USD Million) by Product (2021-2032)
By Type
Chicken Broth
Beef Broth
Seafood Broth
Vegetable Broth
Others
By Category
Organic
Conventional
By Distribution Channel
Supermarkets/Hypermarkets
Convenience Stores
Online Retail
Others
Chapter 13. Middle East and Africa Broth Analysis and Outlook
13.1. Middle East and Africa Broth Revenue (USD Million), by Segments (2021-2032)
13.1.1. Middle East and Africa Broth Revenue (USD Million) by Type (2021-2032)
13.1.2. Middle East and Africa Broth Revenue (USD Million) by Application (2021-2032)
13.1.3. Middle East and Africa Broth Revenue (USD Million) by Product (2021-2032)
By Type
Chicken Broth
Beef Broth
Seafood Broth
Vegetable Broth
Others
By Category
Organic
Conventional
By Distribution Channel
Supermarkets/Hypermarkets
Convenience Stores
Online Retail
Others
Chapter 14. Broth Company Profiles
14.1 Business Overview
14.2 Product Profiles
14.3 SWOT Profiles
14.5 Recent Developments
14.6 Financial Profile
List of Companies
Barebones Ventures LLC
Bonafide Provisions LLC
Campbell Soup Co
Del monte Foods Inc
Epic Provisions LLC
Kettle & Fire Inc
Look's Gourmet Food Company Inc
The Hain Celestial Group Inc
The Manischewits Co
Zoup Specialty Products LLC
15. Methodology and Data Sources
15.1 Customization Offerings
15.2 Subscription Services
15.3 Related Reports
15.4 Publisher Expertise
LIST OF TABLES
Table 1 Market Segmentation Analysis
Table 2 Global Broth Market Share of Leading Companies, 2023
Table 3 Product Offerings of Leading Companies
Table 4 Low Growth Scenario Forecasts
Table 5 Reference Case Growth Scenario
Table 6 High Growth Case Scenario
Table 7 Global Broth Revenue (USD Million) And CAGR (%) By Type (2021-2032)
Table 8 Global Broth Revenue (USD Million) And CAGR (%) By Application (2021-2032)
Table 9 Global Broth Revenue (USD Million) And CAGR (%) By Product (2021-2032)
Table 10 Global Broth Market Revenue (USD Million) By Regions (2021-2032)
Table 11 Global Broth Market Share (%) By Regions (2021-2032)
Table 12 North America Broth Revenue (USD Million) By Country (2021-2032)
Table 13 Europe Broth Revenue (USD Million) By Country (2021-2032)
Table 14 Asia Pacific Broth Revenue (USD Million) By Country (2021-2032)
Table 15 South America Broth Revenue (USD Million) By Country (2021-2032)
Table 16 Middle East and Africa Broth Revenue (USD Million) By Region (2021-2032)
Table 17 North America Broth Revenue (USD Million) By Type (2021-2032)
Table 18 North America Broth Revenue (USD Million) By Application (2021-2032)
Table 19 North America Broth Revenue (USD Million) By Product (2021-2032)
Table 20 Europe Broth Revenue (USD Million) By Type (2021-2032)
Table 21 Europe Broth Revenue (USD Million) By Application (2021-2032)
Table 22 Europe Broth Revenue (USD Million) By Product (2021-2032)
Table 23 Asia Pacific Broth Revenue (USD Million) By Type (2021-2032)
Table 24 Asia Pacific Broth Revenue (USD Million) By Application (2021-2032)
Table 25 Asia Pacific Broth Revenue (USD Million) By Product (2021-2032)
Table 26 South America Broth Revenue (USD Million) By Type (2021-2032)
Table 27 South America Broth Revenue (USD Million) By Application (2021-2032)
Table 28 South America Broth Revenue (USD Million) By Product (2021-2032)
Table 29 Middle East and Africa Broth Revenue (USD Million) By Type (2021-2032)
Table 30 Middle East and Africa Broth Revenue (USD Million) By Application (2021-2032)
Table 31 Middle East and Africa Broth Revenue (USD Million) By Product (2021-2032)
LIST OF FIGURES
Figure 1. Market Scope
Figure 2. Pricing Forecasts Per Unit, 2023- 2032
Figure 3. Porter’s Five Forces
Figure 4. Global Broth Market Revenue (USD Million) By Regions (2021-2032)
Figure 5. Global Broth Market Share (%) By Regions (2023)
Figure 6. North America Broth Revenue (USD Million) By Country (2021-2032)
Figure 7. United States Broth Revenue (USD Million) By Country (2021-2032)
Figure 8. Canada Broth Revenue (USD Million) By Country (2021-2032)
Figure 9. Mexico Broth Revenue (USD Million) By Country (2021-2032)
Figure 10. Europe Broth Revenue (USD Million) By Country (2021-2032)
Figure 11. Germany Broth Revenue (USD Million) By Country (2021-2032)
Figure 12. France Broth Revenue (USD Million) By Country (2021-2032)
Figure 13. United Kingdom Broth Revenue (USD Million) By Country (2021-2032)
Figure 14. Spain Broth Revenue (USD Million) By Country (2021-2032)
Figure 15. Italy Broth Revenue (USD Million) By Country (2021-2032)
Figure 16. Russia Broth Revenue (USD Million) By Country (2021-2032)
Figure 17. Rest of Europe Broth Revenue (USD Million) By Country (2021-2032)
Figure 11. Asia Pacific Broth Revenue (USD Million) By Country (2021-2032)
Figure 12. China Broth Revenue (USD Million) By Country (2021-2032)
Figure 13. Japan Broth Revenue (USD Million) By Country (2021-2032)
Figure 14. India Broth Revenue (USD Million) By Country (2021-2032)
Figure 15. South Korea Broth Revenue (USD Million) By Country (2021-2032)
Figure 16. Australia Broth Revenue (USD Million) By Country (2021-2032)
Figure 17. South East Asia Broth Revenue (USD Million) By Country (2021-2032)
Figure 18. South America Broth Revenue (USD Million) By Country (2021-2032)
Figure 19. Brazil Broth Revenue (USD Million) By Country (2021-2032)
Figure 20. Argentina Broth Revenue (USD Million) By Country (2021-2032)
Figure 21. Rest of Asia Pacific Broth Revenue (USD Million) By Country (2021-2032)
Figure 22. Middle East and Africa Broth Revenue (USD Million) By Region (2021-2032)
Figure 23. Saudi Arabia Broth Revenue (USD Million) By Region (2021-2032)
Figure 24. The UAE Broth Revenue (USD Million) By Region (2021-2032)
Figure 25. Rest of Middle East Broth Revenue (USD Million) By Region (2021-2032)
Figure 26. South Africa Broth Revenue (USD Million) By Region (2021-2032)
Figure 27. Africa Broth Revenue (USD Million) By Region (2021-2032)
Figure 28. North America Broth Revenue (USD Million) By Type (2021-2032)
Figure 29. North America Broth Revenue (USD Million) By Application (2021-2032)
Figure 30. North America Broth Revenue (USD Million) By Product (2021-2032)
Figure 31. Europe Broth Revenue (USD Million) By Type (2021-2032)
Figure 32. Europe Broth Revenue (USD Million) By Application (2021-2032)
Figure 33. Europe Broth Revenue (USD Million) By Product (2021-2032)
Figure 34. Asia Pacific Broth Revenue (USD Million) By Type (2021-2032)
Figure 35. Asia Pacific Broth Revenue (USD Million) By Application (2021-2032)
Figure 36. Asia Pacific Broth Revenue (USD Million) By Product (2021-2032)
Figure 37. South America Broth Revenue (USD Million) By Type (2021-2032)
Figure 38. South America Broth Revenue (USD Million) By Application (2021-2032)
Figure 39. South America Broth Revenue (USD Million) By Product (2021-2032)
Figure 40. Middle East and Africa Broth Revenue (USD Million) By Type (2021-2032)
Figure 41. Middle East and Africa Broth Revenue (USD Million) By Application (2021-2032)
Figure 42. Middle East and Africa Broth Revenue (USD Million) By Product (2021-2032)
By Type
Chicken Broth
Beef Broth
Seafood Broth
Vegetable Broth
Others
By Category
Organic
Conventional
By Distribution Channel
Supermarkets/Hypermarkets
Convenience Stores
Online Retail
Others
Countries Analyzed
North America (US, Canada, Mexico)
Europe (Germany, UK, France, Spain, Italy, Russia, Rest of Europe)
Asia Pacific (China, India, Japan, South Korea, Australia, South East Asia, Rest of Asia)
South America (Brazil, Argentina, Rest of South America)
Middle East and Africa (Saudi Arabia, UAE, Rest of Middle East, South Africa, Egypt, Rest of Africa)
