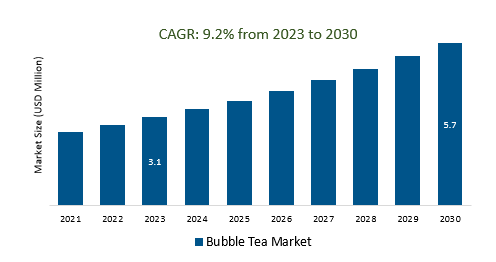
The Global Bubble Tea Market Size is estimated to be US 3.1 Billion in 2023. It is poised to register 9.2% growth over the forecast period from 2023 to 2030 to reach US $ 5.7 billion in 2030.
The market growth is driven by the increasing use of high-quality and premium ingredients, such as premium tea leaves, fresh fruit, and high-quality milk, which can set a bubble tea shop apart and cater to discerning customers. Leading Companies focusing on Global Expansion, Health and Wellness, Sustainability, New Flavors and Ingredients, Cultural Appeal, Technology Integration, and others to boost market shares in the industry.
Market Overview
The bubble tea market was a rapidly growing and diverse sector within the global beverage industry. It had witnessed significant expansion driven by a wide range of flavors, customization options, cultural appeal, and a strong presence in youth and pop culture. However, concerns over high sugar content and competition were notable challenges. The market had also seen global expansion, and sustainability was becoming a key focus. Future prospects looked promising with a continued emphasis on health and wellness, sustainability, and innovative flavors and ingredients.
Market Dynamics
Market Trends- To make bubble tea, you will need a few essential machines and equipment, such as a bubble tea shaker, a sealer machine, and a fructose dispenser
The bubble tea shop requires specific machines and equipment to ensure the efficient and consistent preparation of this popular beverage. These essentials typically include a bubble tea shaker, which vigorously mixes the tea and ingredients to achieve the characteristic frothy texture and consistent taste, and a sealer machine that securely seals the plastic cup with a plastic film, providing a spill-proof and hygienic container for the drink, and a fructose dispenser, which accurately dispenses sweeteners like fructose syrup, allowing for precise control of sweetness levels in the beverages
Market Driver- Consumers are increasingly demanding bubble tea in a variety of flavors, beyond the traditional black milk tea flavor
Consumers in the bubble tea market are increasingly seeking a wider variety of flavors beyond traditional black milk tea, driving innovation in the industry. Bubble tea shops are responding with diverse options, including fruit infusions, savory flavors, and health-conscious choices like low-sugar and dairy-free alternatives, reflecting the market's adaptability to evolving consumer preferences and setting the stage for continued growth.
Market Opportunity- Bubble tea shops are increasingly using premium ingredients to create unique and high-quality drinks.
In the bubble tea market, a noticeable trend is the increasing use of premium ingredients by bubble tea shops, aiming to provide high-quality, superior drinks. This includes the use of top-quality tea leaves, sourced from renowned regions like Taiwan and Japan, along with fresh, locally sourced fruit and high-quality milk. These premium ingredients enhance the flavor and overall quality of bubble tea, catering to discerning consumers and elevating industry standards.
Market Share Analysis-Black Tea Bubble Tea Market will register the fastest growth
The Global Bubble Tea Market is analyzed across Black Tea, Green Tea, Oolong Tea, White Tea, and others. Black Tea is poised to register the fastest growth. The black tea bubble tea market is a segment within the larger bubble tea industry, featuring beverages that use black tea as the base. It has gained popularity among consumers who prefer the distinct flavor of black tea in their boba drinks, offering a diverse range of options within this category to cater to evolving tastes and preferences.
Market Share Analysis- Liquid held a significant market share in 2023
The Global Bubble Tea Market is analyzed across various applications including Flavor, Creamer, Sweetener, Liquid, Tapioca Pearls, and others. Of these, Liquid held a significant market share in 2023. In the bubble tea market, the term liquid refers to the primary liquid components used as the base for bubble tea, typically involving brewed tea, milk, or fruit juice. Various types of tea and milk options, including non-dairy alternatives, are utilized to craft the diverse flavor profiles of bubble tea, catering to individual tastes and dietary preferences. These liquid bases form the foundation of bubble tea, allowing for a wide range of creative combinations and customizations.
Bubble Tea Market Segmentation
By Type
- Black Tea
- Green Tea
- Oolong Tea
- White Tea
By Component
- Flavor
- Creamer
- Sweetener
- Liquid
- Tapioca Pearls
- Others
By Flavor
- Fruit
- Taro
- Strawberry
- Classic
- Coffee
- Others
By Region
- North America (United States, Canada, Mexico)
- Europe (Germany, France, United Kingdom, Spain, Italy, Others)
- Asia Pacific (China, India, Japan, South Korea, Australia, Others)
- Latin America (Brazil, Argentina, Others)
- Middle East and Africa (Saudi Arabia, UAE, Kuwait, Other Middle East, South Africa, Nigeria, Other Africa)
Bubble Tea Market Companies
- Bubble Tea House Company
- Lollicup USA Inc
- Fokus Inc
- Gong Cha
- ChaTime
- Ten Ren’s Tea Time
- Bubble Tea Supply Inc
- Bobabox Ltd
- T Bun International
- Troika JC
*List not exhaustive
Bubble Tea Market Outlook 2023
1 Market Overview
1.1 Introduction to the Bubble Tea Market
1.2 Scope of the Study
1.3 Research Objective
1.3.1 Key Market Scope and Segments
1.3.2 Players Covered
1.3.3 Years Considered
2 Executive Summary
2.1 2023 Bubble Tea Industry- Market Statistics
3 Market Dynamics
3.1 Market Drivers
3.2 Market Challenges
3.3 Market Opportunities
3.4 Market Trends
4 Market Factor Analysis
4.1 Porter’s Five Forces
4.2 Market Entropy
4.2.1 Global Bubble Tea Market Companies with Area Served
4.2.2 Products Offerings Global Bubble Tea Market
5 COVID-19 Impact Analysis and Outlook Scenarios
5.1.1 Covid-19 Impact Analysis
5.1.2 post-COVID-19 Scenario- Low Growth Case
5.1.3 post-COVID-19 Scenario- Reference Growth Case
5.1.4 post-COVID-19 Scenario- Low Growth Case
6 Global Bubble Tea Market Trends
6.1 Global Bubble Tea Revenue (USD Million) and CAGR (%) by Type (2018-2030)
6.2 Global Bubble Tea Revenue (USD Million) and CAGR (%) by Applications (2018-2030)
6.3 Global Bubble Tea Revenue (USD Million) and CAGR (%) by regions (2018-2030)
7 Global Bubble Tea Market Revenue (USD Million) by Type, and Applications (2018-2022)
7.1 Global Bubble Tea Revenue (USD Million) by Type (2018-2022)
7.1.1 Global Bubble Tea Revenue (USD Million), Market Share (%) by Type (2018-2022)
7.2 Global Bubble Tea Revenue (USD Million) by Applications (2018-2022)
7.2.1 Global Bubble Tea Revenue (USD Million), Market Share (%) by Applications (2018-2022)
8 Global Bubble Tea Development Regional Status and Outlook
8.1 Global Bubble Tea Revenue (USD Million) By Regions (2018-2022)
8.2 North America Bubble Tea Revenue (USD Million) by Type, and Application (2018-2022)
8.2.1 North America Bubble Tea Revenue (USD Million) by Country (2018-2022)
8.2.2 North America Bubble Tea Revenue (USD Million) by Type (2018-2022)
8.2.3 North America Bubble Tea Revenue (USD Million) by Applications (2018-2022)
8.3 Europe Bubble Tea Revenue (USD Million), by Type, and Applications (USD Million) (2018-2022)
8.3.1 Europe Bubble Tea Revenue (USD Million), by Country (2018-2022)
8.3.2 Europe Bubble Tea Revenue (USD Million) by Type (2018-2022)
8.3.3 Europe Bubble Tea Revenue (USD Million) by Applications (2018-2022)
8.4 Asia Pacific Bubble Tea Revenue (USD Million), and Revenue (USD Million) by Type, and Applications (2018-2022)
8.4.1 Asia Pacific Bubble Tea Revenue (USD Million) by Country (2018-2022)
8.4.2 Asia Pacific Bubble Tea Revenue (USD Million) by Type (2018-2022)
8.4.3 Asia Pacific Bubble Tea Revenue (USD Million) by Applications (2018-2022)
8.5 South America Bubble Tea Revenue (USD Million), by Type, and Applications (2018-2022)
8.5.1 South America Bubble Tea Revenue (USD Million), by Country (2018-2022)
8.5.2 South America Bubble Tea Revenue (USD Million) by Type (2018-2022)
8.5.3 South America Bubble Tea Revenue (USD Million) by Applications (2018-2022)
8.6 Middle East and Africa Bubble Tea Revenue (USD Million), by Type, Technology, Application, Thickness (2018-2022)
8.6.1 Middle East and Africa Bubble Tea Revenue (USD Million) by Country (2018-2022)
8.6.2 Middle East and Africa Bubble Tea Revenue (USD Million) by Type (2018-2022)
8.6.3 Middle East and Africa Bubble Tea Revenue (USD Million) by Applications (2018-2022)
9 Company Profiles
10 Global Bubble Tea Market Revenue (USD Million), by Type, and Applications (2023-2030)
10.1 Global Bubble Tea Revenue (USD Million) and Market Share (%) by Type (2023-2030)
10.1.1 Global Bubble Tea Revenue (USD Million), and Market Share (%) by Type (2023-2030)
10.2 Global Bubble Tea Revenue (USD Million) and Market Share (%) by Applications (2023-2030)
10.2.1 Global Bubble Tea Revenue (USD Million), and Market Share (%) by Applications (2023-2030)
11 Global Bubble Tea Development Regional Status and Outlook Forecast
11.1 Global Bubble Tea Revenue (USD Million) By Regions (2023-2030)
11.2 North America Bubble Tea Revenue (USD Million) by Type, and Applications (2023-2030)
11.2.1 North America Bubble Tea Revenue (USD) Million by Country (2023-2030)
11.2.2 North America Bubble Tea Revenue (USD Million), by Type (2023-2030)
11.2.3 North America Bubble Tea Revenue (USD Million), Market Share (%) by Applications (2023-2030)
11.3 Europe Bubble Tea Revenue (USD Million), by Type, and Applications (2023-2030)
11.3.1 Europe Bubble Tea Revenue (USD Million), by Country (2023-2030)
11.3.2 Europe Bubble Tea Revenue (USD Million), by Type (2023-2030)
11.3.3 Europe Bubble Tea Revenue (USD Million), by Applications (2023-2030)
11.4 Asia Pacific Bubble Tea Revenue (USD Million) by Type, and Applications (2023-2030)
11.4.1 Asia Pacific Bubble Tea Revenue (USD Million), by Country (2023-2030)
11.4.2 Asia Pacific Bubble Tea Revenue (USD Million), by Type (2023-2030)
11.4.3 Asia Pacific Bubble Tea Revenue (USD Million), by Applications (2023-2030)
11.5 South America Bubble Tea Revenue (USD Million), by Type, and Applications (2023-2030)
11.5.1 South America Bubble Tea Revenue (USD Million), by Country (2023-2030)
11.5.2 South America Bubble Tea Revenue (USD Million), by Type (2023-2030)
11.5.3 South America Bubble Tea Revenue (USD Million), by Applications (2023-2030)
11.6 Middle East and Africa Bubble Tea Revenue (USD Million), by Type, and Applications (2023-2030)
11.6.1 Middle East and Africa Bubble Tea Revenue (USD Million), by region (2023-2030)
11.6.2 Middle East and Africa Bubble Tea Revenue (USD Million), by Type (2023-2030)
11.6.3 Middle East and Africa Bubble Tea Revenue (USD Million), by Applications (2023-2030)
12 Methodology and Data Sources
12.1 Methodology/Research Approach
12.1.1 Research Programs/Design
12.1.2 Market Size Estimation
12.1.3 Market Breakdown and Data Triangulation
12.2 Data Sources
12.2.1 Secondary Sources
12.2.2 Primary Sources
12.3 Disclaimer
List of Tables
Table 1 Market Segmentation Analysis
Table 2 Global Bubble Tea Market Companies with Areas Served
Table 3 Products Offerings Global Bubble Tea Market
Table 4 Low Growth Scenario Forecasts
Table 5 Reference Case Growth Scenario
Table 6 High Growth Case Scenario
Table 7 Global Bubble Tea Revenue (USD Million) And CAGR (%) By Type (2018-2030)
Table 8 Global Bubble Tea Revenue (USD Million) And CAGR (%) By Applications (2018-2030)
Table 9 Global Bubble Tea Revenue (USD Million) And CAGR (%) By Regions (2018-2030)
Table 10 Global Bubble Tea Revenue (USD Million) By Type (2018-2022)
Table 11 Global Bubble Tea Revenue Market Share (%) By Type (2018-2022)
Table 12 Global Bubble Tea Revenue (USD Million) By Applications (2018-2022)
Table 13 Global Bubble Tea Revenue Market Share (%) By Applications (2018-2022)
Table 14 Global Bubble Tea Market Revenue (USD Million) By Regions (2018-2022)
Table 15 Global Bubble Tea Market Share (%) By Regions (2018-2022)
Table 16 North America Bubble Tea Revenue (USD Million) By Country (2018-2022)
Table 17 North America Bubble Tea Revenue (USD Million) By Type (2018-2022)
Table 18 North America Bubble Tea Revenue (USD Million) By Applications (2018-2022)
Table 19 Europe Bubble Tea Revenue (USD Million) By Country (2018-2022)
Table 20 Europe Bubble Tea Revenue (USD Million) By Type (2018-2022)
Table 21 Europe Bubble Tea Revenue (USD Million) By Applications (2018-2022)
Table 22 Asia Pacific Bubble Tea Revenue (USD Million) By Country (2018-2022)
Table 23 Asia Pacific Bubble Tea Revenue (USD Million) By Type (2018-2022)
Table 24 Asia Pacific Bubble Tea Revenue (USD Million) By Applications (2018-2022)
Table 25 South America Bubble Tea Revenue (USD Million) By Country (2018-2022)
Table 26 South America Bubble Tea Revenue (USD Million) By Type (2018-2022)
Table 27 South America Bubble Tea Revenue (USD Million) By Applications (2018-2022)
Table 28 Middle East and Africa Bubble Tea Revenue (USD Million) By Region (2018-2022)
Table 29 Middle East and Africa Bubble Tea Revenue (USD Million) By Type (2018-2022)
Table 30 Middle East and Africa Bubble Tea Revenue (USD Million) By Applications (2018-2022)
Table 31 Financial Analysis
Table 32 Global Bubble Tea Revenue (USD Million) By Type (2023-2030)
Table 33 Global Bubble Tea Revenue Market Share (%) By Type (2023-2030)
Table 34 Global Bubble Tea Revenue (USD Million) By Applications (2023-2030)
Table 35 Global Bubble Tea Revenue Market Share (%) By Applications (2023-2030)
Table 36 Global Bubble Tea Market Revenue (USD Million), And Revenue (USD Million) By Regions (2023-2030)
Table 37 North America Bubble Tea Revenue (USD)By Country (2023-2030)
Table 38 North America Bubble Tea Revenue (USD Million) By Type (2023-2030)
Table 39 North America Bubble Tea Revenue (USD Million) By Applications (2023-2030)
Table 40 Europe Bubble Tea Revenue (USD Million) By Country (2023-2030)
Table 41 Europe Bubble Tea Revenue (USD Million) By Type (2023-2030)
Table 42 Europe Bubble Tea Revenue (USD Million) By Applications (2023-2030)
Table 43 Asia Pacific Bubble Tea Revenue (USD Million) By Country (2023-2030)
Table 44 Asia Pacific Bubble Tea Revenue (USD Million) By Type (2023-2030)
Table 45 Asia Pacific Bubble Tea Revenue (USD Million) By Applications (2023-2030)
Table 46 South America Bubble Tea Revenue (USD Million) By Country (2023-2030)
Table 47 South America Bubble Tea Revenue (USD Million) By Type (2023-2030)
Table 48 South America Bubble Tea Revenue (USD Million) By Applications (2023-2030)
Table 49 Middle East and Africa Bubble Tea Revenue (USD Million) By Region (2023-2030)
Table 50 Middle East and Africa Bubble Tea Revenue (USD Million) By Region (2023-2030)
Table 51 Middle East and Africa Bubble Tea Revenue (USD Million) By Type (2023-2030)
Table 52 Middle East and Africa Bubble Tea Revenue (USD Million) By Applications (2023-2030)
Table 53 Research Programs/Design for This Report
Table 54 Key Data Information from Secondary Sources
Table 55 Key Data Information from Primary Sources
List of Figures
Figure 1 Market Scope
Figure 2 Porter’s Five Forces
Figure 3 Global Bubble Tea Revenue (USD Million) By Type (2018-2022)
Figure 4 Global Bubble Tea Revenue Market Share (%) By Type (2022)
Figure 5 Global Bubble Tea Revenue (USD Million) By Applications (2018-2022)
Figure 6 Global Bubble Tea Revenue Market Share (%) By Applications (2022)
Figure 7 Global Bubble Tea Market Revenue (USD Million) By Regions (2018-2022)
Figure 8 Global Bubble Tea Market Share (%) By Regions (2022)
Figure 9 North America Bubble Tea Revenue (USD Million) By Country (2018-2022)
Figure 10 North America Bubble Tea Revenue (USD Million) By Type (2018-2022)
Figure 11 North America Bubble Tea Revenue (USD Million) By Applications (2018-2022)
Figure 12 Europe Bubble Tea Revenue (USD Million) By Country (2018-2022)
Figure 13 Europe Bubble Tea Revenue (USD Million) By Type (2018-2022)
Figure 14 Europe Bubble Tea Revenue (USD Million) By Applications (2018-2022)
Figure 15 Asia Pacific Bubble Tea Revenue (USD Million) By Country (2018-2022)
Figure 16 Asia Pacific Bubble Tea Revenue (USD Million) By Type (2018-2022)
Figure 17 Asia Pacific Bubble Tea Revenue (USD Million) By Applications (2018-2022)
Figure 18 South America Bubble Tea Revenue (USD Million) By Country (2018-2022)
Figure 19 South America Bubble Tea Revenue (USD Million) By Type (2018-2022)
Figure 20 South America Bubble Tea Revenue (USD Million) By Applications (2018-2022)
Figure 21 Middle East and Africa Bubble Tea Revenue (USD Million) By Region (2018-2022)
Figure 22 Middle East and Africa Bubble Tea Revenue (USD Million) By Type (2018-2022)
Figure 23 Middle East and Africa Bubble Tea Revenue (USD Million) By Applications (2018-2022)
Figure 24 Global Bubble Tea Revenue (USD Million) By Type (2023-2030)
Figure 25 Global Bubble Tea Revenue Market Share (%) By Type (2030)
Figure 26 Global Bubble Tea Revenue (USD Million) By Applications (2023-2030)
Figure 27 Global Bubble Tea Revenue Market Share (%) By Applications (2030)
Figure 28 Global Bubble Tea Market Revenue (USD Million) By Regions (2023-2030)
Figure 29 North America Bubble Tea Revenue (USD Million) By Country (2023-2030)
Figure 30 North America Bubble Tea Revenue (USD Million) By Type (2023-2030)
Figure 31 North America Bubble Tea Revenue (USD Million) By Applications (2023-2030)
Figure 32 Europe Bubble Tea Revenue (USD Million) By Country (2023-2030)
Figure 33 Europe Bubble Tea Revenue (USD Million) By Type (2023-2030)
Figure 34 Europe Bubble Tea Revenue (USD Million) By Applications (2023-2030)
Figure 35 Asia Pacific Bubble Tea Revenue (USD Million) By Country (2023-2030)
Figure 36 Asia Pacific Bubble Tea Revenue (USD Million) By Type (2023-2030)
Figure 37 Asia Pacific Bubble Tea Revenue (USD Million) By Applications (2023-2030)
Figure 38 South America Bubble Tea Revenue (USD Million) By Country (2023-2030)
Figure 39 South America Bubble Tea Revenue (USD Million) By Type (2023-2030)
Figure 40 South America Bubble Tea Revenue (USD Million) By Applications (2023-2030)
Figure 41 Middle East and Africa Bubble Tea Revenue (USD Million) By Region (2023-2030)
Figure 42 Middle East and Africa Bubble Tea Revenue (USD Million) By Region (2023-2030)
Figure 43 Middle East and Africa Bubble Tea Revenue (USD Million) By Type (2023-2030)
Figure 44 Middle East and Africa Bubble Tea Revenue (USD Million) By Applications (2023-2030)
Figure 45 Bottom-Up and Top-Down Approaches for This Report
Figure 46 Data Triangulation
