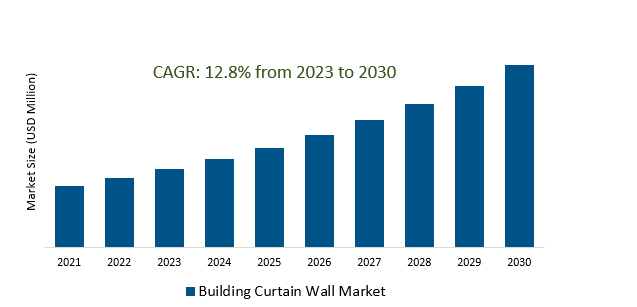
The Building Curtain Wall Market Size is estimated to register 12.8% growth over the forecast period from 2023 to 2030 .
Building Curtain Wall Market Overview
Urbanization and infrastructure expansion are fueling the demand for modern construction projects, propelling the widespread use of curtain wall systems. Architectural trends favoring innovative designs are contributing to the market growth for their design flexibility, enabling unique aesthetics in building facades. Builders and developers are increasingly focusing on high-performance building envelopes that include curtain walls with better thermal performance, weather resistance, and acoustic insulation. The use of BIM technology continues to grow, allowing for better collaboration, efficiency, and accuracy in designing, visualizing, and managing throughout the building lifecycle. Increasing concerns about safety and security are leading to the integration of specialized materials and designs to withstand environmental forces, such as wind loads and impact resistance, driving the market demand.
Building Curtain Wall Market Dynamics
Market Trends- Integration of eco-friendly materials, energy-efficient designs Building Curtain Wall Market.
Growing emphasis on energy efficient buildings that includes the integration of advanced glazing technologies, thermal breaks, and improved insulation to reduce heat transfer, thereby optimizing energy consumption for heating and cooling are increasing the demand.
Businesses are increasingly focusing on the entire lifecycle of curtain walls, including manufacturing, installation, maintenance, and eventual disposal.
Further, innovations in curtain wall designs involving the incorporation of renewable energy sources, like photovoltaic panels or solar shading systems, to generate clean energy while simultaneously providing functionality as part of the building envelope are fueling the demand.
Market Driver- Demand for Innovation and Integration of Building Envelopes as Experience Hubs.
The rising focus on enhancing user experiences within architectural spaces, prompting the integration of curtain walls not just for functional purposes but also as elements that create memorable and immersive experiences for occupants is the key factor.
Incorporation of interactive elements such as augmented reality (AR), integrated lighting, and smart glass technologies, which engage occupants and visitors, offering dynamic and personalized experiences are contributing to the market growth.
Further, the growing trend of mixed-use spaces, where buildings combine commercial, residential, and recreational areas, amplifies the importance of creating visually appealing are increasing the demand.
Market Opportunity - Emergence of Smart and Adaptable Curtain Walls.
Focus on enhancing indoor comfort levels for building occupants by regulating light penetration, temperature, and transparency are fueling the demand.
Rising demand for sustainable and energy-efficient building solutions, prompting the development of curtain walls that dynamically adapt to environmental conditions for reduced energy consumption.
Additionally, the rapid advancements in sensor technology, automation, and data analytics are driving the evolution of the market, thereby raising the revenue.
Market Share Analysis- Glass will register the fastest growth.
The Building Curtain Wall Market is analyzed across Glass, Stone, Metal & Others. Glass is poised to register the fastest growth. The Glass Curtain Wall Market represents a substantial facet of the construction industry, renowned for its multifaceted contributions to modern architecture. Renowned for its aesthetic allure, glass curtain walls offer architects unparalleled design flexibility, enabling the creation of visually striking and contemporary building exteriors. Beyond aesthetics, these walls facilitate the infusion of natural light into interior spaces, promoting energy efficiency and reducing reliance on artificial lighting during daylight hours. Recent advancements in glass technology have substantially bolstered the thermal performance of these walls, enhanced insulation and minimizing heat transfer, thereby contributing to reduced energy consumption. Additionally, the market's focus on sustainability is prompting the development of eco-friendly glass variants.
Market Share Analysis- Unitized held a significant market share in 2023.
The Building Curtain Wall Market is analyzed across various system types including Unitized & Stick. Of these, unitized held a significant market share in 2023. Comprising pre-assembled panels manufactured off-site under controlled factory conditions, the unitized system offers notable advantages over traditional stick-built systems. These prefabricated panels, consisting of framing, glazing, and other components, streamline the installation process, significantly reducing on-site labor requirements and construction time. Factory-controlled manufacturing ensures high-quality fabrication, precise assembly, and stringent quality checks, leading to superior performance and consistency in the installed system. Moreover, unitized curtain walls exhibit enhanced resistance to water infiltration and air leakage due to tighter seals achieved during factory assembly, contributing to improved building envelope performance and weatherproofing.
Building Curtain Wall Market Segmentation
By Type
By Application
- Commercial Building
- Residential Building
- Others
By System Type
By Region
- North America (United States, Canada, Mexico)
- Europe (Germany, France, United Kingdom, Spain, Italy, Others)
- Asia Pacific (China, India, Japan, South Korea, Australia, Others)
- Latin America (Brazil, Argentina, Others)
- Middle East and Africa (Saudi Arabia, UAE, Kuwait, Other Middle East, South Africa, Nigeria, Other Africa)
Building Curtain Wall Market Companies
- Far East Global Group (Hong Kong)
- Apogee Enterprises (United States)
- Capitol Aluminum & Glass Corp (United States)
- CMI Architectural Products (United States)
- Kawneer Company (United States)
- Permasteelisa (Italy)
- Manko Window Systems (United States)
- Oldcastle BuildingEnvelope (United States)
*List not exhaustive
Building Curtain Wall Market Outlook 2023
1 Market Overview
1.1 Introduction to the Building Curtain Wall Market
1.2 Scope of the Study
1.3 Research Objective
1.3.1 Key Market Scope and Segments
1.3.2 Players Covered
1.3.3 Years Considered
2 Executive Summary
2.1 2023 Building Curtain Wall Industry- Market Statistics
3 Market Dynamics
3.1 Market Drivers
3.2 Market Challenges
3.3 Market Opportunities
3.4 Market Trends
4 Market Factor Analysis
4.1 Porter’s Five Forces
4.2 Market Entropy
4.2.1 Global Building Curtain Wall Market Companies with Area Served
4.2.2 Products Offerings Global Building Curtain Wall Market
5 COVID-19 Impact Analysis and Outlook Scenarios
5.1.1 Covid-19 Impact Analysis
5.1.2 post-COVID-19 Scenario- Low Growth Case
5.1.3 post-COVID-19 Scenario- Reference Growth Case
5.1.4 post-COVID-19 Scenario- Low Growth Case
6 Global Building Curtain Wall Market Trends
6.1 Global Building Curtain Wall Revenue (USD Million) and CAGR (%) by Type (2018-2030)
6.2 Global Building Curtain Wall Revenue (USD Million) and CAGR (%) by Applications (2018-2030)
6.3 Global Building Curtain Wall Revenue (USD Million) and CAGR (%) by regions (2018-2030)
7 Global Building Curtain Wall Market Revenue (USD Million) by Type, and Applications (2018-2022)
7.1 Global Building Curtain Wall Revenue (USD Million) by Type (2018-2022)
7.1.1 Global Building Curtain Wall Revenue (USD Million), Market Share (%) by Type (2018-2022)
7.2 Global Building Curtain Wall Revenue (USD Million) by Applications (2018-2022)
7.2.1 Global Building Curtain Wall Revenue (USD Million), Market Share (%) by Applications (2018-2022)
8 Global Building Curtain Wall Development Regional Status and Outlook
8.1 Global Building Curtain Wall Revenue (USD Million) By Regions (2018-2022)
8.2 North America Building Curtain Wall Revenue (USD Million) by Type, and Application (2018-2022)
8.2.1 North America Building Curtain Wall Revenue (USD Million) by Country (2018-2022)
8.2.2 North America Building Curtain Wall Revenue (USD Million) by Type (2018-2022)
8.2.3 North America Building Curtain Wall Revenue (USD Million) by Applications (2018-2022)
8.3 Europe Building Curtain Wall Revenue (USD Million), by Type, and Applications (USD Million) (2018-2022)
8.3.1 Europe Building Curtain Wall Revenue (USD Million), by Country (2018-2022)
8.3.2 Europe Building Curtain Wall Revenue (USD Million) by Type (2018-2022)
8.3.3 Europe Building Curtain Wall Revenue (USD Million) by Applications (2018-2022)
8.4 Asia Pacific Building Curtain Wall Revenue (USD Million), and Revenue (USD Million) by Type, and Applications (2018-2022)
8.4.1 Asia Pacific Building Curtain Wall Revenue (USD Million) by Country (2018-2022)
8.4.2 Asia Pacific Building Curtain Wall Revenue (USD Million) by Type (2018-2022)
8.4.3 Asia Pacific Building Curtain Wall Revenue (USD Million) by Applications (2018-2022)
8.5 South America Building Curtain Wall Revenue (USD Million), by Type, and Applications (2018-2022)
8.5.1 South America Building Curtain Wall Revenue (USD Million), by Country (2018-2022)
8.5.2 South America Building Curtain Wall Revenue (USD Million) by Type (2018-2022)
8.5.3 South America Building Curtain Wall Revenue (USD Million) by Applications (2018-2022)
8.6 Middle East and Africa Building Curtain Wall Revenue (USD Million), by Type, Technology, Application, Thickness (2018-2022)
8.6.1 Middle East and Africa Building Curtain Wall Revenue (USD Million) by Country (2018-2022)
8.6.2 Middle East and Africa Building Curtain Wall Revenue (USD Million) by Type (2018-2022)
8.6.3 Middle East and Africa Building Curtain Wall Revenue (USD Million) by Applications (2018-2022)
9 Company Profiles
10 Global Building Curtain Wall Market Revenue (USD Million), by Type, and Applications (2023-2030)
10.1 Global Building Curtain Wall Revenue (USD Million) and Market Share (%) by Type (2023-2030)
10.1.1 Global Building Curtain Wall Revenue (USD Million), and Market Share (%) by Type (2023-2030)
10.2 Global Building Curtain Wall Revenue (USD Million) and Market Share (%) by Applications (2023-2030)
10.2.1 Global Building Curtain Wall Revenue (USD Million), and Market Share (%) by Applications (2023-2030)
11 Global Building Curtain Wall Development Regional Status and Outlook Forecast
11.1 Global Building Curtain Wall Revenue (USD Million) By Regions (2023-2030)
11.2 North America Building Curtain Wall Revenue (USD Million) by Type, and Applications (2023-2030)
11.2.1 North America Building Curtain Wall Revenue (USD) Million by Country (2023-2030)
11.2.2 North America Building Curtain Wall Revenue (USD Million), by Type (2023-2030)
11.2.3 North America Building Curtain Wall Revenue (USD Million), Market Share (%) by Applications (2023-2030)
11.3 Europe Building Curtain Wall Revenue (USD Million), by Type, and Applications (2023-2030)
11.3.1 Europe Building Curtain Wall Revenue (USD Million), by Country (2023-2030)
11.3.2 Europe Building Curtain Wall Revenue (USD Million), by Type (2023-2030)
11.3.3 Europe Building Curtain Wall Revenue (USD Million), by Applications (2023-2030)
11.4 Asia Pacific Building Curtain Wall Revenue (USD Million) by Type, and Applications (2023-2030)
11.4.1 Asia Pacific Building Curtain Wall Revenue (USD Million), by Country (2023-2030)
11.4.2 Asia Pacific Building Curtain Wall Revenue (USD Million), by Type (2023-2030)
11.4.3 Asia Pacific Building Curtain Wall Revenue (USD Million), by Applications (2023-2030)
11.5 South America Building Curtain Wall Revenue (USD Million), by Type, and Applications (2023-2030)
11.5.1 South America Building Curtain Wall Revenue (USD Million), by Country (2023-2030)
11.5.2 South America Building Curtain Wall Revenue (USD Million), by Type (2023-2030)
11.5.3 South America Building Curtain Wall Revenue (USD Million), by Applications (2023-2030)
11.6 Middle East and Africa Building Curtain Wall Revenue (USD Million), by Type, and Applications (2023-2030)
11.6.1 Middle East and Africa Building Curtain Wall Revenue (USD Million), by region (2023-2030)
11.6.2 Middle East and Africa Building Curtain Wall Revenue (USD Million), by Type (2023-2030)
11.6.3 Middle East and Africa Building Curtain Wall Revenue (USD Million), by Applications (2023-2030)
12 Methodology and Data Sources
12.1 Methodology/Research Approach
12.1.1 Research Programs/Design
12.1.2 Market Size Estimation
12.1.3 Market Breakdown and Data Triangulation
12.2 Data Sources
12.2.1 Secondary Sources
12.2.2 Primary Sources
12.3 Disclaimer
List of Tables
Table 1 Market Segmentation Analysis
Table 2 Global Building Curtain Wall Market Companies with Areas Served
Table 3 Products Offerings Global Building Curtain Wall Market
Table 4 Low Growth Scenario Forecasts
Table 5 Reference Case Growth Scenario
Table 6 High Growth Case Scenario
Table 7 Global Building Curtain Wall Revenue (USD Million) And CAGR (%) By Type (2018-2030)
Table 8 Global Building Curtain Wall Revenue (USD Million) And CAGR (%) By Applications (2018-2030)
Table 9 Global Building Curtain Wall Revenue (USD Million) And CAGR (%) By Regions (2018-2030)
Table 10 Global Building Curtain Wall Revenue (USD Million) By Type (2018-2022)
Table 11 Global Building Curtain Wall Revenue Market Share (%) By Type (2018-2022)
Table 12 Global Building Curtain Wall Revenue (USD Million) By Applications (2018-2022)
Table 13 Global Building Curtain Wall Revenue Market Share (%) By Applications (2018-2022)
Table 14 Global Building Curtain Wall Market Revenue (USD Million) By Regions (2018-2022)
Table 15 Global Building Curtain Wall Market Share (%) By Regions (2018-2022)
Table 16 North America Building Curtain Wall Revenue (USD Million) By Country (2018-2022)
Table 17 North America Building Curtain Wall Revenue (USD Million) By Type (2018-2022)
Table 18 North America Building Curtain Wall Revenue (USD Million) By Applications (2018-2022)
Table 19 Europe Building Curtain Wall Revenue (USD Million) By Country (2018-2022)
Table 20 Europe Building Curtain Wall Revenue (USD Million) By Type (2018-2022)
Table 21 Europe Building Curtain Wall Revenue (USD Million) By Applications (2018-2022)
Table 22 Asia Pacific Building Curtain Wall Revenue (USD Million) By Country (2018-2022)
Table 23 Asia Pacific Building Curtain Wall Revenue (USD Million) By Type (2018-2022)
Table 24 Asia Pacific Building Curtain Wall Revenue (USD Million) By Applications (2018-2022)
Table 25 South America Building Curtain Wall Revenue (USD Million) By Country (2018-2022)
Table 26 South America Building Curtain Wall Revenue (USD Million) By Type (2018-2022)
Table 27 South America Building Curtain Wall Revenue (USD Million) By Applications (2018-2022)
Table 28 Middle East and Africa Building Curtain Wall Revenue (USD Million) By Region (2018-2022)
Table 29 Middle East and Africa Building Curtain Wall Revenue (USD Million) By Type (2018-2022)
Table 30 Middle East and Africa Building Curtain Wall Revenue (USD Million) By Applications (2018-2022)
Table 31 Financial Analysis
Table 32 Global Building Curtain Wall Revenue (USD Million) By Type (2023-2030)
Table 33 Global Building Curtain Wall Revenue Market Share (%) By Type (2023-2030)
Table 34 Global Building Curtain Wall Revenue (USD Million) By Applications (2023-2030)
Table 35 Global Building Curtain Wall Revenue Market Share (%) By Applications (2023-2030)
Table 36 Global Building Curtain Wall Market Revenue (USD Million), And Revenue (USD Million) By Regions (2023-2030)
Table 37 North America Building Curtain Wall Revenue (USD)By Country (2023-2030)
Table 38 North America Building Curtain Wall Revenue (USD Million) By Type (2023-2030)
Table 39 North America Building Curtain Wall Revenue (USD Million) By Applications (2023-2030)
Table 40 Europe Building Curtain Wall Revenue (USD Million) By Country (2023-2030)
Table 41 Europe Building Curtain Wall Revenue (USD Million) By Type (2023-2030)
Table 42 Europe Building Curtain Wall Revenue (USD Million) By Applications (2023-2030)
Table 43 Asia Pacific Building Curtain Wall Revenue (USD Million) By Country (2023-2030)
Table 44 Asia Pacific Building Curtain Wall Revenue (USD Million) By Type (2023-2030)
Table 45 Asia Pacific Building Curtain Wall Revenue (USD Million) By Applications (2023-2030)
Table 46 South America Building Curtain Wall Revenue (USD Million) By Country (2023-2030)
Table 47 South America Building Curtain Wall Revenue (USD Million) By Type (2023-2030)
Table 48 South America Building Curtain Wall Revenue (USD Million) By Applications (2023-2030)
Table 49 Middle East and Africa Building Curtain Wall Revenue (USD Million) By Region (2023-2030)
Table 50 Middle East and Africa Building Curtain Wall Revenue (USD Million) By Region (2023-2030)
Table 51 Middle East and Africa Building Curtain Wall Revenue (USD Million) By Type (2023-2030)
Table 52 Middle East and Africa Building Curtain Wall Revenue (USD Million) By Applications (2023-2030)
Table 53 Research Programs/Design for This Report
Table 54 Key Data Information from Secondary Sources
Table 55 Key Data Information from Primary Sources
List of Figures
Figure 1 Market Scope
Figure 2 Porter’s Five Forces
Figure 3 Global Building Curtain Wall Revenue (USD Million) By Type (2018-2022)
Figure 4 Global Building Curtain Wall Revenue Market Share (%) By Type (2022)
Figure 5 Global Building Curtain Wall Revenue (USD Million) By Applications (2018-2022)
Figure 6 Global Building Curtain Wall Revenue Market Share (%) By Applications (2022)
Figure 7 Global Building Curtain Wall Market Revenue (USD Million) By Regions (2018-2022)
Figure 8 Global Building Curtain Wall Market Share (%) By Regions (2022)
Figure 9 North America Building Curtain Wall Revenue (USD Million) By Country (2018-2022)
Figure 10 North America Building Curtain Wall Revenue (USD Million) By Type (2018-2022)
Figure 11 North America Building Curtain Wall Revenue (USD Million) By Applications (2018-2022)
Figure 12 Europe Building Curtain Wall Revenue (USD Million) By Country (2018-2022)
Figure 13 Europe Building Curtain Wall Revenue (USD Million) By Type (2018-2022)
Figure 14 Europe Building Curtain Wall Revenue (USD Million) By Applications (2018-2022)
Figure 15 Asia Pacific Building Curtain Wall Revenue (USD Million) By Country (2018-2022)
Figure 16 Asia Pacific Building Curtain Wall Revenue (USD Million) By Type (2018-2022)
Figure 17 Asia Pacific Building Curtain Wall Revenue (USD Million) By Applications (2018-2022)
Figure 18 South America Building Curtain Wall Revenue (USD Million) By Country (2018-2022)
Figure 19 South America Building Curtain Wall Revenue (USD Million) By Type (2018-2022)
Figure 20 South America Building Curtain Wall Revenue (USD Million) By Applications (2018-2022)
Figure 21 Middle East and Africa Building Curtain Wall Revenue (USD Million) By Region (2018-2022)
Figure 22 Middle East and Africa Building Curtain Wall Revenue (USD Million) By Type (2018-2022)
Figure 23 Middle East and Africa Building Curtain Wall Revenue (USD Million) By Applications (2018-2022)
Figure 24 Global Building Curtain Wall Revenue (USD Million) By Type (2023-2030)
Figure 25 Global Building Curtain Wall Revenue Market Share (%) By Type (2030)
Figure 26 Global Building Curtain Wall Revenue (USD Million) By Applications (2023-2030)
Figure 27 Global Building Curtain Wall Revenue Market Share (%) By Applications (2030)
Figure 28 Global Building Curtain Wall Market Revenue (USD Million) By Regions (2023-2030)
Figure 29 North America Building Curtain Wall Revenue (USD Million) By Country (2023-2030)
Figure 30 North America Building Curtain Wall Revenue (USD Million) By Type (2023-2030)
Figure 31 North America Building Curtain Wall Revenue (USD Million) By Applications (2023-2030)
Figure 32 Europe Building Curtain Wall Revenue (USD Million) By Country (2023-2030)
Figure 33 Europe Building Curtain Wall Revenue (USD Million) By Type (2023-2030)
Figure 34 Europe Building Curtain Wall Revenue (USD Million) By Applications (2023-2030)
Figure 35 Asia Pacific Building Curtain Wall Revenue (USD Million) By Country (2023-2030)
Figure 36 Asia Pacific Building Curtain Wall Revenue (USD Million) By Type (2023-2030)
Figure 37 Asia Pacific Building Curtain Wall Revenue (USD Million) By Applications (2023-2030)
Figure 38 South America Building Curtain Wall Revenue (USD Million) By Country (2023-2030)
Figure 39 South America Building Curtain Wall Revenue (USD Million) By Type (2023-2030)
Figure 40 South America Building Curtain Wall Revenue (USD Million) By Applications (2023-2030)
Figure 41 Middle East and Africa Building Curtain Wall Revenue (USD Million) By Region (2023-2030)
Figure 42 Middle East and Africa Building Curtain Wall Revenue (USD Million) By Region (2023-2030)
Figure 43 Middle East and Africa Building Curtain Wall Revenue (USD Million) By Type (2023-2030)
Figure 44 Middle East and Africa Building Curtain Wall Revenue (USD Million) By Applications (2023-2030)
Figure 45 Bottom-Up and Top-Down Approaches for This Report
Figure 46 Data Triangulation
