<h3><Strong><i>Global Bulk Salt Market Size is valued at $4.8 Billion in 2024 and is forecast to register a growth rate (CAGR) of 2.8% to reach $6 Billion by 2032.</h3></Strong></i>The global Bulk Salt Market Comprehensive Study analyzes and forecasts the market size across 6 regions and 24 countries for diverse segments -By Type (Rock Salt, Solar Salt, Evaporative salt), By Application (Chemical, De-Icing, General Industrial, Agricultural, Water Treatment, Others)
<h2>An Introduction to Bulk Salt Market</h2>The Bulk Salt market in 2024 is expanding steadily, driven by the essential role of salt in food processing, preservation, and seasoning. Bulk salt, available in various forms such as table salt, kosher salt, and sea salt, is used in a wide range of industrial and culinary applications. The market is supported by the growing demand for processed and packaged foods. Advances in mining and purification technologies are enhancing the quality and purity of bulk salt. The market is also benefiting from the trend towards natural and specialty salts, such as Himalayan pink salt and fleur de sel, which are valued for their unique flavor profiles and mineral content.
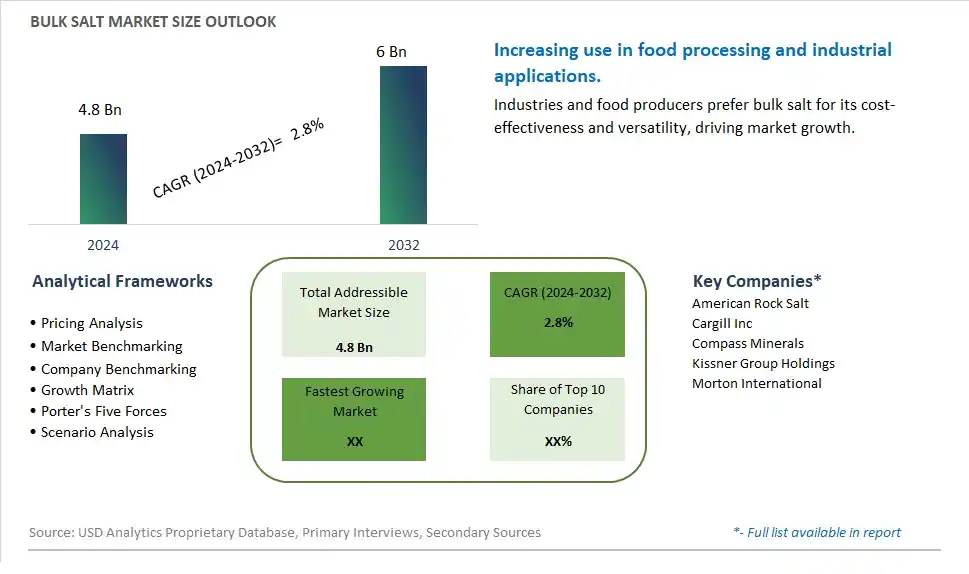
<h2>Bulk Salt Competitive Landscape</h2>The market report analyses the leading companies in the industry including American Rock Salt, Cargill Inc, Compass Minerals, Kissner Group Holdings, Morton International, and Others.<h2>Bulk Salt Market Dynamics</h2><h3>Bulk Salt Market Trend: Growing Demand for Natural and Specialty Salts</h3>One prominent market trend for Bulk Salt is the increasing demand for natural and specialty salts. Consumers are becoming more health-conscious and are seeking alternatives to traditional table salt. This trend is driven by the perception that natural salts offer additional health benefits and unique flavors compared to refined table salt. Specialty salts such as Himalayan pink salt, sea salt, and kosher salt are gaining popularity due to their distinct mineral content and culinary applications, leading to a rising demand for bulk quantities of these salts.<h3>Bulk Salt Market Driver: Expansion in Food Processing and Industrial Applications</h3>The market driver for Bulk Salt is the expansion in food processing and industrial applications. Salt is a crucial ingredient in various food products, including processed foods, snacks, bakery items, and meat products. Additionally, salt is used extensively in industrial processes such as water treatment, chemical manufacturing, and de-icing applications. The growth of these industries drives the demand for bulk quantities of salt, both for food-grade and industrial-grade purposes.<h3>Bulk Salt Market Opportunity: Diversification into Value-Added Salt Products</h3>An opportunity within the Bulk Salt market lies in diversifying into value-added salt products. Manufacturers and suppliers can explore opportunities to offer value-added salt products such as flavored salts, infused salts, and salt blends tailored for specific culinary uses. These value-added products cater to consumer preferences for gourmet cooking, culinary creativity, and healthier alternatives. Additionally, targeting niche markets such as the health and wellness sector with low-sodium or mineral-enriched salt options can open up new avenues for growth and market penetration within the Bulk Salt segment.<h3>Bulk Salt Market Share Analysis: Rock Salt segment generated the highest revenue share in the industry</h3>The Rock Salt segment is the largest within the Bulk Salt Market, holding a significant share of the market. This segment's dominance can be attributed to several key factors driving its growth and widespread usage. Rock salt, also known as halite, is a naturally occurring mineral primarily composed of sodium chloride. It is commonly mined from underground deposits or extracted from salt domes and is widely utilized across various industries and applications. One of the primary reasons for the Rock Salt segment's prominence is its extensive use in the chemical industry for manufacturing chlorine, sodium hydroxide, and other industrial chemicals. Additionally, rock salt is a vital raw material in the production of water softeners, de-icing agents, road salts, and agricultural fertilizers, contributing to its high demand and consumption. Further, rock salt is valued for its purity, crystalline structure, and cost-effectiveness compared to other types of bulk salts, making it a preferred choice for many industrial and commercial applications. Furthermore, the growing awareness of environmental sustainability and the shift towards natural and eco-friendly alternatives have further boosted the demand for rock salt, particularly in the de-icing and water treatment sectors. As a result, suppliers, manufacturers, and distributors in the Bulk Salt Market focus on enhancing their rock salt offerings, ensuring product quality, and expanding their market presence to meet the diverse needs of industries and consumers relying on rock salt for various purposes.<h3>Bulk Salt Market Share Analysis: De-Icing Application is the fastest growing segment over the forecast period to 2032</h3>The De-Icing Application segment within the Bulk Salt Market is experiencing rapid growth and is projected to continue expanding significantly until 2032. This segment's fast growth can be attributed to several key factors driving market dynamics and demand. Firstly, de-icing salt, primarily composed of sodium chloride, is widely utilized for snow and ice removal on roads, highways, sidewalks, airports, and other transportation infrastructure during winter seasons. The increasing occurrences of extreme weather events, including snowstorms and freezing temperatures, necessitate efficient de-icing measures to ensure safe and smooth transportation operations. Consequently, the demand for bulk salt for de-icing purposes has surged, especially in regions prone to harsh winter conditions. Further, the adoption of de-icing salt by municipal authorities, transportation agencies, and private contractors has increased to mitigate the risks of accidents, traffic disruptions, and infrastructure damage caused by ice and snow accumulation. Additionally, advancements in de-icing technologies, equipment, and application methods have further propelled the growth of the De-Icing Application segment, enhancing the effectiveness and efficiency of salt-based de-icing practices. Furthermore, the emphasis on sustainable de-icing solutions, environmental regulations, and eco-friendly alternatives has led to the development of low-corrosion and environmentally safe de-icing salts, driving their adoption in the market. As a result, suppliers and manufacturers in the Bulk Salt Market are focusing on catering to the rising demand for de-icing salts, optimizing production capacities, and innovating new formulations to address the evolving needs of the de-icing industry and ensure safe winter mobility.<h2>Bulk Salt Market Segmentation</h2><Strong>By Type</Strong>
Rock Salt
Solar Salt
Evaporative salt
<Strong>By Application</Strong>
Chemical
De-Icing
General Industrial
Agricultural
Water Treatment
Others
<Strong>Countries Analyzed</Strong>
North America (US, Canada, Mexico)
Europe (Germany, UK, France, Spain, Italy, Russia, Rest of Europe)
Asia Pacific (China, India, Japan, South Korea, Australia, South East Asia, Rest of Asia)
South America (Brazil, Argentina, Rest of South America)
Middle East and Africa (Saudi Arabia, UAE, Rest of Middle East, South Africa, Egypt, Rest of Africa)<h2>Bulk Salt Companies Profiled in the Study</h2>American Rock Salt
Cargill Inc
Compass Minerals
Kissner Group Holdings
Morton International
*- List Not Exhaustive
<Strong>Chapter 1. TABLE OF CONTENTS</Strong>
<Strong>Chapter 2. Introduction to Bulk Salt Market </Strong>
2.1. Market Overview
2.2. Key Statistics and Report Highlights
2.3. Scope of the Comprehensive Study
2.3.1. Market Definition
2.3.2 Countries and Regions Covered
2.3.3 Research Objective
2.3.4 Units, Currency, and Conversions
2.3.5 Industry Value Chain
2.4. Key Market Segments
2.5. Key Companies
2.6. Study Period
<Strong>Chapter 3. Strategic Analysis Review</Strong>
3.1. Bulk Salt Pricing Analysis and Forecast
3.2. Porter’s Five Forces
3.3. Market Ecosystem
3.4. SWOT Analysis
3.5. Regulatory Scenario
3.3. Effects of Inflation, Russia-Ukraine War, moderating economic growth, and other macroeconomic factors
<Strong>Chapter 4. Competitive Landscape</Strong>
4.1. Market Share Analysis
4.1.1. Global Bulk Salt Market Share by Company, 2023
4.1.2. Product Offerings of Leading Bulk Salt Companies
4.2. Market Entropy
4.2.1. New Product Launches in the Industry
4.2.2. Mergers, Acquisitions, Joint ventures, and Partnerships
4.3. Key Strategies and Best Practices
<Strong>Chapter 5. Global Market Projections: Best, Reference, and Low Case Scenarios</Strong>
5.1. Growth Analysis- Case Scenario Definitions
5.2. Low Growth Case Scenario Forecasts
5.3. Reference Growth Case Scenario Forecasts
5.4. High Growth Case Scenario Forecasts
<Strong>Chapter 6. Market Dynamics</Strong>
6.1. Bulk Salt Market Drivers
6.2. Bulk Salt Market Challenges
6.6. Bulk Salt Market Opportunities
6.4. Bulk Salt Market Trends
<Strong>Chapter 7. Global Bulk Salt Market Outlook Trends</Strong>
7.1. Global Bulk Salt Revenue (USD Million) and CAGR (%) by Type (2021-2032)
7.2. Global Bulk Salt Revenue (USD Million) and CAGR (%) by Application (2021-2032)
7.3. Global Bulk Salt Revenue (USD Million) and CAGR (%) by Product (2021-2032)
<Strong>By Type</Strong>
Rock Salt
Solar Salt
Evaporative salt
<Strong>By Application</Strong>
Chemical
De-Icing
General Industrial
Agricultural
Water Treatment
Others
<Strong>Chapter 8. Global Bulk Salt Regional Analysis and Outlook</Strong>
8.1. Global Bulk Salt Revenue (USD Million) By Regions (2021- 2032)
8.2. North America Bulk Salt Revenue (USD Million) by Country (2021-2032)
8.2.1. United States Bulk Salt Regional Analysis and Outlook
8.2.2. Canada Bulk Salt Regional Analysis and Outlook
8.2.3. Mexico Bulk Salt Regional Analysis and Outlook
8.3. Europe Bulk Salt Revenue (USD Million), by Country (2021-2032)
8.3.1. Germany Bulk Salt Regional Analysis and Outlook
8.3.2. France Bulk Salt Regional Analysis and Outlook
8.3.3. United Kingdom Bulk Salt Regional Analysis and Outlook
8.3.4. Spain Bulk Salt Regional Analysis and Outlook
8.3.5. Italy Bulk Salt Regional Analysis and Outlook
8.3.6. Russia Bulk Salt Regional Analysis and Outlook
8.3.7. Rest of Europe Bulk Salt Regional Analysis and Outlook
8.4. Asia Pacific Bulk Salt Revenue (USD Million) by Country (2021-2032)
8.4.1. China Bulk Salt Regional Analysis and Outlook
8.4.2. Japan Bulk Salt Regional Analysis and Outlook
8.4.3. India Bulk Salt Regional Analysis and Outlook
8.4.4. South Korea Bulk Salt Regional Analysis and Outlook
8.4.5. Australia Bulk Salt Regional Analysis and Outlook
8.4.6. South East Asia Bulk Salt Regional Analysis and Outlook
8.4.7. Rest of Asia Pacific Bulk Salt Regional Analysis and Outlook
8.5. South America Bulk Salt Revenue (USD Million), by Country (2021-2032)
8.5.1. Brazil Bulk Salt Regional Analysis and Outlook
8.5.2. Argentina Bulk Salt Regional Analysis and Outlook
8.5.3. Rest of South America Bulk Salt Regional Analysis and Outlook
8.6. Middle East and Africa Bulk Salt Revenue (USD Million) by Country (2021-2032)
8.6.1. Middle East Bulk Salt Regional Analysis and Outlook
8.6.2. Africa Bulk Salt Regional Analysis and Outlook
<Strong>Chapter 9. North America Bulk Salt Analysis and Outlook</Strong>
9.1. North America Bulk Salt Revenue (USD Million) by Segments (2021-2032)
9.1.1. North America Bulk Salt Revenue (USD Million) by Type (2021-2032)
9.1.2. North America Bulk Salt Revenue (USD Million) by Application (2021-2032)
9.1.3. North America Bulk Salt Revenue (USD Million) by Product (2021-2032)
<Strong>By Type</Strong>
Rock Salt
Solar Salt
Evaporative salt
<Strong>By Application</Strong>
Chemical
De-Icing
General Industrial
Agricultural
Water Treatment
Others
<Strong>Chapter 10. Europe Bulk Salt Analysis and Outlook</Strong>
10.1. Europe Bulk Salt Revenue (USD Million), by Segments (USD Million) (2021-2032)
10.1.1. Europe Bulk Salt Revenue (USD Million) by Type (2021-2032)
10.1.2. Europe Bulk Salt Revenue (USD Million) by Application (2021-2032)
10.1.3. Europe Bulk Salt Revenue (USD Million) by Product (2021-2032)
<Strong>By Type</Strong>
Rock Salt
Solar Salt
Evaporative salt
<Strong>By Application</Strong>
Chemical
De-Icing
General Industrial
Agricultural
Water Treatment
Others
<Strong>Chapter 11. Asia Pacific Bulk Salt Analysis and Outlook</Strong>
11.1. Asia Pacific Bulk Salt Revenue (USD Million), and Revenue (USD Million) by Segments (2021-2032)
11.1.1. Asia Pacific Bulk Salt Revenue (USD Million) by Type (2021-2032)
11.1.2. Asia Pacific Bulk Salt Revenue (USD Million) by Application (2021-2032)
11.1.3. Asia Pacific Bulk Salt Revenue (USD Million) by Product (2021-2032)
<Strong>By Type</Strong>
Rock Salt
Solar Salt
Evaporative salt
<Strong>By Application</Strong>
Chemical
De-Icing
General Industrial
Agricultural
Water Treatment
Others
<Strong>Chapter 12. South America Bulk Salt Analysis and Outlook</Strong>
12.1. South America Bulk Salt Revenue (USD Million), by Segments (2021-2032)
12.1.1. South America Bulk Salt Revenue (USD Million) by Type (2021-2032)
12.1.2. South America Bulk Salt Revenue (USD Million) by Application (2021-2032)
12.1.3. South America Bulk Salt Revenue (USD Million) by Product (2021-2032)
<Strong>By Type</Strong>
Rock Salt
Solar Salt
Evaporative salt
<Strong>By Application</Strong>
Chemical
De-Icing
General Industrial
Agricultural
Water Treatment
Others
<Strong>Chapter 13. Middle East and Africa Bulk Salt Analysis and Outlook</Strong>
13.1. Middle East and Africa Bulk Salt Revenue (USD Million), by Segments (2021-2032)
13.1.1. Middle East and Africa Bulk Salt Revenue (USD Million) by Type (2021-2032)
13.1.2. Middle East and Africa Bulk Salt Revenue (USD Million) by Application (2021-2032)
13.1.3. Middle East and Africa Bulk Salt Revenue (USD Million) by Product (2021-2032)
<Strong>By Type</Strong>
Rock Salt
Solar Salt
Evaporative salt
<Strong>By Application</Strong>
Chemical
De-Icing
General Industrial
Agricultural
Water Treatment
Others
<Strong>Chapter 14. Bulk Salt Company Profiles</Strong>
14.1 Business Overview
14.2 Product Profiles
14.3 SWOT Profiles
14.5 Recent Developments
14.6 Financial Profile
List of Companies
American Rock Salt
Cargill Inc
Compass Minerals
Kissner Group Holdings
Morton International
<Strong>15. Methodology and Data Sources</Strong>
15.1 Customization Offerings
15.2 Subscription Services
15.3 Related Reports
15.4 Publisher Expertise
<Strong>LIST OF TABLES</Strong>
Table 1 Market Segmentation Analysis
Table 2 Global Bulk Salt Market Share of Leading Companies, 2023
Table 3 Product Offerings of Leading Companies
Table 4 Low Growth Scenario Forecasts
Table 5 Reference Case Growth Scenario
Table 6 High Growth Case Scenario
Table 7 Global Bulk Salt Revenue (USD Million) And CAGR (%) By Type (2021-2032)
Table 8 Global Bulk Salt Revenue (USD Million) And CAGR (%) By Application (2021-2032)
Table 9 Global Bulk Salt Revenue (USD Million) And CAGR (%) By Product (2021-2032)
Table 10 Global Bulk Salt Market Revenue (USD Million) By Regions (2021-2032)
Table 11 Global Bulk Salt Market Share (%) By Regions (2021-2032)
Table 12 North America Bulk Salt Revenue (USD Million) By Country (2021-2032)
Table 13 Europe Bulk Salt Revenue (USD Million) By Country (2021-2032)
Table 14 Asia Pacific Bulk Salt Revenue (USD Million) By Country (2021-2032)
Table 15 South America Bulk Salt Revenue (USD Million) By Country (2021-2032)
Table 16 Middle East and Africa Bulk Salt Revenue (USD Million) By Region (2021-2032)
Table 17 North America Bulk Salt Revenue (USD Million) By Type (2021-2032)
Table 18 North America Bulk Salt Revenue (USD Million) By Application (2021-2032)
Table 19 North America Bulk Salt Revenue (USD Million) By Product (2021-2032)
Table 20 Europe Bulk Salt Revenue (USD Million) By Type (2021-2032)
Table 21 Europe Bulk Salt Revenue (USD Million) By Application (2021-2032)
Table 22 Europe Bulk Salt Revenue (USD Million) By Product (2021-2032)
Table 23 Asia Pacific Bulk Salt Revenue (USD Million) By Type (2021-2032)
Table 24 Asia Pacific Bulk Salt Revenue (USD Million) By Application (2021-2032)
Table 25 Asia Pacific Bulk Salt Revenue (USD Million) By Product (2021-2032)
Table 26 South America Bulk Salt Revenue (USD Million) By Type (2021-2032)
Table 27 South America Bulk Salt Revenue (USD Million) By Application (2021-2032)
Table 28 South America Bulk Salt Revenue (USD Million) By Product (2021-2032)
Table 29 Middle East and Africa Bulk Salt Revenue (USD Million) By Type (2021-2032)
Table 30 Middle East and Africa Bulk Salt Revenue (USD Million) By Application (2021-2032)
Table 31 Middle East and Africa Bulk Salt Revenue (USD Million) By Product (2021-2032)
<Strong>LIST OF FIGURES</Strong>
Figure 1. Market Scope
Figure 2. Pricing Forecasts Per Unit, 2023- 2032
Figure 3. Porter’s Five Forces
Figure 4. Global Bulk Salt Market Revenue (USD Million) By Regions (2021-2032)
Figure 5. Global Bulk Salt Market Share (%) By Regions (2023)
Figure 6. North America Bulk Salt Revenue (USD Million) By Country (2021-2032)
Figure 7. United States Bulk Salt Revenue (USD Million) By Country (2021-2032)
Figure 8. Canada Bulk Salt Revenue (USD Million) By Country (2021-2032)
Figure 9. Mexico Bulk Salt Revenue (USD Million) By Country (2021-2032)
Figure 10. Europe Bulk Salt Revenue (USD Million) By Country (2021-2032)
Figure 11. Germany Bulk Salt Revenue (USD Million) By Country (2021-2032)
Figure 12. France Bulk Salt Revenue (USD Million) By Country (2021-2032)
Figure 13. United Kingdom Bulk Salt Revenue (USD Million) By Country (2021-2032)
Figure 14. Spain Bulk Salt Revenue (USD Million) By Country (2021-2032)
Figure 15. Italy Bulk Salt Revenue (USD Million) By Country (2021-2032)
Figure 16. Russia Bulk Salt Revenue (USD Million) By Country (2021-2032)
Figure 17. Rest of Europe Bulk Salt Revenue (USD Million) By Country (2021-2032)
Figure 11. Asia Pacific Bulk Salt Revenue (USD Million) By Country (2021-2032)
Figure 12. China Bulk Salt Revenue (USD Million) By Country (2021-2032)
Figure 13. Japan Bulk Salt Revenue (USD Million) By Country (2021-2032)
Figure 14. India Bulk Salt Revenue (USD Million) By Country (2021-2032)
Figure 15. South Korea Bulk Salt Revenue (USD Million) By Country (2021-2032)
Figure 16. Australia Bulk Salt Revenue (USD Million) By Country (2021-2032)
Figure 17. South East Asia Bulk Salt Revenue (USD Million) By Country (2021-2032)
Figure 18. South America Bulk Salt Revenue (USD Million) By Country (2021-2032)
Figure 19. Brazil Bulk Salt Revenue (USD Million) By Country (2021-2032)
Figure 20. Argentina Bulk Salt Revenue (USD Million) By Country (2021-2032)
Figure 21. Rest of Asia Pacific Bulk Salt Revenue (USD Million) By Country (2021-2032)
Figure 22. Middle East and Africa Bulk Salt Revenue (USD Million) By Region (2021-2032)
Figure 23. Saudi Arabia Bulk Salt Revenue (USD Million) By Region (2021-2032)
Figure 24. The UAE Bulk Salt Revenue (USD Million) By Region (2021-2032)
Figure 25. Rest of Middle East Bulk Salt Revenue (USD Million) By Region (2021-2032)
Figure 26. South Africa Bulk Salt Revenue (USD Million) By Region (2021-2032)
Figure 27. Africa Bulk Salt Revenue (USD Million) By Region (2021-2032)
Figure 28. North America Bulk Salt Revenue (USD Million) By Type (2021-2032)
Figure 29. North America Bulk Salt Revenue (USD Million) By Application (2021-2032)
Figure 30. North America Bulk Salt Revenue (USD Million) By Product (2021-2032)
Figure 31. Europe Bulk Salt Revenue (USD Million) By Type (2021-2032)
Figure 32. Europe Bulk Salt Revenue (USD Million) By Application (2021-2032)
Figure 33. Europe Bulk Salt Revenue (USD Million) By Product (2021-2032)
Figure 34. Asia Pacific Bulk Salt Revenue (USD Million) By Type (2021-2032)
Figure 35. Asia Pacific Bulk Salt Revenue (USD Million) By Application (2021-2032)
Figure 36. Asia Pacific Bulk Salt Revenue (USD Million) By Product (2021-2032)
Figure 37. South America Bulk Salt Revenue (USD Million) By Type (2021-2032)
Figure 38. South America Bulk Salt Revenue (USD Million) By Application (2021-2032)
Figure 39. South America Bulk Salt Revenue (USD Million) By Product (2021-2032)
Figure 40. Middle East and Africa Bulk Salt Revenue (USD Million) By Type (2021-2032)
Figure 41. Middle East and Africa Bulk Salt Revenue (USD Million) By Application (2021-2032)
Figure 42. Middle East and Africa Bulk Salt Revenue (USD Million) By Product (2021-2032)
