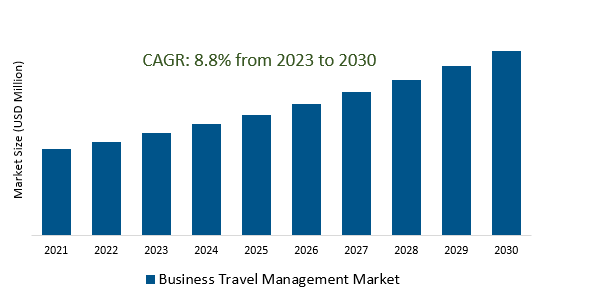
The Business Travel Management Market Size is estimated to register 8.8% growth over the forecast period from 2023 to 2030.
Business Travel Management Market Overview
Continued economic expansion and globalization is driving business expansion, leading to increased corporate travel activities, fostering demand for efficient travel management solutions. Companies are seeking cost-effective travel management solutions to optimize budgets, reduce expenses, and enhance transparency in travel-related spending. Tailoring travel experiences to individual preferences, allowing for customizable itineraries, accommodation options, and services, aiming to enhance traveller satisfaction and productivity are contributing to the market growth. Increased demand for flexible booking options, cancellation policies, and accommodations for last-minute changes is influencing the market growth. Greater focus on traveller safety and well-being, integrating robust duty of care programs to provide assistance and support to employees during travel emergencies are increasing the demand.
Business Travel Management Market Dynamics
Market Trends- Elevated Focus on Traveler Well-being and Duty of Care in the Business Travel Management Market.
Growing emphasis on ensuring the health, safety, and overall well-being of corporate travelers are the key factors. Further, companies are prioritizing the implementation of comprehensive Duty of Care programs and initiatives to address various aspects of traveler safety during business trips. Businesses are integrating sophisticated tools and services within their travel management strategies to track traveler whereabouts, provide real-time updates, and assist in emergencies. Health monitoring, hygiene standards, and crisis management protocols into travel policies to safeguard employees' health and mitigate travel-related risks are fueling the demand.
Market Driver- Demanding growth of Globalization and Expanding Business Operations in the Business Travel Management Market.
The interconnected global economy demands frequent business travels, necessitating effective travel management solutions to streamline booking processes, manage expenses, and ensure seamless travel experiences for employees are contributing to the market growth.
Globalization complexities of cross-border travel, including visa requirements, currency considerations, cultural differences, and compliance with various regulations are rapidly increasing the demand.
Further, the expansion of businesses into new markets and regions heightens the market growth, emphasizing the importance of optimized itineraries and cost-effective travel solutions.
Market Opportunity- Blending Business and Leisure in the Business Travel Management Market.
The growing inclination of employees to extend business trips for leisure purposes, blending work obligations with personal travel experiences are the major factors.
Companies are adopting flexible travel policies and encouraging employees to extend business trips by arranging their itineraries to incorporate leisure activities.
Additionally, diverse travel preferences, offering flexibility in bookings, and ensuring a seamless transition between business and leisure arrangements by enhancing employee morale, reduce burnout, and improve retention rates are driving the market growth.
Market Share Analysis- Consulting Services will register the fastest growth.
The Business Travel Management Market is analyzed across Consulting Services, Transportation, Accommodation, Event Management & Others. Consulting Services is poised to register the fastest growth. These consulting services encompass the assessment and optimization of travel policies and procedures, aiming to enhance efficiency, reduce costs, and improve overall travel experiences for employees. They provide tailored solutions that align with the specific needs and objectives of businesses, ensuring that their travel management practices are optimized to meet industry standards and best practices. They assist companies in navigating the complexities of travel management by offering innovative solutions, such as implementing travel management platforms, enhancing supplier relationships, negotiating contracts, and adopting sustainable travel practices. Further, their expertise extends to compliance with travel regulations, duty of care responsibilities, and the integration of health and safety protocols.
Market Share Analysis- Corporate held a significant market share in 2023
The Business Travel Management Market is analyzed across various industries including Corporate and Government. Of these, Corporate held a significant market share in 2023. Corporate clients in the Business Travel Management Market seek tailored travel management services that align with their specific needs and corporate travel policies. These services encompass various aspects, including itinerary planning, booking accommodations, managing transportation, arranging meetings or events, and handling travel expenses. They involve strategic planning to optimize travel expenses, ensure compliance with corporate travel policies and industry regulations, and enhance overall travel experiences. Service providers cater to corporate demands by offering customizable solutions, negotiating favorable rates with suppliers, and integrating technological advancements to streamline booking processes. Further, these services help track travel expenses, analyze travel patterns, and provide insights that aid in decision-making, cost optimization, and compliance management.
Business Travel Management Market Segmentation
By Type
- Consulting Services
- Transportation
- Accommodation
- Event Management
- Others
By Industry
By Region
- North America (United States, Canada, Mexico)
- Europe (Germany, France, United Kingdom, Spain, Italy, Others)
- Asia Pacific (China, India, Japan, South Korea, Australia, Others)
- Latin America (Brazil, Argentina, Others)
- Middle East and Africa (Saudi Arabia, UAE, Kuwait, Other Middle East, South Africa, Nigeria, Other Africa)
Business Travel Management Market Companies
- American Express Global Business Travel
- CWT Global B.V.
- BCD Group
- Corporate Travel Management
- FCM Travel Solutions
- Direct Travel
- GBT
- JTB Business Travel
- National Express
- Radius Travel
- Safe Harbors Business Travel
- Teplis Travel Service
- ARTA Travel
- Cain Travel & Events
- GTI Travel
*List not exhaustive
Business Travel Management Market Outlook 2023
1 Market Overview
1.1 Introduction to the Business Travel Management Market
1.2 Scope of the Study
1.3 Research Objective
1.3.1 Key Market Scope and Segments
1.3.2 Players Covered
1.3.3 Years Considered
2 Executive Summary
2.1 2023 Business Travel Management Industry- Market Statistics
3 Market Dynamics
3.1 Market Drivers
3.2 Market Challenges
3.3 Market Opportunities
3.4 Market Trends
4 Market Factor Analysis
4.1 Porter’s Five Forces
4.2 Market Entropy
4.2.1 Global Business Travel Management Market Companies with Area Served
4.2.2 Products Offerings Global Business Travel Management Market
5 COVID-19 Impact Analysis and Outlook Scenarios
5.1.1 Covid-19 Impact Analysis
5.1.2 post-COVID-19 Scenario- Low Growth Case
5.1.3 post-COVID-19 Scenario- Reference Growth Case
5.1.4 post-COVID-19 Scenario- Low Growth Case
6 Global Business Travel Management Market Trends
6.1 Global Business Travel Management Revenue (USD Million) and CAGR (%) by Type (2018-2030)
6.2 Global Business Travel Management Revenue (USD Million) and CAGR (%) by Applications (2018-2030)
6.3 Global Business Travel Management Revenue (USD Million) and CAGR (%) by regions (2018-2030)
7 Global Business Travel Management Market Revenue (USD Million) by Type, and Applications (2018-2022)
7.1 Global Business Travel Management Revenue (USD Million) by Type (2018-2022)
7.1.1 Global Business Travel Management Revenue (USD Million), Market Share (%) by Type (2018-2022)
7.2 Global Business Travel Management Revenue (USD Million) by Applications (2018-2022)
7.2.1 Global Business Travel Management Revenue (USD Million), Market Share (%) by Applications (2018-2022)
8 Global Business Travel Management Development Regional Status and Outlook
8.1 Global Business Travel Management Revenue (USD Million) By Regions (2018-2022)
8.2 North America Business Travel Management Revenue (USD Million) by Type, and Application (2018-2022)
8.2.1 North America Business Travel Management Revenue (USD Million) by Country (2018-2022)
8.2.2 North America Business Travel Management Revenue (USD Million) by Type (2018-2022)
8.2.3 North America Business Travel Management Revenue (USD Million) by Applications (2018-2022)
8.3 Europe Business Travel Management Revenue (USD Million), by Type, and Applications (USD Million) (2018-2022)
8.3.1 Europe Business Travel Management Revenue (USD Million), by Country (2018-2022)
8.3.2 Europe Business Travel Management Revenue (USD Million) by Type (2018-2022)
8.3.3 Europe Business Travel Management Revenue (USD Million) by Applications (2018-2022)
8.4 Asia Pacific Business Travel Management Revenue (USD Million), and Revenue (USD Million) by Type, and Applications (2018-2022)
8.4.1 Asia Pacific Business Travel Management Revenue (USD Million) by Country (2018-2022)
8.4.2 Asia Pacific Business Travel Management Revenue (USD Million) by Type (2018-2022)
8.4.3 Asia Pacific Business Travel Management Revenue (USD Million) by Applications (2018-2022)
8.5 South America Business Travel Management Revenue (USD Million), by Type, and Applications (2018-2022)
8.5.1 South America Business Travel Management Revenue (USD Million), by Country (2018-2022)
8.5.2 South America Business Travel Management Revenue (USD Million) by Type (2018-2022)
8.5.3 South America Business Travel Management Revenue (USD Million) by Applications (2018-2022)
8.6 Middle East and Africa Business Travel Management Revenue (USD Million), by Type, Technology, Application, Thickness (2018-2022)
8.6.1 Middle East and Africa Business Travel Management Revenue (USD Million) by Country (2018-2022)
8.6.2 Middle East and Africa Business Travel Management Revenue (USD Million) by Type (2018-2022)
8.6.3 Middle East and Africa Business Travel Management Revenue (USD Million) by Applications (2018-2022)
9 Company Profiles
10 Global Business Travel Management Market Revenue (USD Million), by Type, and Applications (2023-2030)
10.1 Global Business Travel Management Revenue (USD Million) and Market Share (%) by Type (2023-2030)
10.1.1 Global Business Travel Management Revenue (USD Million), and Market Share (%) by Type (2023-2030)
10.2 Global Business Travel Management Revenue (USD Million) and Market Share (%) by Applications (2023-2030)
10.2.1 Global Business Travel Management Revenue (USD Million), and Market Share (%) by Applications (2023-2030)
11 Global Business Travel Management Development Regional Status and Outlook Forecast
11.1 Global Business Travel Management Revenue (USD Million) By Regions (2023-2030)
11.2 North America Business Travel Management Revenue (USD Million) by Type, and Applications (2023-2030)
11.2.1 North America Business Travel Management Revenue (USD) Million by Country (2023-2030)
11.2.2 North America Business Travel Management Revenue (USD Million), by Type (2023-2030)
11.2.3 North America Business Travel Management Revenue (USD Million), Market Share (%) by Applications (2023-2030)
11.3 Europe Business Travel Management Revenue (USD Million), by Type, and Applications (2023-2030)
11.3.1 Europe Business Travel Management Revenue (USD Million), by Country (2023-2030)
11.3.2 Europe Business Travel Management Revenue (USD Million), by Type (2023-2030)
11.3.3 Europe Business Travel Management Revenue (USD Million), by Applications (2023-2030)
11.4 Asia Pacific Business Travel Management Revenue (USD Million) by Type, and Applications (2023-2030)
11.4.1 Asia Pacific Business Travel Management Revenue (USD Million), by Country (2023-2030)
11.4.2 Asia Pacific Business Travel Management Revenue (USD Million), by Type (2023-2030)
11.4.3 Asia Pacific Business Travel Management Revenue (USD Million), by Applications (2023-2030)
11.5 South America Business Travel Management Revenue (USD Million), by Type, and Applications (2023-2030)
11.5.1 South America Business Travel Management Revenue (USD Million), by Country (2023-2030)
11.5.2 South America Business Travel Management Revenue (USD Million), by Type (2023-2030)
11.5.3 South America Business Travel Management Revenue (USD Million), by Applications (2023-2030)
11.6 Middle East and Africa Business Travel Management Revenue (USD Million), by Type, and Applications (2023-2030)
11.6.1 Middle East and Africa Business Travel Management Revenue (USD Million), by region (2023-2030)
11.6.2 Middle East and Africa Business Travel Management Revenue (USD Million), by Type (2023-2030)
11.6.3 Middle East and Africa Business Travel Management Revenue (USD Million), by Applications (2023-2030)
12 Methodology and Data Sources
12.1 Methodology/Research Approach
12.1.1 Research Programs/Design
12.1.2 Market Size Estimation
12.1.3 Market Breakdown and Data Triangulation
12.2 Data Sources
12.2.1 Secondary Sources
12.2.2 Primary Sources
12.3 Disclaimer
List of Tables
Table 1 Market Segmentation Analysis
Table 2 Global Business Travel Management Market Companies with Areas Served
Table 3 Products Offerings Global Business Travel Management Market
Table 4 Low Growth Scenario Forecasts
Table 5 Reference Case Growth Scenario
Table 6 High Growth Case Scenario
Table 7 Global Business Travel Management Revenue (USD Million) And CAGR (%) By Type (2018-2030)
Table 8 Global Business Travel Management Revenue (USD Million) And CAGR (%) By Applications (2018-2030)
Table 9 Global Business Travel Management Revenue (USD Million) And CAGR (%) By Regions (2018-2030)
Table 10 Global Business Travel Management Revenue (USD Million) By Type (2018-2022)
Table 11 Global Business Travel Management Revenue Market Share (%) By Type (2018-2022)
Table 12 Global Business Travel Management Revenue (USD Million) By Applications (2018-2022)
Table 13 Global Business Travel Management Revenue Market Share (%) By Applications (2018-2022)
Table 14 Global Business Travel Management Market Revenue (USD Million) By Regions (2018-2022)
Table 15 Global Business Travel Management Market Share (%) By Regions (2018-2022)
Table 16 North America Business Travel Management Revenue (USD Million) By Country (2018-2022)
Table 17 North America Business Travel Management Revenue (USD Million) By Type (2018-2022)
Table 18 North America Business Travel Management Revenue (USD Million) By Applications (2018-2022)
Table 19 Europe Business Travel Management Revenue (USD Million) By Country (2018-2022)
Table 20 Europe Business Travel Management Revenue (USD Million) By Type (2018-2022)
Table 21 Europe Business Travel Management Revenue (USD Million) By Applications (2018-2022)
Table 22 Asia Pacific Business Travel Management Revenue (USD Million) By Country (2018-2022)
Table 23 Asia Pacific Business Travel Management Revenue (USD Million) By Type (2018-2022)
Table 24 Asia Pacific Business Travel Management Revenue (USD Million) By Applications (2018-2022)
Table 25 South America Business Travel Management Revenue (USD Million) By Country (2018-2022)
Table 26 South America Business Travel Management Revenue (USD Million) By Type (2018-2022)
Table 27 South America Business Travel Management Revenue (USD Million) By Applications (2018-2022)
Table 28 Middle East and Africa Business Travel Management Revenue (USD Million) By Region (2018-2022)
Table 29 Middle East and Africa Business Travel Management Revenue (USD Million) By Type (2018-2022)
Table 30 Middle East and Africa Business Travel Management Revenue (USD Million) By Applications (2018-2022)
Table 31 Financial Analysis
Table 32 Global Business Travel Management Revenue (USD Million) By Type (2023-2030)
Table 33 Global Business Travel Management Revenue Market Share (%) By Type (2023-2030)
Table 34 Global Business Travel Management Revenue (USD Million) By Applications (2023-2030)
Table 35 Global Business Travel Management Revenue Market Share (%) By Applications (2023-2030)
Table 36 Global Business Travel Management Market Revenue (USD Million), And Revenue (USD Million) By Regions (2023-2030)
Table 37 North America Business Travel Management Revenue (USD)By Country (2023-2030)
Table 38 North America Business Travel Management Revenue (USD Million) By Type (2023-2030)
Table 39 North America Business Travel Management Revenue (USD Million) By Applications (2023-2030)
Table 40 Europe Business Travel Management Revenue (USD Million) By Country (2023-2030)
Table 41 Europe Business Travel Management Revenue (USD Million) By Type (2023-2030)
Table 42 Europe Business Travel Management Revenue (USD Million) By Applications (2023-2030)
Table 43 Asia Pacific Business Travel Management Revenue (USD Million) By Country (2023-2030)
Table 44 Asia Pacific Business Travel Management Revenue (USD Million) By Type (2023-2030)
Table 45 Asia Pacific Business Travel Management Revenue (USD Million) By Applications (2023-2030)
Table 46 South America Business Travel Management Revenue (USD Million) By Country (2023-2030)
Table 47 South America Business Travel Management Revenue (USD Million) By Type (2023-2030)
Table 48 South America Business Travel Management Revenue (USD Million) By Applications (2023-2030)
Table 49 Middle East and Africa Business Travel Management Revenue (USD Million) By Region (2023-2030)
Table 50 Middle East and Africa Business Travel Management Revenue (USD Million) By Region (2023-2030)
Table 51 Middle East and Africa Business Travel Management Revenue (USD Million) By Type (2023-2030)
Table 52 Middle East and Africa Business Travel Management Revenue (USD Million) By Applications (2023-2030)
Table 53 Research Programs/Design for This Report
Table 54 Key Data Information from Secondary Sources
Table 55 Key Data Information from Primary Sources
List of Figures
Figure 1 Market Scope
Figure 2 Porter’s Five Forces
Figure 3 Global Business Travel Management Revenue (USD Million) By Type (2018-2022)
Figure 4 Global Business Travel Management Revenue Market Share (%) By Type (2022)
Figure 5 Global Business Travel Management Revenue (USD Million) By Applications (2018-2022)
Figure 6 Global Business Travel Management Revenue Market Share (%) By Applications (2022)
Figure 7 Global Business Travel Management Market Revenue (USD Million) By Regions (2018-2022)
Figure 8 Global Business Travel Management Market Share (%) By Regions (2022)
Figure 9 North America Business Travel Management Revenue (USD Million) By Country (2018-2022)
Figure 10 North America Business Travel Management Revenue (USD Million) By Type (2018-2022)
Figure 11 North America Business Travel Management Revenue (USD Million) By Applications (2018-2022)
Figure 12 Europe Business Travel Management Revenue (USD Million) By Country (2018-2022)
Figure 13 Europe Business Travel Management Revenue (USD Million) By Type (2018-2022)
Figure 14 Europe Business Travel Management Revenue (USD Million) By Applications (2018-2022)
Figure 15 Asia Pacific Business Travel Management Revenue (USD Million) By Country (2018-2022)
Figure 16 Asia Pacific Business Travel Management Revenue (USD Million) By Type (2018-2022)
Figure 17 Asia Pacific Business Travel Management Revenue (USD Million) By Applications (2018-2022)
Figure 18 South America Business Travel Management Revenue (USD Million) By Country (2018-2022)
Figure 19 South America Business Travel Management Revenue (USD Million) By Type (2018-2022)
Figure 20 South America Business Travel Management Revenue (USD Million) By Applications (2018-2022)
Figure 21 Middle East and Africa Business Travel Management Revenue (USD Million) By Region (2018-2022)
Figure 22 Middle East and Africa Business Travel Management Revenue (USD Million) By Type (2018-2022)
Figure 23 Middle East and Africa Business Travel Management Revenue (USD Million) By Applications (2018-2022)
Figure 24 Global Business Travel Management Revenue (USD Million) By Type (2023-2030)
Figure 25 Global Business Travel Management Revenue Market Share (%) By Type (2030)
Figure 26 Global Business Travel Management Revenue (USD Million) By Applications (2023-2030)
Figure 27 Global Business Travel Management Revenue Market Share (%) By Applications (2030)
Figure 28 Global Business Travel Management Market Revenue (USD Million) By Regions (2023-2030)
Figure 29 North America Business Travel Management Revenue (USD Million) By Country (2023-2030)
Figure 30 North America Business Travel Management Revenue (USD Million) By Type (2023-2030)
Figure 31 North America Business Travel Management Revenue (USD Million) By Applications (2023-2030)
Figure 32 Europe Business Travel Management Revenue (USD Million) By Country (2023-2030)
Figure 33 Europe Business Travel Management Revenue (USD Million) By Type (2023-2030)
Figure 34 Europe Business Travel Management Revenue (USD Million) By Applications (2023-2030)
Figure 35 Asia Pacific Business Travel Management Revenue (USD Million) By Country (2023-2030)
Figure 36 Asia Pacific Business Travel Management Revenue (USD Million) By Type (2023-2030)
Figure 37 Asia Pacific Business Travel Management Revenue (USD Million) By Applications (2023-2030)
Figure 38 South America Business Travel Management Revenue (USD Million) By Country (2023-2030)
Figure 39 South America Business Travel Management Revenue (USD Million) By Type (2023-2030)
Figure 40 South America Business Travel Management Revenue (USD Million) By Applications (2023-2030)
Figure 41 Middle East and Africa Business Travel Management Revenue (USD Million) By Region (2023-2030)
Figure 42 Middle East and Africa Business Travel Management Revenue (USD Million) By Region (2023-2030)
Figure 43 Middle East and Africa Business Travel Management Revenue (USD Million) By Type (2023-2030)
Figure 44 Middle East and Africa Business Travel Management Revenue (USD Million) By Applications (2023-2030)
Figure 45 Bottom-Up and Top-Down Approaches for This Report
Figure 46 Data Triangulation
