<h3><Strong><i>Global Butter and Margarine Market Size is valued at $5.8 Billion in 2024 and is forecast to register a growth rate (CAGR) of 3.3% to reach $7.5 Billion by 2032.</h3></Strong></i>The global Butter and Margarine Market Comprehensive Study analyzes and forecasts the market size across 6 regions and 24 countries for diverse segments -By Type (Traditional, Liquid, Others), By Usage (Spreadable, Non-spreadable), By Distribution Channel (Retail, Industrial, Food Service)
<h2>An Introduction to Butter and Margarine Market</h2>In 2024, the Butter and Margarine market is witnessing significant growth, driven by the increasing demand for versatile and flavorful spreads in both household and commercial kitchens. Butter and margarine are essential ingredients in baking, cooking, and as spreads, valued for their distinct textures and flavors. The market is supported by the growing consumer preference for natural and high-quality products. Advances in production techniques and formulation are enhancing the nutritional profiles and spreadability of butter and margarine. The market is also benefiting from the trend towards clean-label and organic products, as well as the introduction of plant-based margarine options catering to health-conscious and vegan consumers.
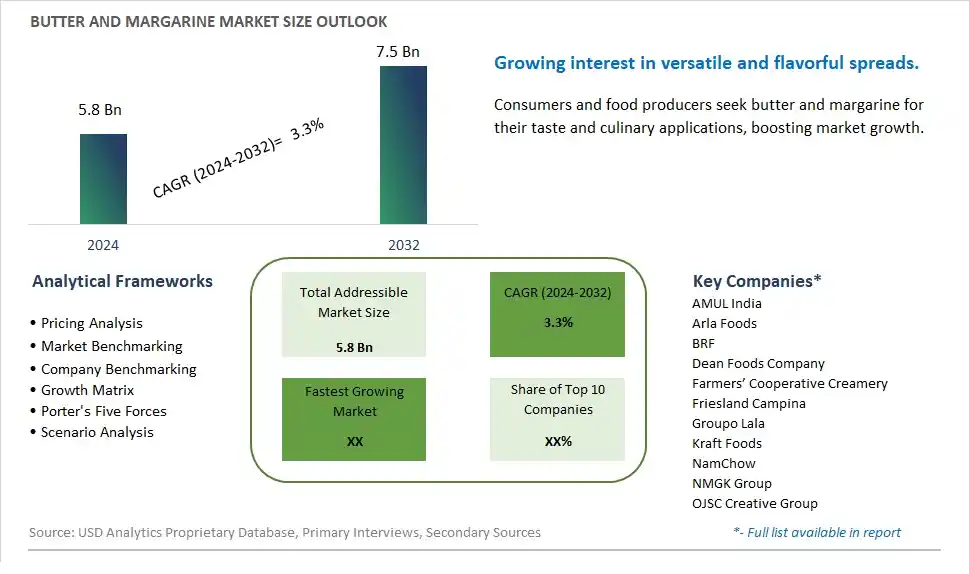
<h2>Butter and Margarine Competitive Landscape</h2>The market report analyses the leading companies in the industry including AMUL India, Arla Foods, BRF, Dean Foods Company, Farmers’ Cooperative Creamery, Friesland Campina, Groupo Lala, Kraft Foods, NamChow, NMGK Group, OJSC Creative Group, and Others.<h2>Butter and Margarine Market Dynamics</h2><h3>Butter and Margarine Market Trend: Shift Towards Healthier Alternatives</h3>One prominent market trend in the Butter and Margarine market is the shift towards healthier alternatives. With increasing health consciousness among consumers, there is a growing demand for products that offer health benefits such as lower saturated fats, reduced cholesterol levels, and natural ingredients. This trend has led to the development and marketing of healthier butter and margarine options, such as spreads made from plant-based oils, organic ingredients, and products fortified with vitamins and minerals.<h3>Butter and Margarine Market Driver: Culinary Diversity and Convenience</h3>The market driver for Butter and Margarine is the culinary diversity and convenience they offer. Butter and margarine are versatile ingredients used in a wide range of culinary applications, from baking and cooking to spreading on bread and toast. Their ability to enhance flavor, texture, and aroma in various dishes makes them indispensable in the food industry. Moreover, the convenience of pre-packaged butter and margarine products, including portion-controlled packs and flavored variants, drives their consumption among consumers seeking convenience in meal preparation.<h3>Butter and Margarine Market Opportunity: Innovation in Plant-Based and Functional Variants</h3>An opportunity within the Butter and Margarine market lies in innovation, particularly in plant-based and functional variants. With the rising popularity of plant-based diets and increased awareness of health benefits associated with plant-derived fats, there is a growing demand for plant-based butter and margarine alternatives. Manufacturers can capitalize on this trend by introducing innovative plant-based spreads made from oils like coconut, avocado, and almond. Furthermore, there is potential in developing functional butter and margarine products fortified with omega-3 fatty acids, vitamins, probiotics, or other functional ingredients to cater to health-conscious consumers seeking added nutritional value in their spreads.<h3>Butter and Margarine Market Share Analysis: Traditional segment generated the highest revenue share in the industry</h3>The Traditional segment is the largest within the Butter and Margarine Market, holding a significant share of the market. This segment's dominance can be attributed to several key factors driving its widespread adoption and usage across various industries and consumer preferences. Traditional butter and margarine products have been staples in households, bakeries, foodservice establishments, and the food processing industry for many years. These products offer familiar flavors, textures, and functionalities that cater to traditional cooking, baking, and culinary applications. Butter, derived from cream, is prized for its rich taste, creamy consistency, and natural flavor, making it a preferred choice for spreading, cooking, baking, and flavoring a wide range of dishes and recipes. On the other hand, margarine, a vegetable oil-based spread, gained popularity as a cost-effective alternative to butter and is known for its versatility, shelf stability, and lower saturated fat content compared to butter. Both traditional butter and margarine products are used extensively in the production of bakery goods, confectionery, snacks, ready-to-eat meals, and culinary preparations, contributing to the segment's substantial market share. Further, the growing consumer focus on natural, minimally processed, and clean-label products has led to a resurgence in demand for traditional butter made from high-quality cream and natural ingredients. Additionally, the development of innovative formulations, such as spreadable butters and flavored margarines, has further diversified the traditional segment, appealing to a broader range of consumer preferences and culinary trends. As a result, suppliers and manufacturers in the Butter and Margarine Market continue to invest in product innovation, quality assurance, and market strategies to maintain the traditional segment's leadership and meet evolving consumer demands for authentic, flavorful, and versatile butter and margarine products.<h3>Butter and Margarine Market Share Analysis: Spreadable is the fastest growing segment over the forecast period to 2032</h3>The Spreadable segment within the Butter and Margarine Market is experiencing rapid growth and is anticipated to continue its expansion trajectory until 2032. This segment's fast growth can be attributed to shifting consumer preferences, evolving culinary trends, and advancements in product formulations and packaging technologies. Spreadable butter and margarine products offer convenience, versatility, and ease of use, making them increasingly popular among consumers seeking ready-to-use options for spreading, cooking, baking, and flavoring various dishes. The spreadable segment includes a wide range of products such as whipped butter, soft margarine, flavored spreads, and portion-controlled packs, catering to diverse consumer preferences and usage occasions. The convenience factor associated with spreadable products, especially in urban and busy lifestyles, has driven their demand across households, foodservice establishments, and on-the-go consumption scenarios. Additionally, innovations in packaging formats, such as squeeze bottles, tubs, and portion packs, have enhanced the shelf life, freshness, and convenience of spreadable butters and margarines, further fueling their market growth. Further, the growing demand for healthier and functional spreadable options, including reduced-fat, plant-based, and fortified spreads, contributes to the segment's expansion as consumers prioritize health-conscious choices without compromising taste and convenience. As a result, manufacturers and suppliers in the Butter and Margarine Market are focusing on developing innovative spreadable products, expanding distribution channels, and leveraging marketing strategies to capitalize on the growing demand for spreadable butter and margarine products, driving the segment's rapid growth trajectory towards 2032.<h3>Butter and Margarine Market Share Analysis: Retail segment generated the highest revenue share in the industry</h3>The Retail segment is the largest within the Butter and Margarine Market, commanding a substantial share of the market. This segment's dominance can be attributed to the widespread availability and accessibility of butter and margarine products through retail channels, including supermarkets, hypermarkets, convenience stores, specialty food stores, and online retail platforms. Retail outlets serve as key points of sale for consumers seeking a variety of butter and margarine options for household consumption, cooking, baking, and spreading purposes. The retail segment encompasses a diverse range of product formats, including packaged butter sticks, tubs, spreads, and single-serve portions, catering to different consumer preferences, usage occasions, and packaging needs. Additionally, the retail segment benefits from extensive promotional activities, product visibility, and consumer engagement initiatives implemented by retailers and manufacturers to drive sales, increase brand awareness, and capture market share. Further, the convenience and one-stop shopping experience offered by retail channels contribute to the segment's growth, as consumers can easily access a wide assortment of butter and margarine products along with other grocery items in a single location. With the rising demand for healthier, functional, and premium butter and margarine products, retailers are expanding their product offerings, introducing private label brands, and enhancing their online presence to meet evolving consumer preferences and capitalize on market opportunities. As a result, the retail segment continues to lead the Butter and Margarine Market, with ongoing strategies focused on innovation, promotion, and customer satisfaction driving its sustained growth.<h2>Butter and Margarine Market Segmentation</h2><Strong>By Type</Strong>
Traditional
Liquid
Others
<Strong>By Usage</Strong>
Spreadable
Non-spreadable
<Strong>By Distribution Channel</Strong>
Retail
Industrial
Food Service
<Strong>Countries Analyzed</Strong>
North America (US, Canada, Mexico)
Europe (Germany, UK, France, Spain, Italy, Russia, Rest of Europe)
Asia Pacific (China, India, Japan, South Korea, Australia, South East Asia, Rest of Asia)
South America (Brazil, Argentina, Rest of South America)
Middle East and Africa (Saudi Arabia, UAE, Rest of Middle East, South Africa, Egypt, Rest of Africa)<h2>Butter and Margarine Companies Profiled in the Study</h2>AMUL India
Arla Foods
BRF
Dean Foods Company
Farmers’ Cooperative Creamery
Friesland Campina
Groupo Lala
Kraft Foods
NamChow
NMGK Group
OJSC Creative Group
*- List Not Exhaustive
<Strong>Chapter 1. TABLE OF CONTENTS</Strong>
<Strong>Chapter 2. Introduction to Butter and Margarine Market </Strong>
2.1. Market Overview
2.2. Key Statistics and Report Highlights
2.3. Scope of the Comprehensive Study
2.3.1. Market Definition
2.3.2 Countries and Regions Covered
2.3.3 Research Objective
2.3.4 Units, Currency, and Conversions
2.3.5 Industry Value Chain
2.4. Key Market Segments
2.5. Key Companies
2.6. Study Period
<Strong>Chapter 3. Strategic Analysis Review</Strong>
3.1. Butter and Margarine Pricing Analysis and Forecast
3.2. Porter’s Five Forces
3.3. Market Ecosystem
3.4. SWOT Analysis
3.5. Regulatory Scenario
3.3. Effects of Inflation, Russia-Ukraine War, moderating economic growth, and other macroeconomic factors
<Strong>Chapter 4. Competitive Landscape</Strong>
4.1. Market Share Analysis
4.1.1. Global Butter and Margarine Market Share by Company, 2023
4.1.2. Product Offerings of Leading Butter and Margarine Companies
4.2. Market Entropy
4.2.1. New Product Launches in the Industry
4.2.2. Mergers, Acquisitions, Joint ventures, and Partnerships
4.3. Key Strategies and Best Practices
<Strong>Chapter 5. Global Market Projections: Best, Reference, and Low Case Scenarios</Strong>
5.1. Growth Analysis- Case Scenario Definitions
5.2. Low Growth Case Scenario Forecasts
5.3. Reference Growth Case Scenario Forecasts
5.4. High Growth Case Scenario Forecasts
<Strong>Chapter 6. Market Dynamics</Strong>
6.1. Butter and Margarine Market Drivers
6.2. Butter and Margarine Market Challenges
6.6. Butter and Margarine Market Opportunities
6.4. Butter and Margarine Market Trends
<Strong>Chapter 7. Global Butter and Margarine Market Outlook Trends</Strong>
7.1. Global Butter and Margarine Revenue (USD Million) and CAGR (%) by Type (2021-2032)
7.2. Global Butter and Margarine Revenue (USD Million) and CAGR (%) by Application (2021-2032)
7.3. Global Butter and Margarine Revenue (USD Million) and CAGR (%) by Product (2021-2032)
<Strong>By Type</Strong>
Traditional
Liquid
Others
<Strong>By Usage</Strong>
Spreadable
Non-spreadable
<Strong>By Distribution Channel</Strong>
Retail
Industrial
Food Service
<Strong>Chapter 8. Global Butter and Margarine Regional Analysis and Outlook</Strong>
8.1. Global Butter and Margarine Revenue (USD Million) By Regions (2021- 2032)
8.2. North America Butter and Margarine Revenue (USD Million) by Country (2021-2032)
8.2.1. United States Butter and Margarine Regional Analysis and Outlook
8.2.2. Canada Butter and Margarine Regional Analysis and Outlook
8.2.3. Mexico Butter and Margarine Regional Analysis and Outlook
8.3. Europe Butter and Margarine Revenue (USD Million), by Country (2021-2032)
8.3.1. Germany Butter and Margarine Regional Analysis and Outlook
8.3.2. France Butter and Margarine Regional Analysis and Outlook
8.3.3. United Kingdom Butter and Margarine Regional Analysis and Outlook
8.3.4. Spain Butter and Margarine Regional Analysis and Outlook
8.3.5. Italy Butter and Margarine Regional Analysis and Outlook
8.3.6. Russia Butter and Margarine Regional Analysis and Outlook
8.3.7. Rest of Europe Butter and Margarine Regional Analysis and Outlook
8.4. Asia Pacific Butter and Margarine Revenue (USD Million) by Country (2021-2032)
8.4.1. China Butter and Margarine Regional Analysis and Outlook
8.4.2. Japan Butter and Margarine Regional Analysis and Outlook
8.4.3. India Butter and Margarine Regional Analysis and Outlook
8.4.4. South Korea Butter and Margarine Regional Analysis and Outlook
8.4.5. Australia Butter and Margarine Regional Analysis and Outlook
8.4.6. South East Asia Butter and Margarine Regional Analysis and Outlook
8.4.7. Rest of Asia Pacific Butter and Margarine Regional Analysis and Outlook
8.5. South America Butter and Margarine Revenue (USD Million), by Country (2021-2032)
8.5.1. Brazil Butter and Margarine Regional Analysis and Outlook
8.5.2. Argentina Butter and Margarine Regional Analysis and Outlook
8.5.3. Rest of South America Butter and Margarine Regional Analysis and Outlook
8.6. Middle East and Africa Butter and Margarine Revenue (USD Million) by Country (2021-2032)
8.6.1. Middle East Butter and Margarine Regional Analysis and Outlook
8.6.2. Africa Butter and Margarine Regional Analysis and Outlook
<Strong>Chapter 9. North America Butter and Margarine Analysis and Outlook</Strong>
9.1. North America Butter and Margarine Revenue (USD Million) by Segments (2021-2032)
9.1.1. North America Butter and Margarine Revenue (USD Million) by Type (2021-2032)
9.1.2. North America Butter and Margarine Revenue (USD Million) by Application (2021-2032)
9.1.3. North America Butter and Margarine Revenue (USD Million) by Product (2021-2032)
<Strong>By Type</Strong>
Traditional
Liquid
Others
<Strong>By Usage</Strong>
Spreadable
Non-spreadable
<Strong>By Distribution Channel</Strong>
Retail
Industrial
Food Service
<Strong>Chapter 10. Europe Butter and Margarine Analysis and Outlook</Strong>
10.1. Europe Butter and Margarine Revenue (USD Million), by Segments (USD Million) (2021-2032)
10.1.1. Europe Butter and Margarine Revenue (USD Million) by Type (2021-2032)
10.1.2. Europe Butter and Margarine Revenue (USD Million) by Application (2021-2032)
10.1.3. Europe Butter and Margarine Revenue (USD Million) by Product (2021-2032)
<Strong>By Type</Strong>
Traditional
Liquid
Others
<Strong>By Usage</Strong>
Spreadable
Non-spreadable
<Strong>By Distribution Channel</Strong>
Retail
Industrial
Food Service
<Strong>Chapter 11. Asia Pacific Butter and Margarine Analysis and Outlook</Strong>
11.1. Asia Pacific Butter and Margarine Revenue (USD Million), and Revenue (USD Million) by Segments (2021-2032)
11.1.1. Asia Pacific Butter and Margarine Revenue (USD Million) by Type (2021-2032)
11.1.2. Asia Pacific Butter and Margarine Revenue (USD Million) by Application (2021-2032)
11.1.3. Asia Pacific Butter and Margarine Revenue (USD Million) by Product (2021-2032)
<Strong>By Type</Strong>
Traditional
Liquid
Others
<Strong>By Usage</Strong>
Spreadable
Non-spreadable
<Strong>By Distribution Channel</Strong>
Retail
Industrial
Food Service
<Strong>Chapter 12. South America Butter and Margarine Analysis and Outlook</Strong>
12.1. South America Butter and Margarine Revenue (USD Million), by Segments (2021-2032)
12.1.1. South America Butter and Margarine Revenue (USD Million) by Type (2021-2032)
12.1.2. South America Butter and Margarine Revenue (USD Million) by Application (2021-2032)
12.1.3. South America Butter and Margarine Revenue (USD Million) by Product (2021-2032)
<Strong>By Type</Strong>
Traditional
Liquid
Others
<Strong>By Usage</Strong>
Spreadable
Non-spreadable
<Strong>By Distribution Channel</Strong>
Retail
Industrial
Food Service
<Strong>Chapter 13. Middle East and Africa Butter and Margarine Analysis and Outlook</Strong>
13.1. Middle East and Africa Butter and Margarine Revenue (USD Million), by Segments (2021-2032)
13.1.1. Middle East and Africa Butter and Margarine Revenue (USD Million) by Type (2021-2032)
13.1.2. Middle East and Africa Butter and Margarine Revenue (USD Million) by Application (2021-2032)
13.1.3. Middle East and Africa Butter and Margarine Revenue (USD Million) by Product (2021-2032)
<Strong>By Type</Strong>
Traditional
Liquid
Others
<Strong>By Usage</Strong>
Spreadable
Non-spreadable
<Strong>By Distribution Channel</Strong>
Retail
Industrial
Food Service
<Strong>Chapter 14. Butter and Margarine Company Profiles</Strong>
14.1 Business Overview
14.2 Product Profiles
14.3 SWOT Profiles
14.5 Recent Developments
14.6 Financial Profile
List of Companies
AMUL India
Arla Foods
BRF
Dean Foods Company
Farmers’ Cooperative Creamery
Friesland Campina
Groupo Lala
Kraft Foods
NamChow
NMGK Group
OJSC Creative Group
<Strong>15. Methodology and Data Sources</Strong>
15.1 Customization Offerings
15.2 Subscription Services
15.3 Related Reports
15.4 Publisher Expertise
<Strong>LIST OF TABLES</Strong>
Table 1 Market Segmentation Analysis
Table 2 Global Butter and Margarine Market Share of Leading Companies, 2023
Table 3 Product Offerings of Leading Companies
Table 4 Low Growth Scenario Forecasts
Table 5 Reference Case Growth Scenario
Table 6 High Growth Case Scenario
Table 7 Global Butter and Margarine Revenue (USD Million) And CAGR (%) By Type (2021-2032)
Table 8 Global Butter and Margarine Revenue (USD Million) And CAGR (%) By Application (2021-2032)
Table 9 Global Butter and Margarine Revenue (USD Million) And CAGR (%) By Product (2021-2032)
Table 10 Global Butter and Margarine Market Revenue (USD Million) By Regions (2021-2032)
Table 11 Global Butter and Margarine Market Share (%) By Regions (2021-2032)
Table 12 North America Butter and Margarine Revenue (USD Million) By Country (2021-2032)
Table 13 Europe Butter and Margarine Revenue (USD Million) By Country (2021-2032)
Table 14 Asia Pacific Butter and Margarine Revenue (USD Million) By Country (2021-2032)
Table 15 South America Butter and Margarine Revenue (USD Million) By Country (2021-2032)
Table 16 Middle East and Africa Butter and Margarine Revenue (USD Million) By Region (2021-2032)
Table 17 North America Butter and Margarine Revenue (USD Million) By Type (2021-2032)
Table 18 North America Butter and Margarine Revenue (USD Million) By Application (2021-2032)
Table 19 North America Butter and Margarine Revenue (USD Million) By Product (2021-2032)
Table 20 Europe Butter and Margarine Revenue (USD Million) By Type (2021-2032)
Table 21 Europe Butter and Margarine Revenue (USD Million) By Application (2021-2032)
Table 22 Europe Butter and Margarine Revenue (USD Million) By Product (2021-2032)
Table 23 Asia Pacific Butter and Margarine Revenue (USD Million) By Type (2021-2032)
Table 24 Asia Pacific Butter and Margarine Revenue (USD Million) By Application (2021-2032)
Table 25 Asia Pacific Butter and Margarine Revenue (USD Million) By Product (2021-2032)
Table 26 South America Butter and Margarine Revenue (USD Million) By Type (2021-2032)
Table 27 South America Butter and Margarine Revenue (USD Million) By Application (2021-2032)
Table 28 South America Butter and Margarine Revenue (USD Million) By Product (2021-2032)
Table 29 Middle East and Africa Butter and Margarine Revenue (USD Million) By Type (2021-2032)
Table 30 Middle East and Africa Butter and Margarine Revenue (USD Million) By Application (2021-2032)
Table 31 Middle East and Africa Butter and Margarine Revenue (USD Million) By Product (2021-2032)
<Strong>LIST OF FIGURES</Strong>
Figure 1. Market Scope
Figure 2. Pricing Forecasts Per Unit, 2023- 2032
Figure 3. Porter’s Five Forces
Figure 4. Global Butter and Margarine Market Revenue (USD Million) By Regions (2021-2032)
Figure 5. Global Butter and Margarine Market Share (%) By Regions (2023)
Figure 6. North America Butter and Margarine Revenue (USD Million) By Country (2021-2032)
Figure 7. United States Butter and Margarine Revenue (USD Million) By Country (2021-2032)
Figure 8. Canada Butter and Margarine Revenue (USD Million) By Country (2021-2032)
Figure 9. Mexico Butter and Margarine Revenue (USD Million) By Country (2021-2032)
Figure 10. Europe Butter and Margarine Revenue (USD Million) By Country (2021-2032)
Figure 11. Germany Butter and Margarine Revenue (USD Million) By Country (2021-2032)
Figure 12. France Butter and Margarine Revenue (USD Million) By Country (2021-2032)
Figure 13. United Kingdom Butter and Margarine Revenue (USD Million) By Country (2021-2032)
Figure 14. Spain Butter and Margarine Revenue (USD Million) By Country (2021-2032)
Figure 15. Italy Butter and Margarine Revenue (USD Million) By Country (2021-2032)
Figure 16. Russia Butter and Margarine Revenue (USD Million) By Country (2021-2032)
Figure 17. Rest of Europe Butter and Margarine Revenue (USD Million) By Country (2021-2032)
Figure 11. Asia Pacific Butter and Margarine Revenue (USD Million) By Country (2021-2032)
Figure 12. China Butter and Margarine Revenue (USD Million) By Country (2021-2032)
Figure 13. Japan Butter and Margarine Revenue (USD Million) By Country (2021-2032)
Figure 14. India Butter and Margarine Revenue (USD Million) By Country (2021-2032)
Figure 15. South Korea Butter and Margarine Revenue (USD Million) By Country (2021-2032)
Figure 16. Australia Butter and Margarine Revenue (USD Million) By Country (2021-2032)
Figure 17. South East Asia Butter and Margarine Revenue (USD Million) By Country (2021-2032)
Figure 18. South America Butter and Margarine Revenue (USD Million) By Country (2021-2032)
Figure 19. Brazil Butter and Margarine Revenue (USD Million) By Country (2021-2032)
Figure 20. Argentina Butter and Margarine Revenue (USD Million) By Country (2021-2032)
Figure 21. Rest of Asia Pacific Butter and Margarine Revenue (USD Million) By Country (2021-2032)
Figure 22. Middle East and Africa Butter and Margarine Revenue (USD Million) By Region (2021-2032)
Figure 23. Saudi Arabia Butter and Margarine Revenue (USD Million) By Region (2021-2032)
Figure 24. The UAE Butter and Margarine Revenue (USD Million) By Region (2021-2032)
Figure 25. Rest of Middle East Butter and Margarine Revenue (USD Million) By Region (2021-2032)
Figure 26. South Africa Butter and Margarine Revenue (USD Million) By Region (2021-2032)
Figure 27. Africa Butter and Margarine Revenue (USD Million) By Region (2021-2032)
Figure 28. North America Butter and Margarine Revenue (USD Million) By Type (2021-2032)
Figure 29. North America Butter and Margarine Revenue (USD Million) By Application (2021-2032)
Figure 30. North America Butter and Margarine Revenue (USD Million) By Product (2021-2032)
Figure 31. Europe Butter and Margarine Revenue (USD Million) By Type (2021-2032)
Figure 32. Europe Butter and Margarine Revenue (USD Million) By Application (2021-2032)
Figure 33. Europe Butter and Margarine Revenue (USD Million) By Product (2021-2032)
Figure 34. Asia Pacific Butter and Margarine Revenue (USD Million) By Type (2021-2032)
Figure 35. Asia Pacific Butter and Margarine Revenue (USD Million) By Application (2021-2032)
Figure 36. Asia Pacific Butter and Margarine Revenue (USD Million) By Product (2021-2032)
Figure 37. South America Butter and Margarine Revenue (USD Million) By Type (2021-2032)
Figure 38. South America Butter and Margarine Revenue (USD Million) By Application (2021-2032)
Figure 39. South America Butter and Margarine Revenue (USD Million) By Product (2021-2032)
Figure 40. Middle East and Africa Butter and Margarine Revenue (USD Million) By Type (2021-2032)
Figure 41. Middle East and Africa Butter and Margarine Revenue (USD Million) By Application (2021-2032)
Figure 42. Middle East and Africa Butter and Margarine Revenue (USD Million) By Product (2021-2032)
