<h3><Strong><i>Global Butter Blocks Market Size is valued at $34.6 Billion in 2024 and is forecast to register a growth rate (CAGR) of 3.5% to reach $45.6 Billion by 2032.</h3></Strong></i>The global Butter Blocks Market Comprehensive Study analyzes and forecasts the market size across 6 regions and 24 countries for diverse segments -By Distribution Channel (Online Stores, Supermarkets/Hypermarkets, Departmental Stores, Convenience Stores), By Type (Salted, Unsalted, Others), By Application (Baking, Cooking, Spreading, Flavoring)
<h2>An Introduction to Butter Blocks Market</h2>The Butter Blocks market in 2024 is expanding robustly, driven by the demand for high-quality butter in the foodservice and bakery industries. Butter blocks, known for their rich flavor and consistency, are essential for creating pastries, cookies, and various culinary dishes. The market is supported by the growing popularity of artisanal and premium baked goods, as well as the rise of gourmet cooking at home. Advances in dairy farming and processing technologies are improving the quality and shelf life of butter blocks. The market is also benefiting from the trend towards natural and organic ingredients, appealing to consumers seeking authentic and minimally processed products.
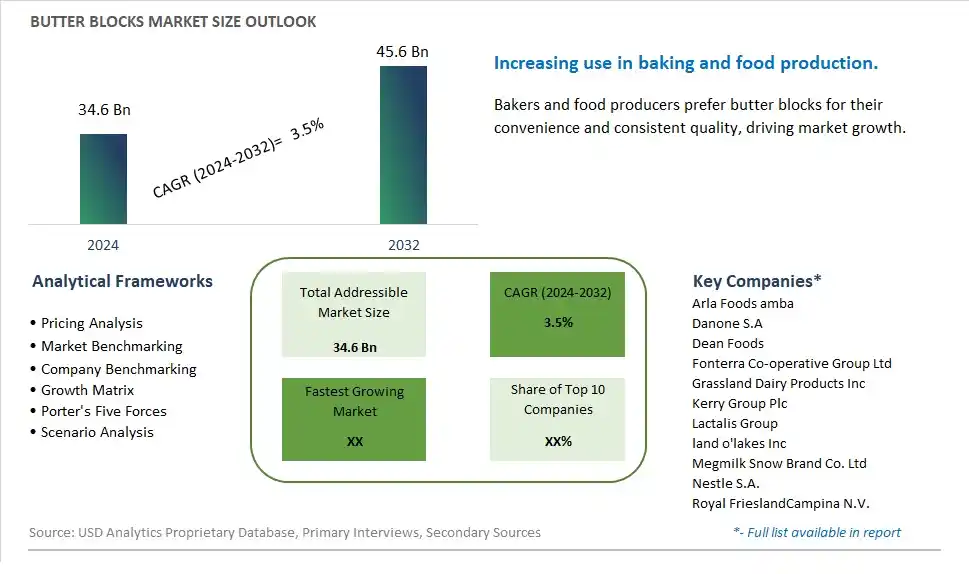
<h2>Butter Blocks Competitive Landscape</h2>The market report analyses the leading companies in the industry including Arla Foods amba, Danone S.A, Dean Foods, Fonterra Co-operative Group Ltd, Grassland Dairy Products Inc, Kerry Group Plc, Lactalis Group, land o'lakes Inc, Megmilk Snow Brand Co. Ltd, Nestle S.A., Royal FrieslandCampina N.V., and Others.<h2>Butter Blocks Market Dynamics</h2><h3>Butter Blocks Market Trend: Premiumization and Artisanal Offerings</h3>One prominent market trend in the Butter Blocks market is the premiumization and rise of artisanal offerings. Consumers are increasingly seeking high-quality, gourmet butter options made from premium ingredients and crafted using traditional methods. This trend is driving the demand for artisanal butter blocks that offer unique flavors, textures, and sourcing stories, appealing to consumers looking for elevated culinary experiences.<h3>Butter Blocks Market Driver: Culinary Trends and Home Baking Boom</h3>The market driver for Butter Blocks is the influence of culinary trends and the home baking boom. As home cooking and baking continue to gain popularity, consumers are seeking premium ingredients to elevate their homemade dishes and baked goods. Butter blocks, with their rich flavor profiles and versatility, are essential ingredients in various recipes, driving their demand among home cooks and bakers who prioritize quality and taste in their culinary creations.<h3>Butter Blocks Market Opportunity: Differentiation Through Specialty and Flavored Variants</h3>An opportunity within the Butter Blocks market lies in differentiation through specialty and flavored variants. Manufacturers can capitalize on consumer preferences for unique and innovative butter options by offering flavored butter blocks infused with herbs, spices, fruits, or other natural ingredients. Additionally, introducing specialty butter blocks such as cultured butter, grass-fed butter, or European-style butter can cater to discerning consumers seeking premium and distinctive choices in the butter category. These differentiated offerings can help brands stand out in a competitive market and attract a wider range of consumers looking for premium and gourmet butter experiences.<h3>Butter Blocks Market Share Analysis: Supermarkets/Hypermarkets segment generated the highest revenue share in the industry</h3>The Supermarkets/Hypermarkets segment stands as the largest within the Butter Blocks Market, holding a significant share of the market. This segment's dominance is primarily due to the widespread presence and accessibility of butter blocks in supermarkets and hypermarkets, which are key retail channels for consumers' daily grocery needs. Supermarkets and hypermarkets offer a wide range of butter block brands, flavors, and varieties, providing consumers with ample choices based on their preferences and requirements. The convenience of one-stop shopping, coupled with the ability to compare different brands and prices, makes supermarkets and hypermarkets a preferred destination for consumers purchasing butter blocks. These retail outlets often run promotional campaigns, discounts, and special offers on butter blocks, attracting more customers and driving sales volume. Additionally, supermarkets and hypermarkets invest in visually appealing displays, strategic product placements, and effective marketing strategies to enhance the visibility and sales performance of butter blocks. With the increasing consumer demand for natural, high-quality, and specialty butter blocks, supermarkets and hypermarkets continue to expand their product portfolios, collaborate with manufacturers for exclusive product offerings, and focus on customer service to maintain their leadership in the Butter Blocks Market. Further, the growing trend of online grocery shopping has led supermarkets and hypermarkets to strengthen their e-commerce platforms, offering consumers the convenience of ordering butter blocks online for home delivery or pickup, further boosting the segment's growth and market presence.<h3>Butter Blocks Market Share Analysis: Salted Butter Blocks is the fastest growing segment over the forecast period to 2032</h3>The Salted Butter Blocks segment emerges as the fastest growing category within the Butter Blocks Market, showcasing remarkable growth potential and market expansion prospects through 2032. The growth of the Salted Butter Blocks segment can be attributed to several key factors driving consumer demand and industry trends. Salted butter is a staple ingredient in culinary applications, offering a balanced flavor profile that complements both sweet and savory dishes. This versatility in usage makes salted butter blocks a popular choice among households, bakeries, restaurants, and foodservice establishments. Further, the convenience of pre-measured butter blocks in salted variants simplifies cooking and baking processes, making them ideal for amateur and professional chefs alike. Additionally, the growing consumer preference for natural, minimally processed, and wholesome food products contributes to the increasing demand for salted butter blocks, as they are perceived as more authentic and flavorful compared to other types. Furthermore, manufacturers are focusing on innovation, quality improvements, and sustainable sourcing practices in salted butter block production, aligning with consumer preferences for healthier and environmentally friendly food options. The salted butter blocks segment also benefits from strategic marketing campaigns, product promotions, and expanding distribution channels, enhancing market penetration and consumer accessibility. As a result, the Salted Butter Blocks segment is poised for significant growth in the coming years, driven by evolving consumer tastes, culinary trends, and industry innovations.<h3>Butter Blocks Market Share Analysis: Cooking segment generated the highest revenue share in the industry</h3>The Cooking segment stands out as the largest category within the Butter Blocks Market, commanding a substantial share of the market due to its widespread applications and versatile use in culinary practices. Cooking involves a broad spectrum of food preparation techniques, including frying, sautéing, roasting, and baking, where butter blocks play a crucial role in enhancing flavors, textures, and aromas of various dishes. As a primary cooking fat, butter blocks are preferred by chefs, home cooks, and foodservice professionals for their rich, creamy consistency and ability to add depth and richness to cooked dishes. The Cooking segment encompasses a diverse range of recipes and cuisines that utilize butter blocks as a key ingredient, such as sauces, soups, pastries, desserts, and savory dishes. The segment's dominance is further reinforced by the growing popularity of homemade meals, culinary experimentation, and the influence of cooking shows and social media platforms promoting diverse cooking styles and techniques. Further, manufacturers are focusing on product innovation, packaging convenience, and flavor variations within the Cooking segment, catering to evolving consumer preferences for convenience, quality, and taste. The Cooking segment's robust growth is driven by the continuous demand for butter blocks in cooking applications across households, restaurants, bakeries, and foodservice establishments, making it a pivotal category in the Butter Blocks Market.<h2>Butter Blocks Market Segmentation</h2><Strong>By Distribution Channel</Strong>
Online Stores
Supermarkets/Hypermarkets
Departmental Stores
Convenience Stores
<Strong>By Type</Strong>
Salted
Unsalted
Others
<Strong>By Application</Strong>
Baking
Cooking
Spreading
Flavoring
<Strong>Countries Analyzed</Strong>
North America (US, Canada, Mexico)
Europe (Germany, UK, France, Spain, Italy, Russia, Rest of Europe)
Asia Pacific (China, India, Japan, South Korea, Australia, South East Asia, Rest of Asia)
South America (Brazil, Argentina, Rest of South America)
Middle East and Africa (Saudi Arabia, UAE, Rest of Middle East, South Africa, Egypt, Rest of Africa)<h2>Butter Blocks Companies Profiled in the Study</h2>Arla Foods amba
Danone S.A
Dean Foods
Fonterra Co-operative Group Ltd
Grassland Dairy Products Inc
Kerry Group Plc
Lactalis Group
land o'lakes Inc
Megmilk Snow Brand Co. Ltd
Nestle S.A.
Royal FrieslandCampina N.V.
*- List Not Exhaustive
<Strong>Chapter 1. TABLE OF CONTENTS</Strong>
<Strong>Chapter 2. Introduction to Butter Blocks Market </Strong>
2.1. Market Overview
2.2. Key Statistics and Report Highlights
2.3. Scope of the Comprehensive Study
2.3.1. Market Definition
2.3.2 Countries and Regions Covered
2.3.3 Research Objective
2.3.4 Units, Currency, and Conversions
2.3.5 Industry Value Chain
2.4. Key Market Segments
2.5. Key Companies
2.6. Study Period
<Strong>Chapter 3. Strategic Analysis Review</Strong>
3.1. Butter Blocks Pricing Analysis and Forecast
3.2. Porter’s Five Forces
3.3. Market Ecosystem
3.4. SWOT Analysis
3.5. Regulatory Scenario
3.3. Effects of Inflation, Russia-Ukraine War, moderating economic growth, and other macroeconomic factors
<Strong>Chapter 4. Competitive Landscape</Strong>
4.1. Market Share Analysis
4.1.1. Global Butter Blocks Market Share by Company, 2023
4.1.2. Product Offerings of Leading Butter Blocks Companies
4.2. Market Entropy
4.2.1. New Product Launches in the Industry
4.2.2. Mergers, Acquisitions, Joint ventures, and Partnerships
4.3. Key Strategies and Best Practices
<Strong>Chapter 5. Global Market Projections: Best, Reference, and Low Case Scenarios</Strong>
5.1. Growth Analysis- Case Scenario Definitions
5.2. Low Growth Case Scenario Forecasts
5.3. Reference Growth Case Scenario Forecasts
5.4. High Growth Case Scenario Forecasts
<Strong>Chapter 6. Market Dynamics</Strong>
6.1. Butter Blocks Market Drivers
6.2. Butter Blocks Market Challenges
6.6. Butter Blocks Market Opportunities
6.4. Butter Blocks Market Trends
<Strong>Chapter 7. Global Butter Blocks Market Outlook Trends</Strong>
7.1. Global Butter Blocks Revenue (USD Million) and CAGR (%) by Type (2021-2032)
7.2. Global Butter Blocks Revenue (USD Million) and CAGR (%) by Application (2021-2032)
7.3. Global Butter Blocks Revenue (USD Million) and CAGR (%) by Product (2021-2032)
<Strong>By Distribution Channel</Strong>
Online Stores
Supermarkets/Hypermarkets
Departmental Stores
Convenience Stores
<Strong>By Type</Strong>
Salted
Unsalted
Others
<Strong>By Application</Strong>
Baking
Cooking
Spreading
Flavoring
<Strong>Chapter 8. Global Butter Blocks Regional Analysis and Outlook</Strong>
8.1. Global Butter Blocks Revenue (USD Million) By Regions (2021- 2032)
8.2. North America Butter Blocks Revenue (USD Million) by Country (2021-2032)
8.2.1. United States Butter Blocks Regional Analysis and Outlook
8.2.2. Canada Butter Blocks Regional Analysis and Outlook
8.2.3. Mexico Butter Blocks Regional Analysis and Outlook
8.3. Europe Butter Blocks Revenue (USD Million), by Country (2021-2032)
8.3.1. Germany Butter Blocks Regional Analysis and Outlook
8.3.2. France Butter Blocks Regional Analysis and Outlook
8.3.3. United Kingdom Butter Blocks Regional Analysis and Outlook
8.3.4. Spain Butter Blocks Regional Analysis and Outlook
8.3.5. Italy Butter Blocks Regional Analysis and Outlook
8.3.6. Russia Butter Blocks Regional Analysis and Outlook
8.3.7. Rest of Europe Butter Blocks Regional Analysis and Outlook
8.4. Asia Pacific Butter Blocks Revenue (USD Million) by Country (2021-2032)
8.4.1. China Butter Blocks Regional Analysis and Outlook
8.4.2. Japan Butter Blocks Regional Analysis and Outlook
8.4.3. India Butter Blocks Regional Analysis and Outlook
8.4.4. South Korea Butter Blocks Regional Analysis and Outlook
8.4.5. Australia Butter Blocks Regional Analysis and Outlook
8.4.6. South East Asia Butter Blocks Regional Analysis and Outlook
8.4.7. Rest of Asia Pacific Butter Blocks Regional Analysis and Outlook
8.5. South America Butter Blocks Revenue (USD Million), by Country (2021-2032)
8.5.1. Brazil Butter Blocks Regional Analysis and Outlook
8.5.2. Argentina Butter Blocks Regional Analysis and Outlook
8.5.3. Rest of South America Butter Blocks Regional Analysis and Outlook
8.6. Middle East and Africa Butter Blocks Revenue (USD Million) by Country (2021-2032)
8.6.1. Middle East Butter Blocks Regional Analysis and Outlook
8.6.2. Africa Butter Blocks Regional Analysis and Outlook
<Strong>Chapter 9. North America Butter Blocks Analysis and Outlook</Strong>
9.1. North America Butter Blocks Revenue (USD Million) by Segments (2021-2032)
9.1.1. North America Butter Blocks Revenue (USD Million) by Type (2021-2032)
9.1.2. North America Butter Blocks Revenue (USD Million) by Application (2021-2032)
9.1.3. North America Butter Blocks Revenue (USD Million) by Product (2021-2032)
<Strong>By Distribution Channel</Strong>
Online Stores
Supermarkets/Hypermarkets
Departmental Stores
Convenience Stores
<Strong>By Type</Strong>
Salted
Unsalted
Others
<Strong>By Application</Strong>
Baking
Cooking
Spreading
Flavoring
<Strong>Chapter 10. Europe Butter Blocks Analysis and Outlook</Strong>
10.1. Europe Butter Blocks Revenue (USD Million), by Segments (USD Million) (2021-2032)
10.1.1. Europe Butter Blocks Revenue (USD Million) by Type (2021-2032)
10.1.2. Europe Butter Blocks Revenue (USD Million) by Application (2021-2032)
10.1.3. Europe Butter Blocks Revenue (USD Million) by Product (2021-2032)
<Strong>By Distribution Channel</Strong>
Online Stores
Supermarkets/Hypermarkets
Departmental Stores
Convenience Stores
<Strong>By Type</Strong>
Salted
Unsalted
Others
<Strong>By Application</Strong>
Baking
Cooking
Spreading
Flavoring
<Strong>Chapter 11. Asia Pacific Butter Blocks Analysis and Outlook</Strong>
11.1. Asia Pacific Butter Blocks Revenue (USD Million), and Revenue (USD Million) by Segments (2021-2032)
11.1.1. Asia Pacific Butter Blocks Revenue (USD Million) by Type (2021-2032)
11.1.2. Asia Pacific Butter Blocks Revenue (USD Million) by Application (2021-2032)
11.1.3. Asia Pacific Butter Blocks Revenue (USD Million) by Product (2021-2032)
<Strong>By Distribution Channel</Strong>
Online Stores
Supermarkets/Hypermarkets
Departmental Stores
Convenience Stores
<Strong>By Type</Strong>
Salted
Unsalted
Others
<Strong>By Application</Strong>
Baking
Cooking
Spreading
Flavoring
<Strong>Chapter 12. South America Butter Blocks Analysis and Outlook</Strong>
12.1. South America Butter Blocks Revenue (USD Million), by Segments (2021-2032)
12.1.1. South America Butter Blocks Revenue (USD Million) by Type (2021-2032)
12.1.2. South America Butter Blocks Revenue (USD Million) by Application (2021-2032)
12.1.3. South America Butter Blocks Revenue (USD Million) by Product (2021-2032)
<Strong>By Distribution Channel</Strong>
Online Stores
Supermarkets/Hypermarkets
Departmental Stores
Convenience Stores
<Strong>By Type</Strong>
Salted
Unsalted
Others
<Strong>By Application</Strong>
Baking
Cooking
Spreading
Flavoring
<Strong>Chapter 13. Middle East and Africa Butter Blocks Analysis and Outlook</Strong>
13.1. Middle East and Africa Butter Blocks Revenue (USD Million), by Segments (2021-2032)
13.1.1. Middle East and Africa Butter Blocks Revenue (USD Million) by Type (2021-2032)
13.1.2. Middle East and Africa Butter Blocks Revenue (USD Million) by Application (2021-2032)
13.1.3. Middle East and Africa Butter Blocks Revenue (USD Million) by Product (2021-2032)
<Strong>By Distribution Channel</Strong>
Online Stores
Supermarkets/Hypermarkets
Departmental Stores
Convenience Stores
<Strong>By Type</Strong>
Salted
Unsalted
Others
<Strong>By Application</Strong>
Baking
Cooking
Spreading
Flavoring
<Strong>Chapter 14. Butter Blocks Company Profiles</Strong>
14.1 Business Overview
14.2 Product Profiles
14.3 SWOT Profiles
14.5 Recent Developments
14.6 Financial Profile
List of Companies
Arla Foods amba
Danone S.A
Dean Foods
Fonterra Co-operative Group Ltd
Grassland Dairy Products Inc
Kerry Group Plc
Lactalis Group
land o'lakes Inc
Megmilk Snow Brand Co. Ltd
Nestle S.A.
Royal FrieslandCampina N.V.
<Strong>15. Methodology and Data Sources</Strong>
15.1 Customization Offerings
15.2 Subscription Services
15.3 Related Reports
15.4 Publisher Expertise
<Strong>LIST OF TABLES</Strong>
Table 1 Market Segmentation Analysis
Table 2 Global Butter Blocks Market Share of Leading Companies, 2023
Table 3 Product Offerings of Leading Companies
Table 4 Low Growth Scenario Forecasts
Table 5 Reference Case Growth Scenario
Table 6 High Growth Case Scenario
Table 7 Global Butter Blocks Revenue (USD Million) And CAGR (%) By Type (2021-2032)
Table 8 Global Butter Blocks Revenue (USD Million) And CAGR (%) By Application (2021-2032)
Table 9 Global Butter Blocks Revenue (USD Million) And CAGR (%) By Product (2021-2032)
Table 10 Global Butter Blocks Market Revenue (USD Million) By Regions (2021-2032)
Table 11 Global Butter Blocks Market Share (%) By Regions (2021-2032)
Table 12 North America Butter Blocks Revenue (USD Million) By Country (2021-2032)
Table 13 Europe Butter Blocks Revenue (USD Million) By Country (2021-2032)
Table 14 Asia Pacific Butter Blocks Revenue (USD Million) By Country (2021-2032)
Table 15 South America Butter Blocks Revenue (USD Million) By Country (2021-2032)
Table 16 Middle East and Africa Butter Blocks Revenue (USD Million) By Region (2021-2032)
Table 17 North America Butter Blocks Revenue (USD Million) By Type (2021-2032)
Table 18 North America Butter Blocks Revenue (USD Million) By Application (2021-2032)
Table 19 North America Butter Blocks Revenue (USD Million) By Product (2021-2032)
Table 20 Europe Butter Blocks Revenue (USD Million) By Type (2021-2032)
Table 21 Europe Butter Blocks Revenue (USD Million) By Application (2021-2032)
Table 22 Europe Butter Blocks Revenue (USD Million) By Product (2021-2032)
Table 23 Asia Pacific Butter Blocks Revenue (USD Million) By Type (2021-2032)
Table 24 Asia Pacific Butter Blocks Revenue (USD Million) By Application (2021-2032)
Table 25 Asia Pacific Butter Blocks Revenue (USD Million) By Product (2021-2032)
Table 26 South America Butter Blocks Revenue (USD Million) By Type (2021-2032)
Table 27 South America Butter Blocks Revenue (USD Million) By Application (2021-2032)
Table 28 South America Butter Blocks Revenue (USD Million) By Product (2021-2032)
Table 29 Middle East and Africa Butter Blocks Revenue (USD Million) By Type (2021-2032)
Table 30 Middle East and Africa Butter Blocks Revenue (USD Million) By Application (2021-2032)
Table 31 Middle East and Africa Butter Blocks Revenue (USD Million) By Product (2021-2032)
<Strong>LIST OF FIGURES</Strong>
Figure 1. Market Scope
Figure 2. Pricing Forecasts Per Unit, 2023- 2032
Figure 3. Porter’s Five Forces
Figure 4. Global Butter Blocks Market Revenue (USD Million) By Regions (2021-2032)
Figure 5. Global Butter Blocks Market Share (%) By Regions (2023)
Figure 6. North America Butter Blocks Revenue (USD Million) By Country (2021-2032)
Figure 7. United States Butter Blocks Revenue (USD Million) By Country (2021-2032)
Figure 8. Canada Butter Blocks Revenue (USD Million) By Country (2021-2032)
Figure 9. Mexico Butter Blocks Revenue (USD Million) By Country (2021-2032)
Figure 10. Europe Butter Blocks Revenue (USD Million) By Country (2021-2032)
Figure 11. Germany Butter Blocks Revenue (USD Million) By Country (2021-2032)
Figure 12. France Butter Blocks Revenue (USD Million) By Country (2021-2032)
Figure 13. United Kingdom Butter Blocks Revenue (USD Million) By Country (2021-2032)
Figure 14. Spain Butter Blocks Revenue (USD Million) By Country (2021-2032)
Figure 15. Italy Butter Blocks Revenue (USD Million) By Country (2021-2032)
Figure 16. Russia Butter Blocks Revenue (USD Million) By Country (2021-2032)
Figure 17. Rest of Europe Butter Blocks Revenue (USD Million) By Country (2021-2032)
Figure 11. Asia Pacific Butter Blocks Revenue (USD Million) By Country (2021-2032)
Figure 12. China Butter Blocks Revenue (USD Million) By Country (2021-2032)
Figure 13. Japan Butter Blocks Revenue (USD Million) By Country (2021-2032)
Figure 14. India Butter Blocks Revenue (USD Million) By Country (2021-2032)
Figure 15. South Korea Butter Blocks Revenue (USD Million) By Country (2021-2032)
Figure 16. Australia Butter Blocks Revenue (USD Million) By Country (2021-2032)
Figure 17. South East Asia Butter Blocks Revenue (USD Million) By Country (2021-2032)
Figure 18. South America Butter Blocks Revenue (USD Million) By Country (2021-2032)
Figure 19. Brazil Butter Blocks Revenue (USD Million) By Country (2021-2032)
Figure 20. Argentina Butter Blocks Revenue (USD Million) By Country (2021-2032)
Figure 21. Rest of Asia Pacific Butter Blocks Revenue (USD Million) By Country (2021-2032)
Figure 22. Middle East and Africa Butter Blocks Revenue (USD Million) By Region (2021-2032)
Figure 23. Saudi Arabia Butter Blocks Revenue (USD Million) By Region (2021-2032)
Figure 24. The UAE Butter Blocks Revenue (USD Million) By Region (2021-2032)
Figure 25. Rest of Middle East Butter Blocks Revenue (USD Million) By Region (2021-2032)
Figure 26. South Africa Butter Blocks Revenue (USD Million) By Region (2021-2032)
Figure 27. Africa Butter Blocks Revenue (USD Million) By Region (2021-2032)
Figure 28. North America Butter Blocks Revenue (USD Million) By Type (2021-2032)
Figure 29. North America Butter Blocks Revenue (USD Million) By Application (2021-2032)
Figure 30. North America Butter Blocks Revenue (USD Million) By Product (2021-2032)
Figure 31. Europe Butter Blocks Revenue (USD Million) By Type (2021-2032)
Figure 32. Europe Butter Blocks Revenue (USD Million) By Application (2021-2032)
Figure 33. Europe Butter Blocks Revenue (USD Million) By Product (2021-2032)
Figure 34. Asia Pacific Butter Blocks Revenue (USD Million) By Type (2021-2032)
Figure 35. Asia Pacific Butter Blocks Revenue (USD Million) By Application (2021-2032)
Figure 36. Asia Pacific Butter Blocks Revenue (USD Million) By Product (2021-2032)
Figure 37. South America Butter Blocks Revenue (USD Million) By Type (2021-2032)
Figure 38. South America Butter Blocks Revenue (USD Million) By Application (2021-2032)
Figure 39. South America Butter Blocks Revenue (USD Million) By Product (2021-2032)
Figure 40. Middle East and Africa Butter Blocks Revenue (USD Million) By Type (2021-2032)
Figure 41. Middle East and Africa Butter Blocks Revenue (USD Million) By Application (2021-2032)
Figure 42. Middle East and Africa Butter Blocks Revenue (USD Million) By Product (2021-2032)
