<h3><Strong><i>Global Butter Fat Fraction Market Size is valued at $182.1 Million in 2024 and is forecast to register a growth rate (CAGR) of 7.3% to reach $320 Million by 2032.</h3></Strong></i>The global Butter Fat Fraction Market Comprehensive Study analyzes and forecasts the market size across 6 regions and 24 countries for diverse segments -By Ingredient (Milk Fat Globule Membrane, Phospholipid, Ganglioside Fraction), By Application (Confectionery, Bakery, Nutraceuticals, Others)
<h2>An Introduction to Butter Fat Fraction Market</h2>The Butter Fat Fraction market in 2024 is expanding steadily, driven by its applications in the food, bakery, and confectionery industries. Butter fat fractions, which are separated into high-melting and low-melting components, are used to improve the texture, stability, and mouthfeel of various products. The market is supported by the increasing demand for premium and high-quality ingredients that enhance the sensory attributes of food products. Advances in fractionation technology are improving the efficiency and quality of butter fat fractions. The market is also benefiting from the trend towards clean-label and natural ingredients, appealing to manufacturers and consumers seeking superior food quality and performance.
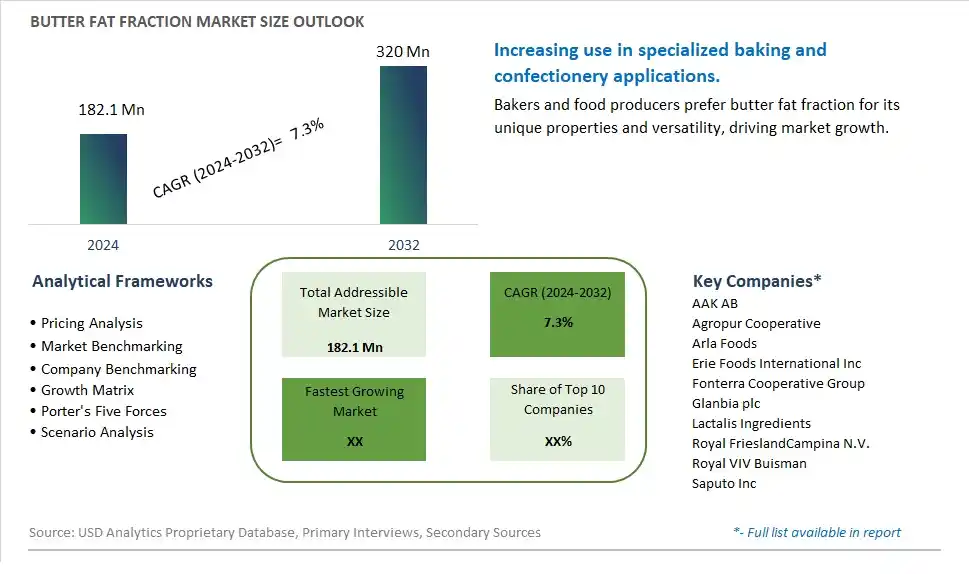
<h2>Butter Fat Fraction Competitive Landscape</h2>The market report analyses the leading companies in the industry including AAK AB, Agropur Cooperative, Arla Foods, Erie Foods International Inc, Fonterra Cooperative Group, Glanbia plc, Lactalis Ingredients, Royal FrieslandCampina N.V., Royal VIV Buisman, Saputo Inc, and Others.<h2>Butter Fat Fraction Market Dynamics</h2><h3>Butter Fat Fraction Market Trend: Growing Demand for Specialty Dairy Products</h3>One prominent market trend in the Butter Fat Fraction market is the growing demand for specialty dairy products. Consumers are increasingly seeking premium and differentiated dairy offerings, including butter fat fractions that offer specific functional properties and enhanced nutritional benefits. This trend is driven by a rising awareness of the nutritional value of dairy fats and the desire for high-quality ingredients in food and beverage formulations.<h3>Butter Fat Fraction Market Driver: Application Versatility in Food Industry</h3>The market driver for Butter Fat Fraction is its application versatility in the food industry. Butter fat fractions are valued for their unique properties, such as improved spreadability, stability, and flavor enhancement. Food manufacturers utilize butter fat fractions in a wide range of products, including bakery goods, confectionery items, sauces, and spreads, to achieve desired texture, taste, and functionality. This versatility drives the demand for butter fat fractions as a key ingredient in various food applications.<h3>Butter Fat Fraction Market Opportunity: Innovation in Functional Ingredients</h3>An opportunity within the Butter Fat Fraction market lies in innovation with functional ingredients. Manufacturers can explore incorporating functional additives or fortifying butter fat fractions with bioactive compounds like omega-3 fatty acids, vitamins, or antioxidants to create value-added products with enhanced health benefits. Developing butter fat fractions tailored for specific dietary needs, such as low-lactose or high-protein variants, can also cater to niche consumer segments and expand market reach. By leveraging innovation in functional ingredients, companies can capitalize on the growing demand for healthier and more functional dairy products.<h3>Butter Fat Fraction Market Share Analysis: Milk Fat Globule Membrane (MFGM) segment generated the highest revenue share in the industry</h3>The Milk Fat Globule Membrane (MFGM) segment stands out as the largest category within the Butter Fat Fraction Market, showcasing substantial market share and robust growth prospects. MFGM, a complex mixture of lipids and proteins surrounding milk fat globules, is gaining significant traction due to its diverse applications and nutritional benefits. This segment's dominance is primarily driven by its widespread use in infant formula and baby food products, where MFGM is valued for its role in supporting brain development, cognitive function, and overall infant health. The growing awareness among parents and healthcare professionals about the importance of MFGM in early childhood nutrition has fueled the demand for MFGM-enriched products, driving the segment's market share. Further, the versatility of MFGM in functional foods, dietary supplements, and sports nutrition further contributes to its market leadership. Manufacturers are increasingly incorporating MFGM into a range of food and beverage formulations, capitalizing on its functional properties and health benefits to meet consumer demand for premium and nutritionally enhanced products. As the emphasis on health and wellness continues to grow globally, the Milk Fat Globule Membrane segment is poised for continued expansion, solidifying its position as the largest segment in the Butter Fat Fraction Market.<h3>Butter Fat Fraction Market Share Analysis: Nutraceuticals Application is the fastest growing segment over the forecast period to 2032</h3>The Nutraceuticals Application segment emerges as the fastest-growing category within the Butter Fat Fraction Market, exhibiting remarkable growth potential and transformative trends shaping the industry until 2032. This segment's rapid expansion is fueled by several key factors driving consumer preferences and market dynamics in the health and wellness sector. Firstly, the increasing awareness and adoption of functional foods and dietary supplements among health-conscious consumers are driving demand for butter fat fraction ingredients in nutraceutical formulations. Butter fat fractions, particularly those enriched with bioactive components like Milk Fat Globule Membrane (MFGM), phospholipids, and gangliosides, are recognized for their potential health benefits, including cognitive enhancement, cardiovascular health, and immune system support. As consumers prioritize preventive healthcare and seek natural ingredients with functional properties, the demand for butter fat fractions in nutraceutical applications is witnessing significant growth. Further, ongoing research and innovation in the nutraceutical industry, coupled with regulatory support for health claims related to butter fat fraction ingredients, are further propelling the segment's expansion. The Nutraceuticals Application segment is poised to experience robust growth as manufacturers develop innovative products and formulations targeting specific health concerns, driving the adoption of butter fat fraction ingredients in the nutraceutical sector.<h2>Butter Fat Fraction Market Segmentation</h2><Strong>By Ingredient</Strong>
Milk Fat Globule Membrane
Phospholipid
Ganglioside Fraction
<Strong>By Application</Strong>
Confectionery
Bakery
Nutraceuticals
Others
<Strong>Countries Analyzed</Strong>
North America (US, Canada, Mexico)
Europe (Germany, UK, France, Spain, Italy, Russia, Rest of Europe)
Asia Pacific (China, India, Japan, South Korea, Australia, South East Asia, Rest of Asia)
South America (Brazil, Argentina, Rest of South America)
Middle East and Africa (Saudi Arabia, UAE, Rest of Middle East, South Africa, Egypt, Rest of Africa)<h2>Butter Fat Fraction Companies Profiled in the Study</h2>AAK AB
Agropur Cooperative
Arla Foods
Erie Foods International Inc
Fonterra Cooperative Group
Glanbia plc
Lactalis Ingredients
Royal FrieslandCampina N.V.
Royal VIV Buisman
Saputo Inc
*- List Not Exhaustive
<Strong>Chapter 1. TABLE OF CONTENTS</Strong>
<Strong>Chapter 2. Introduction to Butter Fat Fraction Market </Strong>
2.1. Market Overview
2.2. Key Statistics and Report Highlights
2.3. Scope of the Comprehensive Study
2.3.1. Market Definition
2.3.2 Countries and Regions Covered
2.3.3 Research Objective
2.3.4 Units, Currency, and Conversions
2.3.5 Industry Value Chain
2.4. Key Market Segments
2.5. Key Companies
2.6. Study Period
<Strong>Chapter 3. Strategic Analysis Review</Strong>
3.1. Butter Fat Fraction Pricing Analysis and Forecast
3.2. Porter’s Five Forces
3.3. Market Ecosystem
3.4. SWOT Analysis
3.5. Regulatory Scenario
3.3. Effects of Inflation, Russia-Ukraine War, moderating economic growth, and other macroeconomic factors
<Strong>Chapter 4. Competitive Landscape</Strong>
4.1. Market Share Analysis
4.1.1. Global Butter Fat Fraction Market Share by Company, 2023
4.1.2. Product Offerings of Leading Butter Fat Fraction Companies
4.2. Market Entropy
4.2.1. New Product Launches in the Industry
4.2.2. Mergers, Acquisitions, Joint ventures, and Partnerships
4.3. Key Strategies and Best Practices
<Strong>Chapter 5. Global Market Projections: Best, Reference, and Low Case Scenarios</Strong>
5.1. Growth Analysis- Case Scenario Definitions
5.2. Low Growth Case Scenario Forecasts
5.3. Reference Growth Case Scenario Forecasts
5.4. High Growth Case Scenario Forecasts
<Strong>Chapter 6. Market Dynamics</Strong>
6.1. Butter Fat Fraction Market Drivers
6.2. Butter Fat Fraction Market Challenges
6.6. Butter Fat Fraction Market Opportunities
6.4. Butter Fat Fraction Market Trends
<Strong>Chapter 7. Global Butter Fat Fraction Market Outlook Trends</Strong>
7.1. Global Butter Fat Fraction Revenue (USD Million) and CAGR (%) by Type (2021-2032)
7.2. Global Butter Fat Fraction Revenue (USD Million) and CAGR (%) by Application (2021-2032)
7.3. Global Butter Fat Fraction Revenue (USD Million) and CAGR (%) by Product (2021-2032)
<Strong>By Ingredient</Strong>
Milk Fat Globule Membrane
Phospholipid
Ganglioside Fraction
<Strong>By Application</Strong>
Confectionery
Bakery
Nutraceuticals
Others
<Strong>Chapter 8. Global Butter Fat Fraction Regional Analysis and Outlook</Strong>
8.1. Global Butter Fat Fraction Revenue (USD Million) By Regions (2021- 2032)
8.2. North America Butter Fat Fraction Revenue (USD Million) by Country (2021-2032)
8.2.1. United States Butter Fat Fraction Regional Analysis and Outlook
8.2.2. Canada Butter Fat Fraction Regional Analysis and Outlook
8.2.3. Mexico Butter Fat Fraction Regional Analysis and Outlook
8.3. Europe Butter Fat Fraction Revenue (USD Million), by Country (2021-2032)
8.3.1. Germany Butter Fat Fraction Regional Analysis and Outlook
8.3.2. France Butter Fat Fraction Regional Analysis and Outlook
8.3.3. United Kingdom Butter Fat Fraction Regional Analysis and Outlook
8.3.4. Spain Butter Fat Fraction Regional Analysis and Outlook
8.3.5. Italy Butter Fat Fraction Regional Analysis and Outlook
8.3.6. Russia Butter Fat Fraction Regional Analysis and Outlook
8.3.7. Rest of Europe Butter Fat Fraction Regional Analysis and Outlook
8.4. Asia Pacific Butter Fat Fraction Revenue (USD Million) by Country (2021-2032)
8.4.1. China Butter Fat Fraction Regional Analysis and Outlook
8.4.2. Japan Butter Fat Fraction Regional Analysis and Outlook
8.4.3. India Butter Fat Fraction Regional Analysis and Outlook
8.4.4. South Korea Butter Fat Fraction Regional Analysis and Outlook
8.4.5. Australia Butter Fat Fraction Regional Analysis and Outlook
8.4.6. South East Asia Butter Fat Fraction Regional Analysis and Outlook
8.4.7. Rest of Asia Pacific Butter Fat Fraction Regional Analysis and Outlook
8.5. South America Butter Fat Fraction Revenue (USD Million), by Country (2021-2032)
8.5.1. Brazil Butter Fat Fraction Regional Analysis and Outlook
8.5.2. Argentina Butter Fat Fraction Regional Analysis and Outlook
8.5.3. Rest of South America Butter Fat Fraction Regional Analysis and Outlook
8.6. Middle East and Africa Butter Fat Fraction Revenue (USD Million) by Country (2021-2032)
8.6.1. Middle East Butter Fat Fraction Regional Analysis and Outlook
8.6.2. Africa Butter Fat Fraction Regional Analysis and Outlook
<Strong>Chapter 9. North America Butter Fat Fraction Analysis and Outlook</Strong>
9.1. North America Butter Fat Fraction Revenue (USD Million) by Segments (2021-2032)
9.1.1. North America Butter Fat Fraction Revenue (USD Million) by Type (2021-2032)
9.1.2. North America Butter Fat Fraction Revenue (USD Million) by Application (2021-2032)
9.1.3. North America Butter Fat Fraction Revenue (USD Million) by Product (2021-2032)
<Strong>By Ingredient</Strong>
Milk Fat Globule Membrane
Phospholipid
Ganglioside Fraction
<Strong>By Application</Strong>
Confectionery
Bakery
Nutraceuticals
Others
<Strong>Chapter 10. Europe Butter Fat Fraction Analysis and Outlook</Strong>
10.1. Europe Butter Fat Fraction Revenue (USD Million), by Segments (USD Million) (2021-2032)
10.1.1. Europe Butter Fat Fraction Revenue (USD Million) by Type (2021-2032)
10.1.2. Europe Butter Fat Fraction Revenue (USD Million) by Application (2021-2032)
10.1.3. Europe Butter Fat Fraction Revenue (USD Million) by Product (2021-2032)
<Strong>By Ingredient</Strong>
Milk Fat Globule Membrane
Phospholipid
Ganglioside Fraction
<Strong>By Application</Strong>
Confectionery
Bakery
Nutraceuticals
Others
<Strong>Chapter 11. Asia Pacific Butter Fat Fraction Analysis and Outlook</Strong>
11.1. Asia Pacific Butter Fat Fraction Revenue (USD Million), and Revenue (USD Million) by Segments (2021-2032)
11.1.1. Asia Pacific Butter Fat Fraction Revenue (USD Million) by Type (2021-2032)
11.1.2. Asia Pacific Butter Fat Fraction Revenue (USD Million) by Application (2021-2032)
11.1.3. Asia Pacific Butter Fat Fraction Revenue (USD Million) by Product (2021-2032)
<Strong>By Ingredient</Strong>
Milk Fat Globule Membrane
Phospholipid
Ganglioside Fraction
<Strong>By Application</Strong>
Confectionery
Bakery
Nutraceuticals
Others
<Strong>Chapter 12. South America Butter Fat Fraction Analysis and Outlook</Strong>
12.1. South America Butter Fat Fraction Revenue (USD Million), by Segments (2021-2032)
12.1.1. South America Butter Fat Fraction Revenue (USD Million) by Type (2021-2032)
12.1.2. South America Butter Fat Fraction Revenue (USD Million) by Application (2021-2032)
12.1.3. South America Butter Fat Fraction Revenue (USD Million) by Product (2021-2032)
<Strong>By Ingredient</Strong>
Milk Fat Globule Membrane
Phospholipid
Ganglioside Fraction
<Strong>By Application</Strong>
Confectionery
Bakery
Nutraceuticals
Others
<Strong>Chapter 13. Middle East and Africa Butter Fat Fraction Analysis and Outlook</Strong>
13.1. Middle East and Africa Butter Fat Fraction Revenue (USD Million), by Segments (2021-2032)
13.1.1. Middle East and Africa Butter Fat Fraction Revenue (USD Million) by Type (2021-2032)
13.1.2. Middle East and Africa Butter Fat Fraction Revenue (USD Million) by Application (2021-2032)
13.1.3. Middle East and Africa Butter Fat Fraction Revenue (USD Million) by Product (2021-2032)
<Strong>By Ingredient</Strong>
Milk Fat Globule Membrane
Phospholipid
Ganglioside Fraction
<Strong>By Application</Strong>
Confectionery
Bakery
Nutraceuticals
Others
<Strong>Chapter 14. Butter Fat Fraction Company Profiles</Strong>
14.1 Business Overview
14.2 Product Profiles
14.3 SWOT Profiles
14.5 Recent Developments
14.6 Financial Profile
List of Companies
AAK AB
Agropur Cooperative
Arla Foods
Erie Foods International Inc
Fonterra Cooperative Group
Glanbia plc
Lactalis Ingredients
Royal FrieslandCampina N.V.
Royal VIV Buisman
Saputo Inc
<Strong>15. Methodology and Data Sources</Strong>
15.1 Customization Offerings
15.2 Subscription Services
15.3 Related Reports
15.4 Publisher Expertise
<Strong>LIST OF TABLES</Strong>
Table 1 Market Segmentation Analysis
Table 2 Global Butter Fat Fraction Market Share of Leading Companies, 2023
Table 3 Product Offerings of Leading Companies
Table 4 Low Growth Scenario Forecasts
Table 5 Reference Case Growth Scenario
Table 6 High Growth Case Scenario
Table 7 Global Butter Fat Fraction Revenue (USD Million) And CAGR (%) By Type (2021-2032)
Table 8 Global Butter Fat Fraction Revenue (USD Million) And CAGR (%) By Application (2021-2032)
Table 9 Global Butter Fat Fraction Revenue (USD Million) And CAGR (%) By Product (2021-2032)
Table 10 Global Butter Fat Fraction Market Revenue (USD Million) By Regions (2021-2032)
Table 11 Global Butter Fat Fraction Market Share (%) By Regions (2021-2032)
Table 12 North America Butter Fat Fraction Revenue (USD Million) By Country (2021-2032)
Table 13 Europe Butter Fat Fraction Revenue (USD Million) By Country (2021-2032)
Table 14 Asia Pacific Butter Fat Fraction Revenue (USD Million) By Country (2021-2032)
Table 15 South America Butter Fat Fraction Revenue (USD Million) By Country (2021-2032)
Table 16 Middle East and Africa Butter Fat Fraction Revenue (USD Million) By Region (2021-2032)
Table 17 North America Butter Fat Fraction Revenue (USD Million) By Type (2021-2032)
Table 18 North America Butter Fat Fraction Revenue (USD Million) By Application (2021-2032)
Table 19 North America Butter Fat Fraction Revenue (USD Million) By Product (2021-2032)
Table 20 Europe Butter Fat Fraction Revenue (USD Million) By Type (2021-2032)
Table 21 Europe Butter Fat Fraction Revenue (USD Million) By Application (2021-2032)
Table 22 Europe Butter Fat Fraction Revenue (USD Million) By Product (2021-2032)
Table 23 Asia Pacific Butter Fat Fraction Revenue (USD Million) By Type (2021-2032)
Table 24 Asia Pacific Butter Fat Fraction Revenue (USD Million) By Application (2021-2032)
Table 25 Asia Pacific Butter Fat Fraction Revenue (USD Million) By Product (2021-2032)
Table 26 South America Butter Fat Fraction Revenue (USD Million) By Type (2021-2032)
Table 27 South America Butter Fat Fraction Revenue (USD Million) By Application (2021-2032)
Table 28 South America Butter Fat Fraction Revenue (USD Million) By Product (2021-2032)
Table 29 Middle East and Africa Butter Fat Fraction Revenue (USD Million) By Type (2021-2032)
Table 30 Middle East and Africa Butter Fat Fraction Revenue (USD Million) By Application (2021-2032)
Table 31 Middle East and Africa Butter Fat Fraction Revenue (USD Million) By Product (2021-2032)
<Strong>LIST OF FIGURES</Strong>
Figure 1. Market Scope
Figure 2. Pricing Forecasts Per Unit, 2023- 2032
Figure 3. Porter’s Five Forces
Figure 4. Global Butter Fat Fraction Market Revenue (USD Million) By Regions (2021-2032)
Figure 5. Global Butter Fat Fraction Market Share (%) By Regions (2023)
Figure 6. North America Butter Fat Fraction Revenue (USD Million) By Country (2021-2032)
Figure 7. United States Butter Fat Fraction Revenue (USD Million) By Country (2021-2032)
Figure 8. Canada Butter Fat Fraction Revenue (USD Million) By Country (2021-2032)
Figure 9. Mexico Butter Fat Fraction Revenue (USD Million) By Country (2021-2032)
Figure 10. Europe Butter Fat Fraction Revenue (USD Million) By Country (2021-2032)
Figure 11. Germany Butter Fat Fraction Revenue (USD Million) By Country (2021-2032)
Figure 12. France Butter Fat Fraction Revenue (USD Million) By Country (2021-2032)
Figure 13. United Kingdom Butter Fat Fraction Revenue (USD Million) By Country (2021-2032)
Figure 14. Spain Butter Fat Fraction Revenue (USD Million) By Country (2021-2032)
Figure 15. Italy Butter Fat Fraction Revenue (USD Million) By Country (2021-2032)
Figure 16. Russia Butter Fat Fraction Revenue (USD Million) By Country (2021-2032)
Figure 17. Rest of Europe Butter Fat Fraction Revenue (USD Million) By Country (2021-2032)
Figure 11. Asia Pacific Butter Fat Fraction Revenue (USD Million) By Country (2021-2032)
Figure 12. China Butter Fat Fraction Revenue (USD Million) By Country (2021-2032)
Figure 13. Japan Butter Fat Fraction Revenue (USD Million) By Country (2021-2032)
Figure 14. India Butter Fat Fraction Revenue (USD Million) By Country (2021-2032)
Figure 15. South Korea Butter Fat Fraction Revenue (USD Million) By Country (2021-2032)
Figure 16. Australia Butter Fat Fraction Revenue (USD Million) By Country (2021-2032)
Figure 17. South East Asia Butter Fat Fraction Revenue (USD Million) By Country (2021-2032)
Figure 18. South America Butter Fat Fraction Revenue (USD Million) By Country (2021-2032)
Figure 19. Brazil Butter Fat Fraction Revenue (USD Million) By Country (2021-2032)
Figure 20. Argentina Butter Fat Fraction Revenue (USD Million) By Country (2021-2032)
Figure 21. Rest of Asia Pacific Butter Fat Fraction Revenue (USD Million) By Country (2021-2032)
Figure 22. Middle East and Africa Butter Fat Fraction Revenue (USD Million) By Region (2021-2032)
Figure 23. Saudi Arabia Butter Fat Fraction Revenue (USD Million) By Region (2021-2032)
Figure 24. The UAE Butter Fat Fraction Revenue (USD Million) By Region (2021-2032)
Figure 25. Rest of Middle East Butter Fat Fraction Revenue (USD Million) By Region (2021-2032)
Figure 26. South Africa Butter Fat Fraction Revenue (USD Million) By Region (2021-2032)
Figure 27. Africa Butter Fat Fraction Revenue (USD Million) By Region (2021-2032)
Figure 28. North America Butter Fat Fraction Revenue (USD Million) By Type (2021-2032)
Figure 29. North America Butter Fat Fraction Revenue (USD Million) By Application (2021-2032)
Figure 30. North America Butter Fat Fraction Revenue (USD Million) By Product (2021-2032)
Figure 31. Europe Butter Fat Fraction Revenue (USD Million) By Type (2021-2032)
Figure 32. Europe Butter Fat Fraction Revenue (USD Million) By Application (2021-2032)
Figure 33. Europe Butter Fat Fraction Revenue (USD Million) By Product (2021-2032)
Figure 34. Asia Pacific Butter Fat Fraction Revenue (USD Million) By Type (2021-2032)
Figure 35. Asia Pacific Butter Fat Fraction Revenue (USD Million) By Application (2021-2032)
Figure 36. Asia Pacific Butter Fat Fraction Revenue (USD Million) By Product (2021-2032)
Figure 37. South America Butter Fat Fraction Revenue (USD Million) By Type (2021-2032)
Figure 38. South America Butter Fat Fraction Revenue (USD Million) By Application (2021-2032)
Figure 39. South America Butter Fat Fraction Revenue (USD Million) By Product (2021-2032)
Figure 40. Middle East and Africa Butter Fat Fraction Revenue (USD Million) By Type (2021-2032)
Figure 41. Middle East and Africa Butter Fat Fraction Revenue (USD Million) By Application (2021-2032)
Figure 42. Middle East and Africa Butter Fat Fraction Revenue (USD Million) By Product (2021-2032)
