<h3><Strong><i>Global Butterfly Pea Flower Tea Market Size is valued at $138.2 Million in 2024 and is forecast to register a growth rate (CAGR) of 6.1% to reach $221.9 Million by 2032.</h3></Strong></i>The global Butterfly Pea Flower Tea Market Comprehensive Study analyzes and forecasts the market size across 6 regions and 24 countries for diverse segments -By Application (Supermarket, Departmental Stores, Convenience Stores, Online Retail, Others), By Product (Organic, Conventional)
<h2>An Introduction to Butterfly Pea Flower Tea Market</h2>The Butterfly Pea Flower Tea market in 2024 is witnessing robust growth, driven by the increasing demand for natural and health-boosting beverages. Butterfly pea flower tea, known for its vibrant blue color and antioxidant properties, is gaining popularity for its unique appearance and health benefits, including anti-inflammatory and cognitive-enhancing effects. The market is supported by the growing trend towards herbal and functional teas. Advances in cultivation and processing technologies are enhancing the quality, flavor, and shelf life of butterfly pea flower tea. The market is also benefiting from the trend towards clean-label and visually appealing beverages that offer both aesthetic and health benefits.
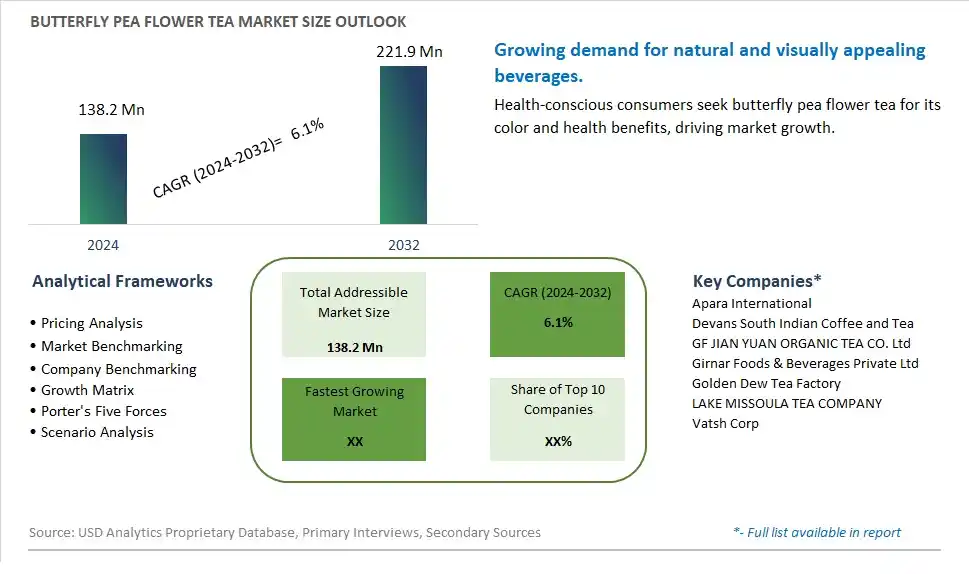
<h2>Butterfly Pea Flower Tea Competitive Landscape</h2>The market report analyses the leading companies in the industry including Apara International, Devans South Indian Coffee and Tea, GF JIAN YUAN ORGANIC TEA CO. Ltd, Girnar Foods & Beverages Private Ltd, Golden Dew Tea Factory, LAKE MISSOULA TEA COMPANY, Vatsh Corp, and Others.<h2>Butterfly Pea Flower Tea Market Dynamics</h2><h3>Butterfly Pea Flower Tea Market Trend: Rising Popularity of Natural and Functional Beverages</h3>One prominent market trend in the Butterfly Pea Flower Tea market is the rising popularity of natural and functional beverages. Consumers are increasingly seeking healthier and more natural alternatives to traditional beverages, leading to a growing interest in botanical-infused drinks like butterfly pea flower tea. This trend is driven by a shift towards wellness-oriented lifestyles and a preference for beverages with functional benefits such as antioxidant properties and stress-relieving effects.<h3>Butterfly Pea Flower Tea Market Driver: Growing Awareness of Health Benefits</h3>The market driver for Butterfly Pea Flower Tea is the growing awareness of its health benefits. Butterfly pea flower is rich in antioxidants and bioactive compounds known for their potential health-promoting properties, including anti-inflammatory and cognitive enhancement effects. As consumers become more health-conscious and seek out beverages with added nutritional value, the demand for butterfly pea flower tea as a functional beverage continues to rise.<h3>Butterfly Pea Flower Tea Market Opportunity: Product Innovation and Diversification</h3>An opportunity within the Butterfly Pea Flower Tea market lies in product innovation and diversification. Manufacturers can explore creating new variants of butterfly pea flower tea by combining it with other natural ingredients or infusions to enhance flavor profiles and offer unique taste experiences. Additionally, developing ready-to-drink formats, tea blends, or incorporating butterfly pea flower extract into other beverage categories like kombucha or sparkling drinks can help tap into diverse consumer preferences and expand market reach. By focusing on innovation and diversification, companies can capitalize on the growing consumer interest in botanical-based beverages.<h3>Butterfly Pea Flower Tea Market Share Analysis: Supermarket segment generated the highest revenue share in the industry</h3>The Supermarket Application segment stands out as the largest and most prominent category within the Butterfly Pea Flower Tea Market, reflecting a robust market share and significant consumer demand. The growth of this segment is driven by various factors that contribute to its dominant position in the market landscape. Firstly, supermarkets offer a wide range of product choices and brands, providing consumers with convenient access to Butterfly Pea Flower Tea alongside other beverages and groceries. This accessibility and availability contribute significantly to the segment's market share. Additionally, supermarkets often leverage strategic marketing and promotional campaigns to promote Butterfly Pea Flower Tea, enhancing consumer awareness and driving sales volumes. Further, the preference for one-stop shopping experiences and the increasing trend of health-conscious consumers opting for natural and herbal teas further boost the demand for Butterfly Pea Flower Tea in supermarkets. The segment's strong foothold in established retail channels, coupled with consumer convenience and promotional efforts, positions it as the largest and most influential segment within the Butterfly Pea Flower Tea Market.<h3>Butterfly Pea Flower Tea Market Share Analysis: Organic Butterfly Pea Flower Tea is the fastest growing segment over the forecast period to 2032</h3>The Organic Butterfly Pea Flower Tea segment emerges as the fastest-growing category in the Butterfly Pea Flower Tea Market, showcasing remarkable expansion and consumer preference for natural and organic products. This segment's rapid growth is fueled by several key factors contributing to its prominence. Firstly, there is a growing global trend towards health and wellness, with consumers increasingly opting for organic and natural beverages due to their perceived health benefits and sustainable production methods. The rising awareness of the harmful effects of synthetic chemicals and pesticides in conventional products further drives demand for organic alternatives like Organic Butterfly Pea Flower Tea. Additionally, the growing popularity of herbal and functional teas, coupled with the increasing adoption of organic lifestyles among consumers, propels the growth of this segment. Further, stringent regulations and certifications ensuring the authenticity and quality of organic products provide consumers with confidence and trust, further boosting the segment's market share. The convergence of these factors positions Organic Butterfly Pea Flower Tea as the fastest-growing and most promising segment within the Butterfly Pea Flower Tea Market, reflecting evolving consumer preferences towards natural, healthy, and sustainably produced beverages.<h2>Butterfly Pea Flower Tea Market Segmentation</h2><Strong>By Application</Strong>
Supermarket
Departmental Stores
Convenience Stores
Online Retail
Others
<Strong>By Product</Strong>
Organic
Conventional
<Strong>Countries Analyzed</Strong>
North America (US, Canada, Mexico)
Europe (Germany, UK, France, Spain, Italy, Russia, Rest of Europe)
Asia Pacific (China, India, Japan, South Korea, Australia, South East Asia, Rest of Asia)
South America (Brazil, Argentina, Rest of South America)
Middle East and Africa (Saudi Arabia, UAE, Rest of Middle East, South Africa, Egypt, Rest of Africa)<h2>Butterfly Pea Flower Tea Companies Profiled in the Study</h2>Apara International
Devans South Indian Coffee and Tea
GF JIAN YUAN ORGANIC TEA CO. Ltd
Girnar Foods & Beverages Private Ltd
Golden Dew Tea Factory
LAKE MISSOULA TEA COMPANY
Vatsh Corp
*- List Not Exhaustive
<Strong>Chapter 1. TABLE OF CONTENTS</Strong>
<Strong>Chapter 2. Introduction to Butterfly Pea Flower Tea Market </Strong>
2.1. Market Overview
2.2. Key Statistics and Report Highlights
2.3. Scope of the Comprehensive Study
2.3.1. Market Definition
2.3.2 Countries and Regions Covered
2.3.3 Research Objective
2.3.4 Units, Currency, and Conversions
2.3.5 Industry Value Chain
2.4. Key Market Segments
2.5. Key Companies
2.6. Study Period
<Strong>Chapter 3. Strategic Analysis Review</Strong>
3.1. Butterfly Pea Flower Tea Pricing Analysis and Forecast
3.2. Porter’s Five Forces
3.3. Market Ecosystem
3.4. SWOT Analysis
3.5. Regulatory Scenario
3.3. Effects of Inflation, Russia-Ukraine War, moderating economic growth, and other macroeconomic factors
<Strong>Chapter 4. Competitive Landscape</Strong>
4.1. Market Share Analysis
4.1.1. Global Butterfly Pea Flower Tea Market Share by Company, 2023
4.1.2. Product Offerings of Leading Butterfly Pea Flower Tea Companies
4.2. Market Entropy
4.2.1. New Product Launches in the Industry
4.2.2. Mergers, Acquisitions, Joint ventures, and Partnerships
4.3. Key Strategies and Best Practices
<Strong>Chapter 5. Global Market Projections: Best, Reference, and Low Case Scenarios</Strong>
5.1. Growth Analysis- Case Scenario Definitions
5.2. Low Growth Case Scenario Forecasts
5.3. Reference Growth Case Scenario Forecasts
5.4. High Growth Case Scenario Forecasts
<Strong>Chapter 6. Market Dynamics</Strong>
6.1. Butterfly Pea Flower Tea Market Drivers
6.2. Butterfly Pea Flower Tea Market Challenges
6.6. Butterfly Pea Flower Tea Market Opportunities
6.4. Butterfly Pea Flower Tea Market Trends
<Strong>Chapter 7. Global Butterfly Pea Flower Tea Market Outlook Trends</Strong>
7.1. Global Butterfly Pea Flower Tea Revenue (USD Million) and CAGR (%) by Type (2021-2032)
7.2. Global Butterfly Pea Flower Tea Revenue (USD Million) and CAGR (%) by Application (2021-2032)
7.3. Global Butterfly Pea Flower Tea Revenue (USD Million) and CAGR (%) by Product (2021-2032)
<Strong>By Application</Strong>
Supermarket
Departmental Stores
Convenience Stores
Online Retail
Others
<Strong>By Product</Strong>
Organic
Conventional
<Strong>Chapter 8. Global Butterfly Pea Flower Tea Regional Analysis and Outlook</Strong>
8.1. Global Butterfly Pea Flower Tea Revenue (USD Million) By Regions (2021- 2032)
8.2. North America Butterfly Pea Flower Tea Revenue (USD Million) by Country (2021-2032)
8.2.1. United States Butterfly Pea Flower Tea Regional Analysis and Outlook
8.2.2. Canada Butterfly Pea Flower Tea Regional Analysis and Outlook
8.2.3. Mexico Butterfly Pea Flower Tea Regional Analysis and Outlook
8.3. Europe Butterfly Pea Flower Tea Revenue (USD Million), by Country (2021-2032)
8.3.1. Germany Butterfly Pea Flower Tea Regional Analysis and Outlook
8.3.2. France Butterfly Pea Flower Tea Regional Analysis and Outlook
8.3.3. United Kingdom Butterfly Pea Flower Tea Regional Analysis and Outlook
8.3.4. Spain Butterfly Pea Flower Tea Regional Analysis and Outlook
8.3.5. Italy Butterfly Pea Flower Tea Regional Analysis and Outlook
8.3.6. Russia Butterfly Pea Flower Tea Regional Analysis and Outlook
8.3.7. Rest of Europe Butterfly Pea Flower Tea Regional Analysis and Outlook
8.4. Asia Pacific Butterfly Pea Flower Tea Revenue (USD Million) by Country (2021-2032)
8.4.1. China Butterfly Pea Flower Tea Regional Analysis and Outlook
8.4.2. Japan Butterfly Pea Flower Tea Regional Analysis and Outlook
8.4.3. India Butterfly Pea Flower Tea Regional Analysis and Outlook
8.4.4. South Korea Butterfly Pea Flower Tea Regional Analysis and Outlook
8.4.5. Australia Butterfly Pea Flower Tea Regional Analysis and Outlook
8.4.6. South East Asia Butterfly Pea Flower Tea Regional Analysis and Outlook
8.4.7. Rest of Asia Pacific Butterfly Pea Flower Tea Regional Analysis and Outlook
8.5. South America Butterfly Pea Flower Tea Revenue (USD Million), by Country (2021-2032)
8.5.1. Brazil Butterfly Pea Flower Tea Regional Analysis and Outlook
8.5.2. Argentina Butterfly Pea Flower Tea Regional Analysis and Outlook
8.5.3. Rest of South America Butterfly Pea Flower Tea Regional Analysis and Outlook
8.6. Middle East and Africa Butterfly Pea Flower Tea Revenue (USD Million) by Country (2021-2032)
8.6.1. Middle East Butterfly Pea Flower Tea Regional Analysis and Outlook
8.6.2. Africa Butterfly Pea Flower Tea Regional Analysis and Outlook
<Strong>Chapter 9. North America Butterfly Pea Flower Tea Analysis and Outlook</Strong>
9.1. North America Butterfly Pea Flower Tea Revenue (USD Million) by Segments (2021-2032)
9.1.1. North America Butterfly Pea Flower Tea Revenue (USD Million) by Type (2021-2032)
9.1.2. North America Butterfly Pea Flower Tea Revenue (USD Million) by Application (2021-2032)
9.1.3. North America Butterfly Pea Flower Tea Revenue (USD Million) by Product (2021-2032)
<Strong>By Application</Strong>
Supermarket
Departmental Stores
Convenience Stores
Online Retail
Others
<Strong>By Product</Strong>
Organic
Conventional
<Strong>Chapter 10. Europe Butterfly Pea Flower Tea Analysis and Outlook</Strong>
10.1. Europe Butterfly Pea Flower Tea Revenue (USD Million), by Segments (USD Million) (2021-2032)
10.1.1. Europe Butterfly Pea Flower Tea Revenue (USD Million) by Type (2021-2032)
10.1.2. Europe Butterfly Pea Flower Tea Revenue (USD Million) by Application (2021-2032)
10.1.3. Europe Butterfly Pea Flower Tea Revenue (USD Million) by Product (2021-2032)
<Strong>By Application</Strong>
Supermarket
Departmental Stores
Convenience Stores
Online Retail
Others
<Strong>By Product</Strong>
Organic
Conventional
<Strong>Chapter 11. Asia Pacific Butterfly Pea Flower Tea Analysis and Outlook</Strong>
11.1. Asia Pacific Butterfly Pea Flower Tea Revenue (USD Million), and Revenue (USD Million) by Segments (2021-2032)
11.1.1. Asia Pacific Butterfly Pea Flower Tea Revenue (USD Million) by Type (2021-2032)
11.1.2. Asia Pacific Butterfly Pea Flower Tea Revenue (USD Million) by Application (2021-2032)
11.1.3. Asia Pacific Butterfly Pea Flower Tea Revenue (USD Million) by Product (2021-2032)
<Strong>By Application</Strong>
Supermarket
Departmental Stores
Convenience Stores
Online Retail
Others
<Strong>By Product</Strong>
Organic
Conventional
<Strong>Chapter 12. South America Butterfly Pea Flower Tea Analysis and Outlook</Strong>
12.1. South America Butterfly Pea Flower Tea Revenue (USD Million), by Segments (2021-2032)
12.1.1. South America Butterfly Pea Flower Tea Revenue (USD Million) by Type (2021-2032)
12.1.2. South America Butterfly Pea Flower Tea Revenue (USD Million) by Application (2021-2032)
12.1.3. South America Butterfly Pea Flower Tea Revenue (USD Million) by Product (2021-2032)
<Strong>By Application</Strong>
Supermarket
Departmental Stores
Convenience Stores
Online Retail
Others
<Strong>By Product</Strong>
Organic
Conventional
<Strong>Chapter 13. Middle East and Africa Butterfly Pea Flower Tea Analysis and Outlook</Strong>
13.1. Middle East and Africa Butterfly Pea Flower Tea Revenue (USD Million), by Segments (2021-2032)
13.1.1. Middle East and Africa Butterfly Pea Flower Tea Revenue (USD Million) by Type (2021-2032)
13.1.2. Middle East and Africa Butterfly Pea Flower Tea Revenue (USD Million) by Application (2021-2032)
13.1.3. Middle East and Africa Butterfly Pea Flower Tea Revenue (USD Million) by Product (2021-2032)
<Strong>By Application</Strong>
Supermarket
Departmental Stores
Convenience Stores
Online Retail
Others
<Strong>By Product</Strong>
Organic
Conventional
<Strong>Chapter 14. Butterfly Pea Flower Tea Company Profiles</Strong>
14.1 Business Overview
14.2 Product Profiles
14.3 SWOT Profiles
14.5 Recent Developments
14.6 Financial Profile
List of Companies
Apara International
Devans South Indian Coffee and Tea
GF JIAN YUAN ORGANIC TEA CO. Ltd
Girnar Foods & Beverages Private Ltd
Golden Dew Tea Factory
LAKE MISSOULA TEA COMPANY
Vatsh Corp
<Strong>15. Methodology and Data Sources</Strong>
15.1 Customization Offerings
15.2 Subscription Services
15.3 Related Reports
15.4 Publisher Expertise
<Strong>LIST OF TABLES</Strong>
Table 1 Market Segmentation Analysis
Table 2 Global Butterfly Pea Flower Tea Market Share of Leading Companies, 2023
Table 3 Product Offerings of Leading Companies
Table 4 Low Growth Scenario Forecasts
Table 5 Reference Case Growth Scenario
Table 6 High Growth Case Scenario
Table 7 Global Butterfly Pea Flower Tea Revenue (USD Million) And CAGR (%) By Type (2021-2032)
Table 8 Global Butterfly Pea Flower Tea Revenue (USD Million) And CAGR (%) By Application (2021-2032)
Table 9 Global Butterfly Pea Flower Tea Revenue (USD Million) And CAGR (%) By Product (2021-2032)
Table 10 Global Butterfly Pea Flower Tea Market Revenue (USD Million) By Regions (2021-2032)
Table 11 Global Butterfly Pea Flower Tea Market Share (%) By Regions (2021-2032)
Table 12 North America Butterfly Pea Flower Tea Revenue (USD Million) By Country (2021-2032)
Table 13 Europe Butterfly Pea Flower Tea Revenue (USD Million) By Country (2021-2032)
Table 14 Asia Pacific Butterfly Pea Flower Tea Revenue (USD Million) By Country (2021-2032)
Table 15 South America Butterfly Pea Flower Tea Revenue (USD Million) By Country (2021-2032)
Table 16 Middle East and Africa Butterfly Pea Flower Tea Revenue (USD Million) By Region (2021-2032)
Table 17 North America Butterfly Pea Flower Tea Revenue (USD Million) By Type (2021-2032)
Table 18 North America Butterfly Pea Flower Tea Revenue (USD Million) By Application (2021-2032)
Table 19 North America Butterfly Pea Flower Tea Revenue (USD Million) By Product (2021-2032)
Table 20 Europe Butterfly Pea Flower Tea Revenue (USD Million) By Type (2021-2032)
Table 21 Europe Butterfly Pea Flower Tea Revenue (USD Million) By Application (2021-2032)
Table 22 Europe Butterfly Pea Flower Tea Revenue (USD Million) By Product (2021-2032)
Table 23 Asia Pacific Butterfly Pea Flower Tea Revenue (USD Million) By Type (2021-2032)
Table 24 Asia Pacific Butterfly Pea Flower Tea Revenue (USD Million) By Application (2021-2032)
Table 25 Asia Pacific Butterfly Pea Flower Tea Revenue (USD Million) By Product (2021-2032)
Table 26 South America Butterfly Pea Flower Tea Revenue (USD Million) By Type (2021-2032)
Table 27 South America Butterfly Pea Flower Tea Revenue (USD Million) By Application (2021-2032)
Table 28 South America Butterfly Pea Flower Tea Revenue (USD Million) By Product (2021-2032)
Table 29 Middle East and Africa Butterfly Pea Flower Tea Revenue (USD Million) By Type (2021-2032)
Table 30 Middle East and Africa Butterfly Pea Flower Tea Revenue (USD Million) By Application (2021-2032)
Table 31 Middle East and Africa Butterfly Pea Flower Tea Revenue (USD Million) By Product (2021-2032)
<Strong>LIST OF FIGURES</Strong>
Figure 1. Market Scope
Figure 2. Pricing Forecasts Per Unit, 2023- 2032
Figure 3. Porter’s Five Forces
Figure 4. Global Butterfly Pea Flower Tea Market Revenue (USD Million) By Regions (2021-2032)
Figure 5. Global Butterfly Pea Flower Tea Market Share (%) By Regions (2023)
Figure 6. North America Butterfly Pea Flower Tea Revenue (USD Million) By Country (2021-2032)
Figure 7. United States Butterfly Pea Flower Tea Revenue (USD Million) By Country (2021-2032)
Figure 8. Canada Butterfly Pea Flower Tea Revenue (USD Million) By Country (2021-2032)
Figure 9. Mexico Butterfly Pea Flower Tea Revenue (USD Million) By Country (2021-2032)
Figure 10. Europe Butterfly Pea Flower Tea Revenue (USD Million) By Country (2021-2032)
Figure 11. Germany Butterfly Pea Flower Tea Revenue (USD Million) By Country (2021-2032)
Figure 12. France Butterfly Pea Flower Tea Revenue (USD Million) By Country (2021-2032)
Figure 13. United Kingdom Butterfly Pea Flower Tea Revenue (USD Million) By Country (2021-2032)
Figure 14. Spain Butterfly Pea Flower Tea Revenue (USD Million) By Country (2021-2032)
Figure 15. Italy Butterfly Pea Flower Tea Revenue (USD Million) By Country (2021-2032)
Figure 16. Russia Butterfly Pea Flower Tea Revenue (USD Million) By Country (2021-2032)
Figure 17. Rest of Europe Butterfly Pea Flower Tea Revenue (USD Million) By Country (2021-2032)
Figure 11. Asia Pacific Butterfly Pea Flower Tea Revenue (USD Million) By Country (2021-2032)
Figure 12. China Butterfly Pea Flower Tea Revenue (USD Million) By Country (2021-2032)
Figure 13. Japan Butterfly Pea Flower Tea Revenue (USD Million) By Country (2021-2032)
Figure 14. India Butterfly Pea Flower Tea Revenue (USD Million) By Country (2021-2032)
Figure 15. South Korea Butterfly Pea Flower Tea Revenue (USD Million) By Country (2021-2032)
Figure 16. Australia Butterfly Pea Flower Tea Revenue (USD Million) By Country (2021-2032)
Figure 17. South East Asia Butterfly Pea Flower Tea Revenue (USD Million) By Country (2021-2032)
Figure 18. South America Butterfly Pea Flower Tea Revenue (USD Million) By Country (2021-2032)
Figure 19. Brazil Butterfly Pea Flower Tea Revenue (USD Million) By Country (2021-2032)
Figure 20. Argentina Butterfly Pea Flower Tea Revenue (USD Million) By Country (2021-2032)
Figure 21. Rest of Asia Pacific Butterfly Pea Flower Tea Revenue (USD Million) By Country (2021-2032)
Figure 22. Middle East and Africa Butterfly Pea Flower Tea Revenue (USD Million) By Region (2021-2032)
Figure 23. Saudi Arabia Butterfly Pea Flower Tea Revenue (USD Million) By Region (2021-2032)
Figure 24. The UAE Butterfly Pea Flower Tea Revenue (USD Million) By Region (2021-2032)
Figure 25. Rest of Middle East Butterfly Pea Flower Tea Revenue (USD Million) By Region (2021-2032)
Figure 26. South Africa Butterfly Pea Flower Tea Revenue (USD Million) By Region (2021-2032)
Figure 27. Africa Butterfly Pea Flower Tea Revenue (USD Million) By Region (2021-2032)
Figure 28. North America Butterfly Pea Flower Tea Revenue (USD Million) By Type (2021-2032)
Figure 29. North America Butterfly Pea Flower Tea Revenue (USD Million) By Application (2021-2032)
Figure 30. North America Butterfly Pea Flower Tea Revenue (USD Million) By Product (2021-2032)
Figure 31. Europe Butterfly Pea Flower Tea Revenue (USD Million) By Type (2021-2032)
Figure 32. Europe Butterfly Pea Flower Tea Revenue (USD Million) By Application (2021-2032)
Figure 33. Europe Butterfly Pea Flower Tea Revenue (USD Million) By Product (2021-2032)
Figure 34. Asia Pacific Butterfly Pea Flower Tea Revenue (USD Million) By Type (2021-2032)
Figure 35. Asia Pacific Butterfly Pea Flower Tea Revenue (USD Million) By Application (2021-2032)
Figure 36. Asia Pacific Butterfly Pea Flower Tea Revenue (USD Million) By Product (2021-2032)
Figure 37. South America Butterfly Pea Flower Tea Revenue (USD Million) By Type (2021-2032)
Figure 38. South America Butterfly Pea Flower Tea Revenue (USD Million) By Application (2021-2032)
Figure 39. South America Butterfly Pea Flower Tea Revenue (USD Million) By Product (2021-2032)
Figure 40. Middle East and Africa Butterfly Pea Flower Tea Revenue (USD Million) By Type (2021-2032)
Figure 41. Middle East and Africa Butterfly Pea Flower Tea Revenue (USD Million) By Application (2021-2032)
Figure 42. Middle East and Africa Butterfly Pea Flower Tea Revenue (USD Million) By Product (2021-2032)
