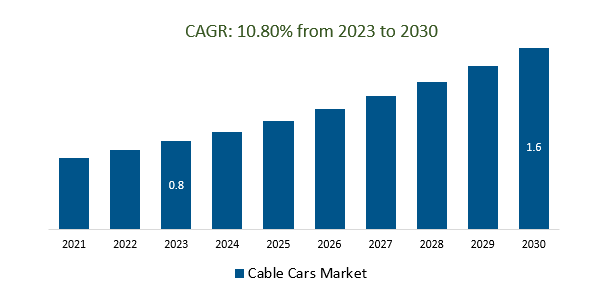
The Global Cable Cars Market is estimated to be US$ 0.8 Billion in 2023 and is poised to register 10.80% growth over the forecast period from 2023 to 2030. To reach US$ 1.8 Billion in 2030
The market growth is driven by an increasing emphasis on eco-friendly transportation options has led to a growing interest in cable cars as a low-impact mode of urban transit. Cable cars can contribute to reducing emissions and congestion in densely populated areas. The urban populations continue to grow, the demand for efficient and reliable public transportation systems increases. Cable cars can provide a practical solution to traffic congestion in cities with challenging terrain.
Leading companies are focusing on Urban Mobility Solutions, Integration with Sustainable Transport Networks, Smart City Integration of green Transportation, Innovations in Technology, Cable Cars for Cargo, Global Market Expansion, and others to boost market shares in the industry.
Market Overview
Cable cars are used to transport tourists and from popular tourist destinations, such as mountains, ski resorts, and theme parks. The increasing number of tourists, especially in developing countries, is driving the demand for cable cars also being increasingly used in urban transportation. They are a more efficient and environmentally friendly way to transport people over long distances in increasing investment in urban transportation infrastructure is driving the demand for cable cars in this sector.
Market Dynamics
Market Trends: Companies are launching development of new cable car technologies to attract a consumer base
The development of new cable car technologies is increasing demand for cable cars in the tourism and urban transportation sectors. The tourism sector is the major driver of the cable car market, and new cable car technologies can help to improve the efficiency and safety of transportation to and from tourist destinations. The urban transportation sector is also growing, and new cable car technologies can help to provide a more efficient and environmentally friendly way to transport people over long distances.
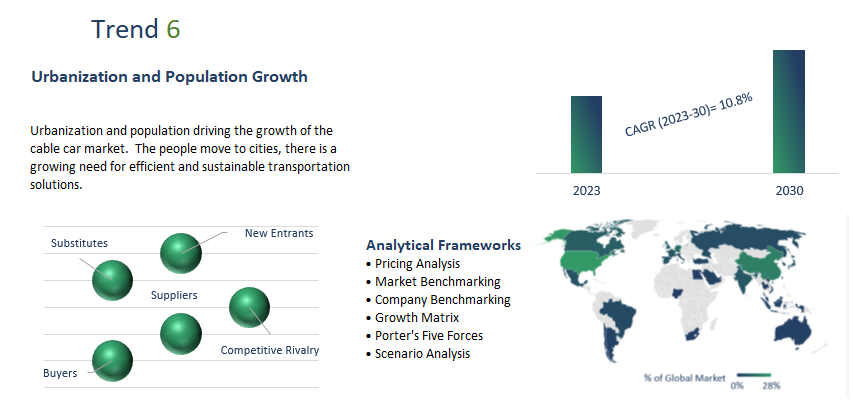
Market Drivers: Urbanization and Population Growth
Urbanization and population driving the growth of the cable car market. The people move to cities, there is a growing need for efficient and sustainable transportation solutions. Cable cars offer a number of advantages over other modes of transportation, such as their ability to transport large numbers of people over long distances, their environmental friendliness, and their resilience to traffic congestion.
The development of new cable car technologies is a promising trend that is expected to continue in the coming years. These new technologies offer a number of advantages over traditional cable cars, and they are expected to help grow the cable car market.
Market Opportunity: Introduce of Technological Advancements
Innovations in cable car technology, such as advanced safety features, automation, energy-efficient systems, and improved passenger comfort, can attract more users and investors. The technological advancements cable car market are Safety Enhancements, Energy Efficiency, Automation and Remote Control, and Passenger Comfort and Experience. Technological advancements can enable modular construction and scalable designs, allowing for easier expansion, modifications, or reconfigurations of cable car systems to adapt to changing transportation needs.
Market Segmentation
Inclined Lifts: In the cable car market, inclined lifts refer to specialized systems designed for transporting people or goods along steep or inclined terrains, such as mountainsides or urban inclines. These lifts use cable-driven mechanisms to provide safe and efficient transportation, offering passengers panoramic views while navigating challenging landscapes. Inclined lifts are utilized for both recreational purposes, such as tourism and sightseeing, and practical transportation needs in hilly or mountainous areas.
Material Handling: Material handling in the cable car market involves the efficient movement and transportation of goods, equipment, or supplies using cable-driven systems, commonly found in mountainous or challenging terrains, facilitating practical logistics and enhancing accessibility in various contexts.
Market Segmentation
By Type
- Vertical Lifts
- Surface Lifts
- Inclined Lifts
- Others
By Application
- Tourism
- Material handling
- Public transportation
- Others
By Sales Channel
By Region
- North America (United States, Canada, Mexico)
- Europe (Germany, France, United Kingdom, Spain, Italy, Others)
- Asia Pacific (China, India, Japan, South Korea, Australia, Others)
- Latin America (Brazil, Argentina, Others)
- Middle East and Africa (Saudi Arabia, UAE, Kuwait, Other Middle East, South Africa, Nigeria, Other Africa)
Key Players
Leading companies profiled in the study include-
- Doppelmayr/Garaventa Group
- Damodar Ropeways and Infra
- Conveyor and Ropeway Services
- MND Group
- Leitner S.p.A
- Bartholet Maschinenbau AG (BMF)
- POMA Group
- Nippon Cable
Cable Cars Market Outlook 2023
1 Market Overview
1.1 Introduction to Cable Cars Market
1.2 Scope of the Study
1.3 Research Objective
1.3.1 Key Market Scope and Segments
1.3.2 Players Covered
1.3.3 Years Considered
2 Executive Summary
2.1 2023 Cable Cars Industry- Market Statistics
3 Market Dynamics
3.1 Market Drivers
3.2 Market Challenges
3.3 Market Opportunities
3.4 Market Trends
4 Market Factor Analysis
4.1 Porter’s Five Forces
4.2 Market Entropy
4.2.1 Global Cable Cars Market Companies with Area Served
4.2.2 Products Offerings Global Cable Cars Market
5 COVID-19 Impact Analysis and Outlook Scenarios
5.1.1 Covid-19 Impact Analysis
5.1.2 Post-COVID-19 Scenario- Low Growth Case
5.1.3 Post-COVID-19 Scenario- Reference Growth Case
5.1.4 Post-COVID-19 Scenario- Low Growth Case
6 Global Cable Cars Market Trends
6.1 Global Cable Cars Revenue (USD Million) and CAGR (%) by Type (2018-2030)
6.2 Global Cable Cars Revenue (USD Million) and CAGR (%) by Applications (2018-2030)
6.3 Global Cable Cars Revenue (USD Million) and CAGR (%) by Regions (2018-2030)
7 Global Cable Cars Market Revenue (USD Million) by Type, and Applications (2018-2022)
7.1 Global Cable Cars Revenue (USD Million) by Type (2018-2022)
7.1.1 Global Cable Cars Revenue (USD Million), Market Share (%) by Type (2018-2022)
7.2 Global Cable Cars Revenue (USD Million) by Applications (2018-2022)
7.2.1 Global Cable Cars Revenue (USD Million), Market Share (%) by Applications (2018-2022)
8 Global Cable Cars Development Regional Status and Outlook
8.1 Global Cable Cars Revenue (USD Million) By Regions (2018-2022)
8.2 North America Cable Cars Revenue (USD Million) by Type, and Application (2018-2022)
8.2.1 North America Cable Cars Revenue (USD Million) by Country (2018-2022)
8.2.2 North America Cable Cars Revenue (USD Million) by Type (2018-2022)
8.2.3 North America Cable Cars Revenue (USD Million) by Applications (2018-2022)
8.3 Europe Cable Cars Revenue (USD Million), by Type, and Applications (USD Million) (2018-2022)
8.3.1 Europe Cable Cars Revenue (USD Million), by Country (2018-2022)
8.3.2 Europe Cable Cars Revenue (USD Million) by Type (2018-2022)
8.3.3 Europe Cable Cars Revenue (USD Million) by Applications (2018-2022)
8.4 Asia Pacific Cable Cars Revenue (USD Million), and Revenue (USD Million) by Type, and Applications (2018-2022)
8.4.1 Asia Pacific Cable Cars Revenue (USD Million) by Country (2018-2022)
8.4.2 Asia Pacific Cable Cars Revenue (USD Million) by Type (2018-2022)
8.4.3 Asia Pacific Cable Cars Revenue (USD Million) by Applications (2018-2022)
8.5 South America Cable Cars Revenue (USD Million), by Type, and Applications (2018-2022)
8.5.1 South America Cable Cars Revenue (USD Million), by Country (2018-2022)
8.5.2 South America Cable Cars Revenue (USD Million) by Type (2018-2022)
8.5.3 South America Cable Cars Revenue (USD Million) by Applications (2018-2022)
8.6 Middle East and Africa Cable Cars Revenue (USD Million), by Type, Technology, Application, Thickness (2018-2022)
8.6.1 Middle East and Africa Cable Cars Revenue (USD Million) by Country (2018-2022)
8.6.2 Middle East and Africa Cable Cars Revenue (USD Million) by Type (2018-2022)
8.6.3 Middle East and Africa Cable Cars Revenue (USD Million) by Applications (2018-2022)
9 Company Profiles
10 Global Cable Cars Market Revenue (USD Million), by Type, and Applications (2023-2030)
10.1 Global Cable Cars Revenue (USD Million) and Market Share (%) by Type (2023-2030)
10.1.1 Global Cable Cars Revenue (USD Million), and Market Share (%) by Type (2023-2030)
10.2 Global Cable Cars Revenue (USD Million) and Market Share (%) by Applications (2023-2030)
10.2.1 Global Cable Cars Revenue (USD Million), and Market Share (%) by Applications (2023-2030)
11 Global Cable Cars Development Regional Status and Outlook Forecast
11.1 Global Cable Cars Revenue (USD Million) By Regions (2023-2030)
11.2 North America Cable Cars Revenue (USD Million) by Type, and Applications (2023-2030)
11.2.1 North America Cable Cars Revenue (USD) Million by Country (2023-2030)
11.2.2 North America Cable Cars Revenue (USD Million), by Type (2023-2030)
11.2.3 North America Cable Cars Revenue (USD Million), Market Share (%) by Applications (2023-2030)
11.3 Europe Cable Cars Revenue (USD Million), by Type, and Applications (2023-2030)
11.3.1 Europe Cable Cars Revenue (USD Million), by Country (2023-2030)
11.3.2 Europe Cable Cars Revenue (USD Million), by Type (2023-2030)
11.3.3 Europe Cable Cars Revenue (USD Million), by Applications (2023-2030)
11.4 Asia Pacific Cable Cars Revenue (USD Million) by Type, and Applications (2023-2030)
11.4.1 Asia Pacific Cable Cars Revenue (USD Million), by Country (2023-2030)
11.4.2 Asia Pacific Cable Cars Revenue (USD Million), by Type (2023-2030)
11.4.3 Asia Pacific Cable Cars Revenue (USD Million), by Applications (2023-2030)
11.5 South America Cable Cars Revenue (USD Million), by Type, and Applications (2023-2030)
11.5.1 South America Cable Cars Revenue (USD Million), by Country (2023-2030)
11.5.2 South America Cable Cars Revenue (USD Million), by Type (2023-2030)
11.5.3 South America Cable Cars Revenue (USD Million), by Applications (2023-2030)
11.6 Middle East and Africa Cable Cars Revenue (USD Million), by Type, and Applications (2023-2030)
11.6.1 Middle East and Africa Cable Cars Revenue (USD Million), by Region (2023-2030)
11.6.2 Middle East and Africa Cable Cars Revenue (USD Million), by Type (2023-2030)
11.6.3 Middle East and Africa Cable Cars Revenue (USD Million), by Applications (2023-2030)
12 Methodology and Data Sources
12.1 Methodology/Research Approach
12.1.1 Research Programs/Design
12.1.2 Market Size Estimation
12.1.3 Market Breakdown and Data Triangulation
12.2 Data Sources
12.2.1 Secondary Sources
12.2.2 Primary Sources
12.3 Disclaimer
List Of Tables
Table 1 Market Segmentation Analysis
Table 2 Global Cable Cars Market Companies with Areas Served
Table 3 Products Offerings Global Cable Cars Market
Table 4 Low Growth Scenario Forecasts
Table 5 Reference Case Growth Scenario
Table 6 High Growth Case Scenario
Table 7 Global Cable Cars Revenue (USD Million) And CAGR (%) By Type (2018-2030)
Table 8 Global Cable Cars Revenue (USD Million) And CAGR (%) By Applications (2018-2030)
Table 9 Global Cable Cars Revenue (USD Million) And CAGR (%) By Regions (2018-2030)
Table 10 Global Cable Cars Revenue (USD Million) By Type (2018-2022)
Table 11 Global Cable Cars Revenue Market Share (%) By Type (2018-2022)
Table 12 Global Cable Cars Revenue (USD Million) By Applications (2018-2022)
Table 13 Global Cable Cars Revenue Market Share (%) By Applications (2018-2022)
Table 14 Global Cable Cars Market Revenue (USD Million) By Regions (2018-2022)
Table 15 Global Cable Cars Market Share (%) By Regions (2018-2022)
Table 16 North America Cable Cars Revenue (USD Million) By Country (2018-2022)
Table 17 North America Cable Cars Revenue (USD Million) By Type (2018-2022)
Table 18 North America Cable Cars Revenue (USD Million) By Applications (2018-2022)
Table 19 Europe Cable Cars Revenue (USD Million) By Country (2018-2022)
Table 20 Europe Cable Cars Revenue (USD Million) By Type (2018-2022)
Table 21 Europe Cable Cars Revenue (USD Million) By Applications (2018-2022)
Table 22 Asia Pacific Cable Cars Revenue (USD Million) By Country (2018-2022)
Table 23 Asia Pacific Cable Cars Revenue (USD Million) By Type (2018-2022)
Table 24 Asia Pacific Cable Cars Revenue (USD Million) By Applications (2018-2022)
Table 25 South America Cable Cars Revenue (USD Million) By Country (2018-2022)
Table 26 South America Cable Cars Revenue (USD Million) By Type (2018-2022)
Table 27 South America Cable Cars Revenue (USD Million) By Applications (2018-2022)
Table 28 Middle East and Africa Cable Cars Revenue (USD Million) By Region (2018-2022)
Table 29 Middle East and Africa Cable Cars Revenue (USD Million) By Type (2018-2022)
Table 30 Middle East and Africa Cable Cars Revenue (USD Million) By Applications (2018-2022)
Table 31 Financial Analysis
Table 32 Global Cable Cars Revenue (USD Million) By Type (2023-2030)
Table 33 Global Cable Cars Revenue Market Share (%) By Type (2023-2030)
Table 34 Global Cable Cars Revenue (USD Million) By Applications (2023-2030)
Table 35 Global Cable Cars Revenue Market Share (%) By Applications (2023-2030)
Table 36 Global Cable Cars Market Revenue (USD Million), And Revenue (USD Million) By Regions (2023-2030)
Table 37 North America Cable Cars Revenue (USD)By Country (2023-2030)
Table 38 North America Cable Cars Revenue (USD Million) By Type (2023-2030)
Table 39 North America Cable Cars Revenue (USD Million) By Applications (2023-2030)
Table 40 Europe Cable Cars Revenue (USD Million) By Country (2023-2030)
Table 41 Europe Cable Cars Revenue (USD Million) By Type (2023-2030)
Table 42 Europe Cable Cars Revenue (USD Million) By Applications (2023-2030)
Table 43 Asia Pacific Cable Cars Revenue (USD Million) By Country (2023-2030)
Table 44 Asia Pacific Cable Cars Revenue (USD Million) By Type (2023-2030)
Table 45 Asia Pacific Cable Cars Revenue (USD Million) By Applications (2023-2030)
Table 46 South America Cable Cars Revenue (USD Million) By Country (2023-2030)
Table 47 South America Cable Cars Revenue (USD Million) By Type (2023-2030)
Table 48 South America Cable Cars Revenue (USD Million) By Applications (2023-2030)
Table 49 Middle East and Africa Cable Cars Revenue (USD Million) By Region (2023-2030)
Table 50 Middle East and Africa Cable Cars Revenue (USD Million) By Region (2023-2030)
Table 51 Middle East and Africa Cable Cars Revenue (USD Million) By Type (2023-2030)
Table 52 Middle East and Africa Cable Cars Revenue (USD Million) By Applications (2023-2030)
Table 53 Research Programs/Design for This Report
Table 54 Key Data Information from Secondary Sources
Table 55 Key Data Information from Primary Sources
List Of Figures
Figure 1 Market Scope
Figure 2 Porter’s Five Forces
Figure 3 Global Cable Cars Revenue (USD Million) By Type (2018-2022)
Figure 4 Global Cable Cars Revenue Market Share (%) By Type (2022)
Figure 5 Global Cable Cars Revenue (USD Million) By Applications (2018-2022)
Figure 6 Global Cable Cars Revenue Market Share (%) By Applications (2022)
Figure 7 Global Cable Cars Market Revenue (USD Million) By Regions (2018-2022)
Figure 8 Global Cable Cars Market Share (%) By Regions (2022)
Figure 9 North America Cable Cars Revenue (USD Million) By Country (2018-2022)
Figure 10 North America Cable Cars Revenue (USD Million) By Type (2018-2022)
Figure 11 North America Cable Cars Revenue (USD Million) By Applications (2018-2022)
Figure 12 Europe Cable Cars Revenue (USD Million) By Country (2018-2022)
Figure 13 Europe Cable Cars Revenue (USD Million) By Type (2018-2022)
Figure 14 Europe Cable Cars Revenue (USD Million) By Applications (2018-2022)
Figure 15 Asia Pacific Cable Cars Revenue (USD Million) By Country (2018-2022)
Figure 16 Asia Pacific Cable Cars Revenue (USD Million) By Type (2018-2022)
Figure 17 Asia Pacific Cable Cars Revenue (USD Million) By Applications (2018-2022)
Figure 18 South America Cable Cars Revenue (USD Million) By Country (2018-2022)
Figure 19 South America Cable Cars Revenue (USD Million) By Type (2018-2022)
Figure 20 South America Cable Cars Revenue (USD Million) By Applications (2018-2022)
Figure 21 Middle East and Africa Cable Cars Revenue (USD Million) By Region (2018-2022)
Figure 22 Middle East and Africa Cable Cars Revenue (USD Million) By Type (2018-2022)
Figure 23 Middle East and Africa Cable Cars Revenue (USD Million) By Applications (2018-2022)
Figure 24 Global Cable Cars Revenue (USD Million) By Type (2023-2030)
Figure 25 Global Cable Cars Revenue Market Share (%) By Type (2030)
Figure 26 Global Cable Cars Revenue (USD Million) By Applications (2023-2030)
Figure 27 Global Cable Cars Revenue Market Share (%) By Applications (2030)
Figure 28 Global Cable Cars Market Revenue (USD Million) By Regions (2023-2030)
Figure 29 North America Cable Cars Revenue (USD Million) By Country (2023-2030)
Figure 30 North America Cable Cars Revenue (USD Million) By Type (2023-2030)
Figure 31 North America Cable Cars Revenue (USD Million) By Applications (2023-2030)
Figure 32 Europe Cable Cars Revenue (USD Million) By Country (2023-2030)
Figure 33 Europe Cable Cars Revenue (USD Million) By Type (2023-2030)
Figure 34 Europe Cable Cars Revenue (USD Million) By Applications (2023-2030)
Figure 35 Asia Pacific Cable Cars Revenue (USD Million) By Country (2023-2030)
Figure 36 Asia Pacific Cable Cars Revenue (USD Million) By Type (2023-2030)
Figure 37 Asia Pacific Cable Cars Revenue (USD Million) By Applications (2023-2030)
Figure 38 South America Cable Cars Revenue (USD Million) By Country (2023-2030)
Figure 39 South America Cable Cars Revenue (USD Million) By Type (2023-2030)
Figure 40 South America Cable Cars Revenue (USD Million) By Applications (2023-2030)
Figure 41 Middle East and Africa Cable Cars Revenue (USD Million) By Region (2023-2030)
Figure 42 Middle East and Africa Cable Cars Revenue (USD Million) By Region (2023-2030)
Figure 43 Middle East and Africa Cable Cars Revenue (USD Million) By Type (2023-2030)
Figure 44 Middle East and Africa Cable Cars Revenue (USD Million) By Applications (2023-2030)
Figure 45 Bottom-Up and Top-Down Approaches For This Report
Figure 46 Data Triangulation
