<h3><Strong><i>Global Cachaca Market Size is valued at $15.9 Billion in 2024 and is forecast to register a growth rate (CAGR) of 7.3% to reach $27.9 Billion by 2032.</h3></Strong></i>The global Cachaca Market Comprehensive Study analyzes and forecasts the market size across 6 regions and 24 countries for diverse segments -By Type (Unaged (White/Silver), Aged (Yello/Gold)), By Sales Channel (Online, Offline), By Application (Food And Beverage, Medical, Pharmaceutical, Others)
<h2>An Introduction to Cachaca Market</h2>The Cachaca market in 2024 is witnessing significant growth, driven by the rising global interest in unique and exotic spirits. Cachaca, a traditional Brazilian distilled spirit made from fermented sugarcane juice, is gaining popularity for its distinct flavor and versatility in cocktails, particularly the famous Caipirinha. The market is supported by the growing consumer demand for premium and artisanal spirits that offer authentic cultural experiences. Advances in production and aging techniques are enhancing the quality and complexity of cachaca. The market is also benefiting from the trend towards craft cocktails and the increasing popularity of Latin American cuisine and beverages.
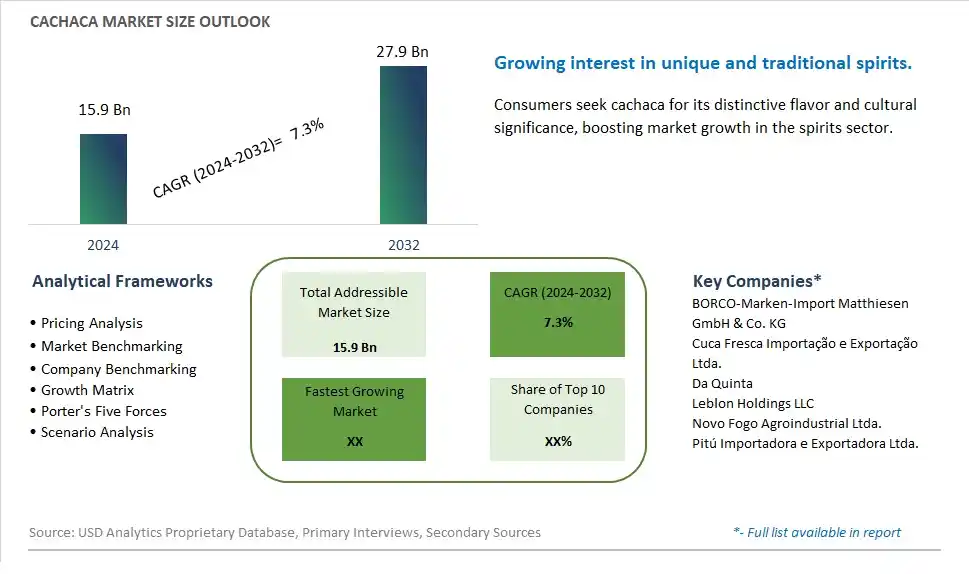
<h2>Cachaca Competitive Landscape</h2>The market report analyses the leading companies in the industry including BORCO-Marken-Import Matthiesen GmbH & Co. KG, Cuca Fresca Importação e Exportação Ltda., Da Quinta, Leblon Holdings LLC, Novo Fogo Agroindustrial Ltda., Pitú Importadora e Exportadora Ltda., and Others.<h2>Cachaca Market Dynamics</h2><h3>Cachaca Market Trend: Growing Popularity of Craft Cocktails</h3>A prominent market trend in the Cachaca market is the growing popularity of craft cocktails. As consumers seek unique and artisanal drinking experiences, there is an increasing demand for premium spirits like Cachaca that can be used as a base for innovative cocktails. This trend is driven by the desire for authenticity, quality ingredients, and sophisticated flavor profiles in cocktail culture.<h3>Cachaca Market Driver: Rising Interest in Brazilian Culture and Cuisine</h3>The market driver for Cachaca is the rising interest in Brazilian culture and cuisine. Cachaca, as a traditional Brazilian spirit, benefits from consumers' curiosity and exploration of global flavors. The growing awareness of Brazilian cocktails like Caipirinha and the cultural significance of Cachaca as a national drink of Brazil contribute to its appeal among consumers looking for authentic and exotic drinking experiences.<h3>Cachaca Market Opportunity: Diversification and Premiumization of Cachaca Products</h3>An opportunity within the Cachaca market lies in diversification and premiumization of Cachaca products. Manufacturers can explore different aging techniques, flavor infusions, and packaging innovations to create premium Cachaca variants that cater to discerning consumers seeking high-quality spirits. Additionally, focusing on storytelling, heritage, and sustainability in marketing strategies can further enhance the appeal of Cachaca as a unique and environmentally conscious choice in the spirits market. By tapping into the trend of premiumization and offering diverse product options, companies can capitalize on the growing consumer interest in craft cocktails and Brazilian culture.<h3>Cachaca Market Share Analysis: Aged Cachaca segment generated the highest revenue share in the industry</h3>In the Cachaça Market, the Aged Cachaça segment stands out as the largest, showcasing steady growth and significant market share. Aged Cachaça refers to the variant that undergoes maturation in wooden barrels, acquiring distinct flavors, colors, and complexities over time. This segment's dominance is attributed to several factors contributing to its popularity and market strength. Firstly, aged Cachaça appeals to a broader consumer base, including connoisseurs, enthusiasts, and individuals seeking premium and refined spirits. The aging process adds depth and character to the spirit, offering rich nuances of wood, spices, and fruits, making it an attractive choice for sipping neat or in sophisticated cocktails. Further, the growing global appreciation and recognition of Brazilian spirits, including Cachaça, have further bolstered the demand for aged variants in international markets. Additionally, the premiumization trend in the spirits industry, where consumers are willing to pay a premium for high-quality and aged products, has fueled the growth of the Aged Cachaça segment. As consumers continue to seek unique and premium drinking experiences, the Aged Cachaça segment is expected to maintain its dominance and expand its market presence in the coming years.<h3>Cachaca Market Share Analysis: Online Sales Channel is the fastest growing segment over the forecast period to 2032</h3>Within the Cachaça Market, the Online Sales Channel emerges as the fastest-growing segment, showcasing rapid growth and substantial market penetration potential by 2032. This segment encompasses all sales conducted through online platforms, including e-commerce websites, digital marketplaces, and direct-to-consumer channels. The significant growth of the Online Sales Channel can be attributed to several key factors driving the shift in consumer behavior and preferences. Firstly, the increasing digitalization and internet penetration globally have empowered consumers to explore and purchase products conveniently online, including alcoholic beverages like Cachaça. The convenience, accessibility, and extensive product variety offered by online platforms have attracted a growing number of consumers, especially millennials and Gen Z, who prioritize convenience and digital shopping experiences. Further, the Past few yearshas further accelerated the adoption of online shopping for alcoholic beverages, as lockdowns and social distancing measures prompted consumers to rely more on e-commerce channels for their purchasing needs. As online sales channels continue to innovate, enhance user experiences, and offer personalized recommendations, they are expected to witness exponential growth and capture a significant share of the Cachaça market in the years ahead.<h3>Cachaca Market Share Analysis: Food and Beverage segment generated the highest revenue share in the industry</h3>The Food and Beverage Application segment stands out as the largest segment within the Cachaça Market, showcasing dominance and significant market share. Cachaça finds extensive utilization in the food and beverage industry, particularly in the production of cocktails and traditional Brazilian drinks. Its unique flavor profile, versatility, and cultural significance make it a preferred choice among bartenders, mixologists, and consumers looking for authentic and flavorful alcoholic beverages. The segment's dominance is further fueled by the rising popularity of craft cocktails, mixology trends, and the growing demand for premium and artisanal spirits in the global beverage market. Additionally, the increasing consumer interest in exploring diverse flavors and cultural experiences through food and beverages contributes to the growth of Cachaça in this segment. As the food and beverage industry continues to innovate and experiment with new recipes, Cachaça remains a key ingredient and driver of growth, solidifying its position as the largest segment within the Cachaça Market.<h2>Cachaca Market Segmentation</h2><Strong>By Type</Strong>
Unaged (White/Silver)
Aged (Yello/Gold)
<Strong>By Sales Channel</Strong>
Online
Offline
<Strong>By Application</Strong>
Food And Beverage
Medical
Pharmaceutical
Others
<Strong>Countries Analyzed</Strong>
North America (US, Canada, Mexico)
Europe (Germany, UK, France, Spain, Italy, Russia, Rest of Europe)
Asia Pacific (China, India, Japan, South Korea, Australia, South East Asia, Rest of Asia)
South America (Brazil, Argentina, Rest of South America)
Middle East and Africa (Saudi Arabia, UAE, Rest of Middle East, South Africa, Egypt, Rest of Africa)<h2>Cachaca Companies Profiled in the Study</h2>BORCO-Marken-Import Matthiesen GmbH & Co. KG
Cuca Fresca Importação e Exportação Ltda.
Da Quinta
Leblon Holdings LLC
Novo Fogo Agroindustrial Ltda.
Pitú Importadora e Exportadora Ltda.
*- List Not Exhaustive
<Strong>Chapter 1. TABLE OF CONTENTS</Strong>
<Strong>Chapter 2. Introduction to Cachaca Market </Strong>
2.1. Market Overview
2.2. Key Statistics and Report Highlights
2.3. Scope of the Comprehensive Study
2.3.1. Market Definition
2.3.2 Countries and Regions Covered
2.3.3 Research Objective
2.3.4 Units, Currency, and Conversions
2.3.5 Industry Value Chain
2.4. Key Market Segments
2.5. Key Companies
2.6. Study Period
<Strong>Chapter 3. Strategic Analysis Review</Strong>
3.1. Cachaca Pricing Analysis and Forecast
3.2. Porter’s Five Forces
3.3. Market Ecosystem
3.4. SWOT Analysis
3.5. Regulatory Scenario
3.3. Effects of Inflation, Russia-Ukraine War, moderating economic growth, and other macroeconomic factors
<Strong>Chapter 4. Competitive Landscape</Strong>
4.1. Market Share Analysis
4.1.1. Global Cachaca Market Share by Company, 2023
4.1.2. Product Offerings of Leading Cachaca Companies
4.2. Market Entropy
4.2.1. New Product Launches in the Industry
4.2.2. Mergers, Acquisitions, Joint ventures, and Partnerships
4.3. Key Strategies and Best Practices
<Strong>Chapter 5. Global Market Projections: Best, Reference, and Low Case Scenarios</Strong>
5.1. Growth Analysis- Case Scenario Definitions
5.2. Low Growth Case Scenario Forecasts
5.3. Reference Growth Case Scenario Forecasts
5.4. High Growth Case Scenario Forecasts
<Strong>Chapter 6. Market Dynamics</Strong>
6.1. Cachaca Market Drivers
6.2. Cachaca Market Challenges
6.6. Cachaca Market Opportunities
6.4. Cachaca Market Trends
<Strong>Chapter 7. Global Cachaca Market Outlook Trends</Strong>
7.1. Global Cachaca Revenue (USD Million) and CAGR (%) by Type (2021-2032)
7.2. Global Cachaca Revenue (USD Million) and CAGR (%) by Application (2021-2032)
7.3. Global Cachaca Revenue (USD Million) and CAGR (%) by Product (2021-2032)
<Strong>By Type</Strong>
Unaged (White/Silver)
Aged (Yello/Gold)
<Strong>By Sales Channel</Strong>
Online
Offline
<Strong>By Application</Strong>
Food And Beverage
Medical
Pharmaceutical
Others
<Strong>Chapter 8. Global Cachaca Regional Analysis and Outlook</Strong>
8.1. Global Cachaca Revenue (USD Million) By Regions (2021- 2032)
8.2. North America Cachaca Revenue (USD Million) by Country (2021-2032)
8.2.1. United States Cachaca Regional Analysis and Outlook
8.2.2. Canada Cachaca Regional Analysis and Outlook
8.2.3. Mexico Cachaca Regional Analysis and Outlook
8.3. Europe Cachaca Revenue (USD Million), by Country (2021-2032)
8.3.1. Germany Cachaca Regional Analysis and Outlook
8.3.2. France Cachaca Regional Analysis and Outlook
8.3.3. United Kingdom Cachaca Regional Analysis and Outlook
8.3.4. Spain Cachaca Regional Analysis and Outlook
8.3.5. Italy Cachaca Regional Analysis and Outlook
8.3.6. Russia Cachaca Regional Analysis and Outlook
8.3.7. Rest of Europe Cachaca Regional Analysis and Outlook
8.4. Asia Pacific Cachaca Revenue (USD Million) by Country (2021-2032)
8.4.1. China Cachaca Regional Analysis and Outlook
8.4.2. Japan Cachaca Regional Analysis and Outlook
8.4.3. India Cachaca Regional Analysis and Outlook
8.4.4. South Korea Cachaca Regional Analysis and Outlook
8.4.5. Australia Cachaca Regional Analysis and Outlook
8.4.6. South East Asia Cachaca Regional Analysis and Outlook
8.4.7. Rest of Asia Pacific Cachaca Regional Analysis and Outlook
8.5. South America Cachaca Revenue (USD Million), by Country (2021-2032)
8.5.1. Brazil Cachaca Regional Analysis and Outlook
8.5.2. Argentina Cachaca Regional Analysis and Outlook
8.5.3. Rest of South America Cachaca Regional Analysis and Outlook
8.6. Middle East and Africa Cachaca Revenue (USD Million) by Country (2021-2032)
8.6.1. Middle East Cachaca Regional Analysis and Outlook
8.6.2. Africa Cachaca Regional Analysis and Outlook
<Strong>Chapter 9. North America Cachaca Analysis and Outlook</Strong>
9.1. North America Cachaca Revenue (USD Million) by Segments (2021-2032)
9.1.1. North America Cachaca Revenue (USD Million) by Type (2021-2032)
9.1.2. North America Cachaca Revenue (USD Million) by Application (2021-2032)
9.1.3. North America Cachaca Revenue (USD Million) by Product (2021-2032)
<Strong>By Type</Strong>
Unaged (White/Silver)
Aged (Yello/Gold)
<Strong>By Sales Channel</Strong>
Online
Offline
<Strong>By Application</Strong>
Food And Beverage
Medical
Pharmaceutical
Others
<Strong>Chapter 10. Europe Cachaca Analysis and Outlook</Strong>
10.1. Europe Cachaca Revenue (USD Million), by Segments (USD Million) (2021-2032)
10.1.1. Europe Cachaca Revenue (USD Million) by Type (2021-2032)
10.1.2. Europe Cachaca Revenue (USD Million) by Application (2021-2032)
10.1.3. Europe Cachaca Revenue (USD Million) by Product (2021-2032)
<Strong>By Type</Strong>
Unaged (White/Silver)
Aged (Yello/Gold)
<Strong>By Sales Channel</Strong>
Online
Offline
<Strong>By Application</Strong>
Food And Beverage
Medical
Pharmaceutical
Others
<Strong>Chapter 11. Asia Pacific Cachaca Analysis and Outlook</Strong>
11.1. Asia Pacific Cachaca Revenue (USD Million), and Revenue (USD Million) by Segments (2021-2032)
11.1.1. Asia Pacific Cachaca Revenue (USD Million) by Type (2021-2032)
11.1.2. Asia Pacific Cachaca Revenue (USD Million) by Application (2021-2032)
11.1.3. Asia Pacific Cachaca Revenue (USD Million) by Product (2021-2032)
<Strong>By Type</Strong>
Unaged (White/Silver)
Aged (Yello/Gold)
<Strong>By Sales Channel</Strong>
Online
Offline
<Strong>By Application</Strong>
Food And Beverage
Medical
Pharmaceutical
Others
<Strong>Chapter 12. South America Cachaca Analysis and Outlook</Strong>
12.1. South America Cachaca Revenue (USD Million), by Segments (2021-2032)
12.1.1. South America Cachaca Revenue (USD Million) by Type (2021-2032)
12.1.2. South America Cachaca Revenue (USD Million) by Application (2021-2032)
12.1.3. South America Cachaca Revenue (USD Million) by Product (2021-2032)
<Strong>By Type</Strong>
Unaged (White/Silver)
Aged (Yello/Gold)
<Strong>By Sales Channel</Strong>
Online
Offline
<Strong>By Application</Strong>
Food And Beverage
Medical
Pharmaceutical
Others
<Strong>Chapter 13. Middle East and Africa Cachaca Analysis and Outlook</Strong>
13.1. Middle East and Africa Cachaca Revenue (USD Million), by Segments (2021-2032)
13.1.1. Middle East and Africa Cachaca Revenue (USD Million) by Type (2021-2032)
13.1.2. Middle East and Africa Cachaca Revenue (USD Million) by Application (2021-2032)
13.1.3. Middle East and Africa Cachaca Revenue (USD Million) by Product (2021-2032)
<Strong>By Type</Strong>
Unaged (White/Silver)
Aged (Yello/Gold)
<Strong>By Sales Channel</Strong>
Online
Offline
<Strong>By Application</Strong>
Food And Beverage
Medical
Pharmaceutical
Others
<Strong>Chapter 14. Cachaca Company Profiles</Strong>
14.1 Business Overview
14.2 Product Profiles
14.3 SWOT Profiles
14.5 Recent Developments
14.6 Financial Profile
List of Companies
BORCO-Marken-Import Matthiesen GmbH & Co. KG
Cuca Fresca Importação e Exportação Ltda.
Da Quinta
Leblon Holdings LLC
Novo Fogo Agroindustrial Ltda.
Pitú Importadora e Exportadora Ltda.
<Strong>15. Methodology and Data Sources</Strong>
15.1 Customization Offerings
15.2 Subscription Services
15.3 Related Reports
15.4 Publisher Expertise
<Strong>LIST OF TABLES</Strong>
Table 1 Market Segmentation Analysis
Table 2 Global Cachaca Market Share of Leading Companies, 2023
Table 3 Product Offerings of Leading Companies
Table 4 Low Growth Scenario Forecasts
Table 5 Reference Case Growth Scenario
Table 6 High Growth Case Scenario
Table 7 Global Cachaca Revenue (USD Million) And CAGR (%) By Type (2021-2032)
Table 8 Global Cachaca Revenue (USD Million) And CAGR (%) By Application (2021-2032)
Table 9 Global Cachaca Revenue (USD Million) And CAGR (%) By Product (2021-2032)
Table 10 Global Cachaca Market Revenue (USD Million) By Regions (2021-2032)
Table 11 Global Cachaca Market Share (%) By Regions (2021-2032)
Table 12 North America Cachaca Revenue (USD Million) By Country (2021-2032)
Table 13 Europe Cachaca Revenue (USD Million) By Country (2021-2032)
Table 14 Asia Pacific Cachaca Revenue (USD Million) By Country (2021-2032)
Table 15 South America Cachaca Revenue (USD Million) By Country (2021-2032)
Table 16 Middle East and Africa Cachaca Revenue (USD Million) By Region (2021-2032)
Table 17 North America Cachaca Revenue (USD Million) By Type (2021-2032)
Table 18 North America Cachaca Revenue (USD Million) By Application (2021-2032)
Table 19 North America Cachaca Revenue (USD Million) By Product (2021-2032)
Table 20 Europe Cachaca Revenue (USD Million) By Type (2021-2032)
Table 21 Europe Cachaca Revenue (USD Million) By Application (2021-2032)
Table 22 Europe Cachaca Revenue (USD Million) By Product (2021-2032)
Table 23 Asia Pacific Cachaca Revenue (USD Million) By Type (2021-2032)
Table 24 Asia Pacific Cachaca Revenue (USD Million) By Application (2021-2032)
Table 25 Asia Pacific Cachaca Revenue (USD Million) By Product (2021-2032)
Table 26 South America Cachaca Revenue (USD Million) By Type (2021-2032)
Table 27 South America Cachaca Revenue (USD Million) By Application (2021-2032)
Table 28 South America Cachaca Revenue (USD Million) By Product (2021-2032)
Table 29 Middle East and Africa Cachaca Revenue (USD Million) By Type (2021-2032)
Table 30 Middle East and Africa Cachaca Revenue (USD Million) By Application (2021-2032)
Table 31 Middle East and Africa Cachaca Revenue (USD Million) By Product (2021-2032)
<Strong>LIST OF FIGURES</Strong>
Figure 1. Market Scope
Figure 2. Pricing Forecasts Per Unit, 2023- 2032
Figure 3. Porter’s Five Forces
Figure 4. Global Cachaca Market Revenue (USD Million) By Regions (2021-2032)
Figure 5. Global Cachaca Market Share (%) By Regions (2023)
Figure 6. North America Cachaca Revenue (USD Million) By Country (2021-2032)
Figure 7. United States Cachaca Revenue (USD Million) By Country (2021-2032)
Figure 8. Canada Cachaca Revenue (USD Million) By Country (2021-2032)
Figure 9. Mexico Cachaca Revenue (USD Million) By Country (2021-2032)
Figure 10. Europe Cachaca Revenue (USD Million) By Country (2021-2032)
Figure 11. Germany Cachaca Revenue (USD Million) By Country (2021-2032)
Figure 12. France Cachaca Revenue (USD Million) By Country (2021-2032)
Figure 13. United Kingdom Cachaca Revenue (USD Million) By Country (2021-2032)
Figure 14. Spain Cachaca Revenue (USD Million) By Country (2021-2032)
Figure 15. Italy Cachaca Revenue (USD Million) By Country (2021-2032)
Figure 16. Russia Cachaca Revenue (USD Million) By Country (2021-2032)
Figure 17. Rest of Europe Cachaca Revenue (USD Million) By Country (2021-2032)
Figure 11. Asia Pacific Cachaca Revenue (USD Million) By Country (2021-2032)
Figure 12. China Cachaca Revenue (USD Million) By Country (2021-2032)
Figure 13. Japan Cachaca Revenue (USD Million) By Country (2021-2032)
Figure 14. India Cachaca Revenue (USD Million) By Country (2021-2032)
Figure 15. South Korea Cachaca Revenue (USD Million) By Country (2021-2032)
Figure 16. Australia Cachaca Revenue (USD Million) By Country (2021-2032)
Figure 17. South East Asia Cachaca Revenue (USD Million) By Country (2021-2032)
Figure 18. South America Cachaca Revenue (USD Million) By Country (2021-2032)
Figure 19. Brazil Cachaca Revenue (USD Million) By Country (2021-2032)
Figure 20. Argentina Cachaca Revenue (USD Million) By Country (2021-2032)
Figure 21. Rest of Asia Pacific Cachaca Revenue (USD Million) By Country (2021-2032)
Figure 22. Middle East and Africa Cachaca Revenue (USD Million) By Region (2021-2032)
Figure 23. Saudi Arabia Cachaca Revenue (USD Million) By Region (2021-2032)
Figure 24. The UAE Cachaca Revenue (USD Million) By Region (2021-2032)
Figure 25. Rest of Middle East Cachaca Revenue (USD Million) By Region (2021-2032)
Figure 26. South Africa Cachaca Revenue (USD Million) By Region (2021-2032)
Figure 27. Africa Cachaca Revenue (USD Million) By Region (2021-2032)
Figure 28. North America Cachaca Revenue (USD Million) By Type (2021-2032)
Figure 29. North America Cachaca Revenue (USD Million) By Application (2021-2032)
Figure 30. North America Cachaca Revenue (USD Million) By Product (2021-2032)
Figure 31. Europe Cachaca Revenue (USD Million) By Type (2021-2032)
Figure 32. Europe Cachaca Revenue (USD Million) By Application (2021-2032)
Figure 33. Europe Cachaca Revenue (USD Million) By Product (2021-2032)
Figure 34. Asia Pacific Cachaca Revenue (USD Million) By Type (2021-2032)
Figure 35. Asia Pacific Cachaca Revenue (USD Million) By Application (2021-2032)
Figure 36. Asia Pacific Cachaca Revenue (USD Million) By Product (2021-2032)
Figure 37. South America Cachaca Revenue (USD Million) By Type (2021-2032)
Figure 38. South America Cachaca Revenue (USD Million) By Application (2021-2032)
Figure 39. South America Cachaca Revenue (USD Million) By Product (2021-2032)
Figure 40. Middle East and Africa Cachaca Revenue (USD Million) By Type (2021-2032)
Figure 41. Middle East and Africa Cachaca Revenue (USD Million) By Application (2021-2032)
Figure 42. Middle East and Africa Cachaca Revenue (USD Million) By Product (2021-2032)
