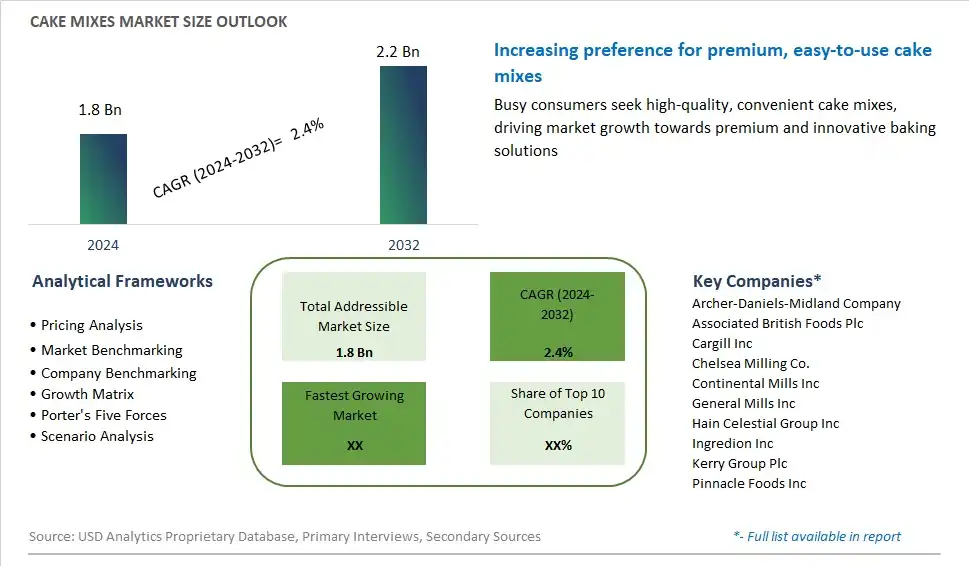
Global Cake Mixes Market Size is valued at $1.8 Billion in 2024 and is forecast to register a growth rate (CAGR) of 2.4% to reach $2.2 Billion by 2032.
The global Cake Mixes Market Comprehensive Study analyzes and forecasts the market size across 6 regions and 24 countries for diverse segments -By Flavor (Chocolate, Vanilla, Fruit, Others), By Distribution Channel (Online, Offline), By Application (Household, Commercial)
An Introduction to Cake Mixes Market
In 2024, the cake mixes market is flourishing, driven by the increasing demand for convenient and reliable baking solutions. Cake mixes offer home bakers the ease of preparing cakes with consistent results, making baking accessible to a broader audience. The market is characterized by a wide variety of options, from classic flavors like chocolate and vanilla to more innovative and seasonal varieties. Health-conscious consumers are seeking cake mixes that cater to dietary restrictions, leading to a rise in gluten-free, organic, and low-sugar options. Additionally, the trend towards premium and gourmet baking is prompting manufacturers to introduce high-quality mixes with natural ingredients and artisan-quality results, appealing to discerning bakers who want convenience without compromising on quality.
Cake Mixes Competitive Landscape
The market report analyses the leading companies in the industry including Archer-Daniels-Midland Company, Associated British Foods Plc, Cargill Inc, Chelsea Milling Co., Continental Mills Inc, General Mills Inc, Hain Celestial Group Inc, Ingredion Inc, Kerry Group Plc, Pinnacle Foods Inc, and Others.
Cake Mixes Market Dynamics
Cake Mixes Market Trend: Demand for Premium and Specialty Cake Mixes
One of the most prominent trends in the cake mixes market is the growing demand for premium and specialty varieties. Consumers are seeking higher-quality ingredients, unique flavors, and artisanal touches in their baked goods, leading to a rise in demand for upscale cake mixes. This trend is driven by a desire for indulgence and gourmet experiences, with consumers willing to pay a premium for cakes that offer superior taste, texture, and visual appeal. Premium cake mixes often feature natural flavors, organic ingredients, and innovative flavor combinations, catering to discerning consumers looking for elevated baking solutions. Additionally, specialty cake mixes targeting specific dietary preferences, such as gluten-free, vegan, or keto-friendly options, are gaining popularity among health-conscious consumers seeking convenient baking alternatives without compromising on taste.
Market Driver: Convenience and Time-Saving Solutions for Home Bakers
The primary driver of the cake mixes market is the demand for convenience and time-saving solutions for home bakers. With busy lifestyles and limited time for from-scratch baking, consumers are turning to cake mixes as a convenient and hassle-free option for satisfying their sweet cravings. Cake mixes offer a convenient solution by providing pre-measured ingredients and simple instructions, reducing the time and effort required for baking. Additionally, cake mixes appeal to novice bakers and individuals with limited baking skills, allowing them to create homemade cakes with consistent results. The convenience factor, coupled with the versatility to customize cakes with additional ingredients or decorations, makes cake mixes a staple in many households, driving steady demand in the market.
Market Opportunity: Expansion into Health-Conscious and Customizable Cake Mixes
A significant opportunity for the cake mixes market lies in expansion into health-conscious and customizable varieties. With the growing focus on health and wellness, consumers are seeking cake mixes that align with their dietary preferences and lifestyle choices. Manufacturers can capitalize on this opportunity by developing cake mixes made with natural, wholesome ingredients and free from artificial additives, preservatives, and allergens. Additionally, offering customizable cake mixes that cater to specific dietary needs, such as low-sugar, high-protein, or allergen-friendly options, allows brands to appeal to a broader consumer base. By providing options for health-conscious consumers and offering flexibility in flavor profiles and ingredient choices, manufacturers can differentiate themselves in the competitive cake mixes market and capture additional market share. Moreover, investing in marketing campaigns highlighting the health benefits and customization options of their cake mixes can further enhance brand visibility and attract new customers.
Cake Mixes Market Share Analysis: Chocolate held the dominant market share in 2024
Chocolate is the largest segment in the cake mixes market due to its universal appeal, indulgent taste, and versatility in baking applications. Chocolate cake mixes offer consumers the classic flavor profile they crave, with rich cocoa notes and a decadent taste that appeals to a wide range of palates. Whether it's for birthdays, holidays, or everyday indulgence, chocolate cakes are a popular choice among consumers of all ages. Further, the growing consumer preference for convenience and time-saving solutions further drives the demand for chocolate cake mixes, as they offer an easy way to bake delicious treats at home without the need for extensive preparation or specialized ingredients. As consumers continue to seek out simple and delicious baking options, the chocolate segment maintains its dominance in the cake mixes market, catering to the timeless craving for chocolatey goodness.
Cake Mixes Market Share Analysis: Online market is poised to register the fastest growth rae over the forecast period to 2032
The Online segment is the fastest-growing in the cake mixes market, propelled by the increasing consumer preference for convenience, wider product selection, and the growing trend of online shopping. With the rise of e-commerce platforms and the ease of doorstep delivery, more consumers are opting to purchase cake mixes online. Online retailers offer a vast array of cake mix brands, flavors, and specialty options, often at competitive prices, allowing consumers to easily browse and purchase their preferred products from the comfort of their homes. Additionally, the COVID-19 pandemic accelerated the adoption of online shopping as consumers sought safe and contactless purchasing options. The convenience of online shopping, coupled with the availability of subscription services and promotional discounts, drives the rapid growth of the Online segment in the cake mixes market. As consumers continue to prioritize convenience and accessibility in their shopping experiences, the Online segment is expected to maintain its momentum and expand its market share further.
Cake Mixes Market Share Analysis: Household held the dominant market share in 2024
The Household segment is the largest in the cake mixes market due to its widespread adoption among consumers for home baking purposes. Cake mixes offer convenience and simplicity, allowing individuals to effortlessly create homemade cakes with minimal effort and expertise required. The Household segment caters to home bakers of all skill levels, from novice cooks to experienced enthusiasts, who seek convenient solutions for baking delicious treats for various occasions such as birthdays, holidays, and everyday indulgence. Further, the growing trend of home baking, particularly during periods of lockdowns and social distancing, has further propelled the demand for cake mixes among consumers looking for enjoyable and rewarding activities to do at home. As consumers continue to prioritize convenience and enjoyment in their baking experiences, the Household segment maintains its dominance in the cake mixes market, catering to the timeless tradition of homemade baked goods.
Cake Mixes Market Segmentation
By Flavor
Chocolate
Vanilla
Fruit
Others
By Distribution Channel
Online
Offline
By Application
Household
Commercial
Countries Analyzed
North America (US, Canada, Mexico)
Europe (Germany, UK, France, Spain, Italy, Russia, Rest of Europe)
Asia Pacific (China, India, Japan, South Korea, Australia, South East Asia, Rest of Asia)
South America (Brazil, Argentina, Rest of South America)
Middle East and Africa (Saudi Arabia, UAE, Rest of Middle East, South Africa, Egypt, Rest of Africa)
Cake Mixes Companies Profiled in the Study
Archer-Daniels-Midland Company
Associated British Foods Plc
Cargill Inc
Chelsea Milling Co.
Continental Mills Inc
General Mills Inc
Hain Celestial Group Inc
Ingredion Inc
Kerry Group Plc
Pinnacle Foods Inc
*- List Not Exhaustive
Chapter 1. TABLE OF CONTENTS
Chapter 2. Introduction to Cake Mixes Market
2.1. Market Overview
2.2. Key Statistics and Report Highlights
2.3. Scope of the Comprehensive Study
2.3.1. Market Definition
2.3.2 Countries and Regions Covered
2.3.3 Research Objective
2.3.4 Units, Currency, and Conversions
2.3.5 Industry Value Chain
2.4. Key Market Segments
2.5. Key Companies
2.6. Study Period
Chapter 3. Strategic Analysis Review
3.1. Cake Mixes Pricing Analysis and Forecast
3.2. Porter’s Five Forces
3.3. Market Ecosystem
3.4. SWOT Analysis
3.5. Regulatory Scenario
3.3. Effects of Inflation, Russia-Ukraine War, moderating economic growth, and other macroeconomic factors
Chapter 4. Competitive Landscape
4.1. Market Share Analysis
4.1.1. Global Cake Mixes Market Share by Company, 2023
4.1.2. Product Offerings of Leading Cake Mixes Companies
4.2. Market Entropy
4.2.1. New Product Launches in the Industry
4.2.2. Mergers, Acquisitions, Joint ventures, and Partnerships
4.3. Key Strategies and Best Practices
Chapter 5. Global Market Projections: Best, Reference, and Low Case Scenarios
5.1. Growth Analysis- Case Scenario Definitions
5.2. Low Growth Case Scenario Forecasts
5.3. Reference Growth Case Scenario Forecasts
5.4. High Growth Case Scenario Forecasts
Chapter 6. Market Dynamics
6.1. Cake Mixes Market Drivers
6.2. Cake Mixes Market Challenges
6.6. Cake Mixes Market Opportunities
6.4. Cake Mixes Market Trends
Chapter 7. Global Cake Mixes Market Outlook Trends
7.1. Global Cake Mixes Revenue (USD Million) and CAGR (%) by Type (2021-2032)
7.2. Global Cake Mixes Revenue (USD Million) and CAGR (%) by Application (2021-2032)
7.3. Global Cake Mixes Revenue (USD Million) and CAGR (%) by Product (2021-2032)
By Flavor
Chocolate
Vanilla
Fruit
Others
By Distribution Channel
Online
Offline
By Application
Household
Commercial
Chapter 8. Global Cake Mixes Regional Analysis and Outlook
8.1. Global Cake Mixes Revenue (USD Million) By Regions (2021- 2032)
8.2. North America Cake Mixes Revenue (USD Million) by Country (2021-2032)
8.2.1. United States Cake Mixes Regional Analysis and Outlook
8.2.2. Canada Cake Mixes Regional Analysis and Outlook
8.2.3. Mexico Cake Mixes Regional Analysis and Outlook
8.3. Europe Cake Mixes Revenue (USD Million), by Country (2021-2032)
8.3.1. Germany Cake Mixes Regional Analysis and Outlook
8.3.2. France Cake Mixes Regional Analysis and Outlook
8.3.3. United Kingdom Cake Mixes Regional Analysis and Outlook
8.3.4. Spain Cake Mixes Regional Analysis and Outlook
8.3.5. Italy Cake Mixes Regional Analysis and Outlook
8.3.6. Russia Cake Mixes Regional Analysis and Outlook
8.3.7. Rest of Europe Cake Mixes Regional Analysis and Outlook
8.4. Asia Pacific Cake Mixes Revenue (USD Million) by Country (2021-2032)
8.4.1. China Cake Mixes Regional Analysis and Outlook
8.4.2. Japan Cake Mixes Regional Analysis and Outlook
8.4.3. India Cake Mixes Regional Analysis and Outlook
8.4.4. South Korea Cake Mixes Regional Analysis and Outlook
8.4.5. Australia Cake Mixes Regional Analysis and Outlook
8.4.6. South East Asia Cake Mixes Regional Analysis and Outlook
8.4.7. Rest of Asia Pacific Cake Mixes Regional Analysis and Outlook
8.5. South America Cake Mixes Revenue (USD Million), by Country (2021-2032)
8.5.1. Brazil Cake Mixes Regional Analysis and Outlook
8.5.2. Argentina Cake Mixes Regional Analysis and Outlook
8.5.3. Rest of South America Cake Mixes Regional Analysis and Outlook
8.6. Middle East and Africa Cake Mixes Revenue (USD Million) by Country (2021-2032)
8.6.1. Middle East Cake Mixes Regional Analysis and Outlook
8.6.2. Africa Cake Mixes Regional Analysis and Outlook
Chapter 9. North America Cake Mixes Analysis and Outlook
9.1. North America Cake Mixes Revenue (USD Million) by Segments (2021-2032)
9.1.1. North America Cake Mixes Revenue (USD Million) by Type (2021-2032)
9.1.2. North America Cake Mixes Revenue (USD Million) by Application (2021-2032)
9.1.3. North America Cake Mixes Revenue (USD Million) by Product (2021-2032)
By Flavor
Chocolate
Vanilla
Fruit
Others
By Distribution Channel
Online
Offline
By Application
Household
Commercial
Chapter 10. Europe Cake Mixes Analysis and Outlook
10.1. Europe Cake Mixes Revenue (USD Million), by Segments (USD Million) (2021-2032)
10.1.1. Europe Cake Mixes Revenue (USD Million) by Type (2021-2032)
10.1.2. Europe Cake Mixes Revenue (USD Million) by Application (2021-2032)
10.1.3. Europe Cake Mixes Revenue (USD Million) by Product (2021-2032)
By Flavor
Chocolate
Vanilla
Fruit
Others
By Distribution Channel
Online
Offline
By Application
Household
Commercial
Chapter 11. Asia Pacific Cake Mixes Analysis and Outlook
11.1. Asia Pacific Cake Mixes Revenue (USD Million), and Revenue (USD Million) by Segments (2021-2032)
11.1.1. Asia Pacific Cake Mixes Revenue (USD Million) by Type (2021-2032)
11.1.2. Asia Pacific Cake Mixes Revenue (USD Million) by Application (2021-2032)
11.1.3. Asia Pacific Cake Mixes Revenue (USD Million) by Product (2021-2032)
By Flavor
Chocolate
Vanilla
Fruit
Others
By Distribution Channel
Online
Offline
By Application
Household
Commercial
Chapter 12. South America Cake Mixes Analysis and Outlook
12.1. South America Cake Mixes Revenue (USD Million), by Segments (2021-2032)
12.1.1. South America Cake Mixes Revenue (USD Million) by Type (2021-2032)
12.1.2. South America Cake Mixes Revenue (USD Million) by Application (2021-2032)
12.1.3. South America Cake Mixes Revenue (USD Million) by Product (2021-2032)
By Flavor
Chocolate
Vanilla
Fruit
Others
By Distribution Channel
Online
Offline
By Application
Household
Commercial
Chapter 13. Middle East and Africa Cake Mixes Analysis and Outlook
13.1. Middle East and Africa Cake Mixes Revenue (USD Million), by Segments (2021-2032)
13.1.1. Middle East and Africa Cake Mixes Revenue (USD Million) by Type (2021-2032)
13.1.2. Middle East and Africa Cake Mixes Revenue (USD Million) by Application (2021-2032)
13.1.3. Middle East and Africa Cake Mixes Revenue (USD Million) by Product (2021-2032)
By Flavor
Chocolate
Vanilla
Fruit
Others
By Distribution Channel
Online
Offline
By Application
Household
Commercial
Chapter 14. Cake Mixes Company Profiles
14.1 Business Overview
14.2 Product Profiles
14.3 SWOT Profiles
14.5 Recent Developments
14.6 Financial Profile
List of Companies
Archer-Daniels-Midland Company
Associated British Foods Plc
Cargill Inc
Chelsea Milling Co.
Continental Mills Inc
General Mills Inc
Hain Celestial Group Inc
Ingredion Inc
Kerry Group Plc
Pinnacle Foods Inc
15. Methodology and Data Sources
15.1 Customization Offerings
15.2 Subscription Services
15.3 Related Reports
15.4 Publisher Expertise
LIST OF TABLES
Table 1 Market Segmentation Analysis
Table 2 Global Cake Mixes Market Share of Leading Companies, 2023
Table 3 Product Offerings of Leading Companies
Table 4 Low Growth Scenario Forecasts
Table 5 Reference Case Growth Scenario
Table 6 High Growth Case Scenario
Table 7 Global Cake Mixes Revenue (USD Million) And CAGR (%) By Type (2021-2032)
Table 8 Global Cake Mixes Revenue (USD Million) And CAGR (%) By Application (2021-2032)
Table 9 Global Cake Mixes Revenue (USD Million) And CAGR (%) By Product (2021-2032)
Table 10 Global Cake Mixes Market Revenue (USD Million) By Regions (2021-2032)
Table 11 Global Cake Mixes Market Share (%) By Regions (2021-2032)
Table 12 North America Cake Mixes Revenue (USD Million) By Country (2021-2032)
Table 13 Europe Cake Mixes Revenue (USD Million) By Country (2021-2032)
Table 14 Asia Pacific Cake Mixes Revenue (USD Million) By Country (2021-2032)
Table 15 South America Cake Mixes Revenue (USD Million) By Country (2021-2032)
Table 16 Middle East and Africa Cake Mixes Revenue (USD Million) By Region (2021-2032)
Table 17 North America Cake Mixes Revenue (USD Million) By Type (2021-2032)
Table 18 North America Cake Mixes Revenue (USD Million) By Application (2021-2032)
Table 19 North America Cake Mixes Revenue (USD Million) By Product (2021-2032)
Table 20 Europe Cake Mixes Revenue (USD Million) By Type (2021-2032)
Table 21 Europe Cake Mixes Revenue (USD Million) By Application (2021-2032)
Table 22 Europe Cake Mixes Revenue (USD Million) By Product (2021-2032)
Table 23 Asia Pacific Cake Mixes Revenue (USD Million) By Type (2021-2032)
Table 24 Asia Pacific Cake Mixes Revenue (USD Million) By Application (2021-2032)
Table 25 Asia Pacific Cake Mixes Revenue (USD Million) By Product (2021-2032)
Table 26 South America Cake Mixes Revenue (USD Million) By Type (2021-2032)
Table 27 South America Cake Mixes Revenue (USD Million) By Application (2021-2032)
Table 28 South America Cake Mixes Revenue (USD Million) By Product (2021-2032)
Table 29 Middle East and Africa Cake Mixes Revenue (USD Million) By Type (2021-2032)
Table 30 Middle East and Africa Cake Mixes Revenue (USD Million) By Application (2021-2032)
Table 31 Middle East and Africa Cake Mixes Revenue (USD Million) By Product (2021-2032)
LIST OF FIGURES
Figure 1. Market Scope
Figure 2. Pricing Forecasts Per Unit, 2023- 2032
Figure 3. Porter’s Five Forces
Figure 4. Global Cake Mixes Market Revenue (USD Million) By Regions (2021-2032)
Figure 5. Global Cake Mixes Market Share (%) By Regions (2023)
Figure 6. North America Cake Mixes Revenue (USD Million) By Country (2021-2032)
Figure 7. United States Cake Mixes Revenue (USD Million) By Country (2021-2032)
Figure 8. Canada Cake Mixes Revenue (USD Million) By Country (2021-2032)
Figure 9. Mexico Cake Mixes Revenue (USD Million) By Country (2021-2032)
Figure 10. Europe Cake Mixes Revenue (USD Million) By Country (2021-2032)
Figure 11. Germany Cake Mixes Revenue (USD Million) By Country (2021-2032)
Figure 12. France Cake Mixes Revenue (USD Million) By Country (2021-2032)
Figure 13. United Kingdom Cake Mixes Revenue (USD Million) By Country (2021-2032)
Figure 14. Spain Cake Mixes Revenue (USD Million) By Country (2021-2032)
Figure 15. Italy Cake Mixes Revenue (USD Million) By Country (2021-2032)
Figure 16. Russia Cake Mixes Revenue (USD Million) By Country (2021-2032)
Figure 17. Rest of Europe Cake Mixes Revenue (USD Million) By Country (2021-2032)
Figure 11. Asia Pacific Cake Mixes Revenue (USD Million) By Country (2021-2032)
Figure 12. China Cake Mixes Revenue (USD Million) By Country (2021-2032)
Figure 13. Japan Cake Mixes Revenue (USD Million) By Country (2021-2032)
Figure 14. India Cake Mixes Revenue (USD Million) By Country (2021-2032)
Figure 15. South Korea Cake Mixes Revenue (USD Million) By Country (2021-2032)
Figure 16. Australia Cake Mixes Revenue (USD Million) By Country (2021-2032)
Figure 17. South East Asia Cake Mixes Revenue (USD Million) By Country (2021-2032)
Figure 18. South America Cake Mixes Revenue (USD Million) By Country (2021-2032)
Figure 19. Brazil Cake Mixes Revenue (USD Million) By Country (2021-2032)
Figure 20. Argentina Cake Mixes Revenue (USD Million) By Country (2021-2032)
Figure 21. Rest of Asia Pacific Cake Mixes Revenue (USD Million) By Country (2021-2032)
Figure 22. Middle East and Africa Cake Mixes Revenue (USD Million) By Region (2021-2032)
Figure 23. Saudi Arabia Cake Mixes Revenue (USD Million) By Region (2021-2032)
Figure 24. The UAE Cake Mixes Revenue (USD Million) By Region (2021-2032)
Figure 25. Rest of Middle East Cake Mixes Revenue (USD Million) By Region (2021-2032)
Figure 26. South Africa Cake Mixes Revenue (USD Million) By Region (2021-2032)
Figure 27. Africa Cake Mixes Revenue (USD Million) By Region (2021-2032)
Figure 28. North America Cake Mixes Revenue (USD Million) By Type (2021-2032)
Figure 29. North America Cake Mixes Revenue (USD Million) By Application (2021-2032)
Figure 30. North America Cake Mixes Revenue (USD Million) By Product (2021-2032)
Figure 31. Europe Cake Mixes Revenue (USD Million) By Type (2021-2032)
Figure 32. Europe Cake Mixes Revenue (USD Million) By Application (2021-2032)
Figure 33. Europe Cake Mixes Revenue (USD Million) By Product (2021-2032)
Figure 34. Asia Pacific Cake Mixes Revenue (USD Million) By Type (2021-2032)
Figure 35. Asia Pacific Cake Mixes Revenue (USD Million) By Application (2021-2032)
Figure 36. Asia Pacific Cake Mixes Revenue (USD Million) By Product (2021-2032)
Figure 37. South America Cake Mixes Revenue (USD Million) By Type (2021-2032)
Figure 38. South America Cake Mixes Revenue (USD Million) By Application (2021-2032)
Figure 39. South America Cake Mixes Revenue (USD Million) By Product (2021-2032)
Figure 40. Middle East and Africa Cake Mixes Revenue (USD Million) By Type (2021-2032)
Figure 41. Middle East and Africa Cake Mixes Revenue (USD Million) By Application (2021-2032)
Figure 42. Middle East and Africa Cake Mixes Revenue (USD Million) By Product (2021-2032)
By Flavor
Chocolate
Vanilla
Fruit
Others
By Distribution Channel
Online
Offline
By Application
Household
Commercial
Countries Analyzed
North America (US, Canada, Mexico)
Europe (Germany, UK, France, Spain, Italy, Russia, Rest of Europe)
Asia Pacific (China, India, Japan, South Korea, Australia, South East Asia, Rest of Asia)
South America (Brazil, Argentina, Rest of South America)
Middle East and Africa (Saudi Arabia, UAE, Rest of Middle East, South Africa, Egypt, Rest of Africa)
